Estimated zip code population in 2022: 7,184 Zip code population in 2010: 7,281 Zip code population in 2000: 7,421
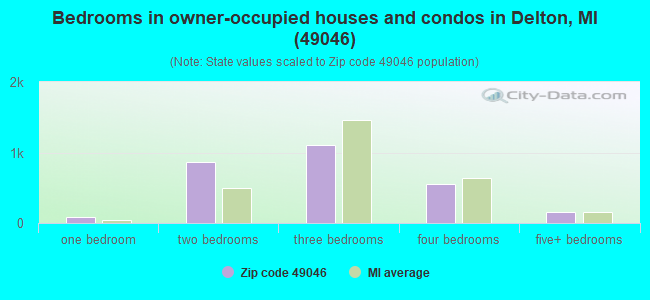
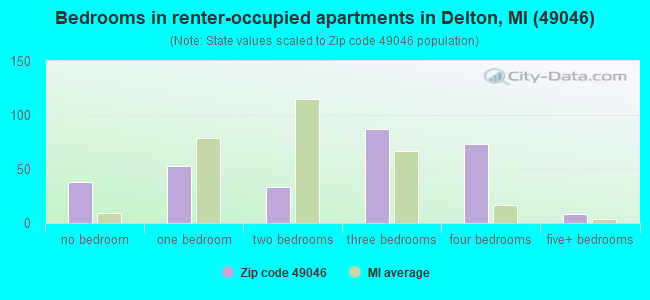
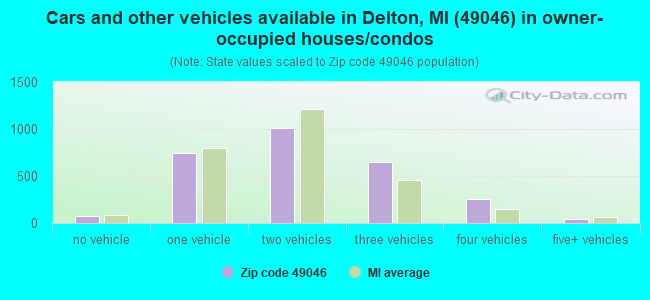
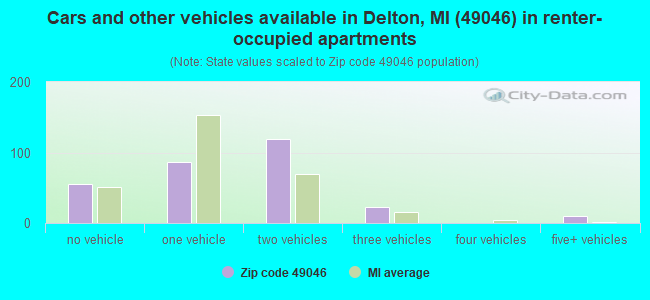
Houses and condos: 3,766 Renter-occupied apartments: 295
% of renters here:
10%
State:
27%
March 2022 cost of living index in zip code 49046: 82.0 (low, U.S. average is 100)
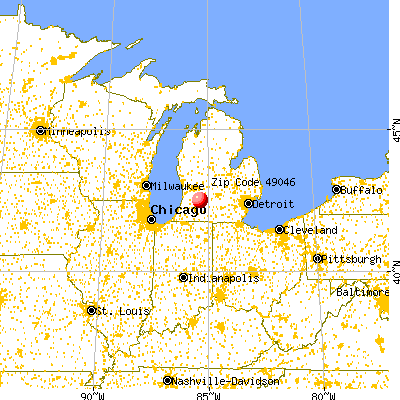
Land area: 79.0 sq. mi. Water area: 7.4 sq. mi.
Population density: 91 people per square mile
(very low).
OSM Map
General Map
Google Map
MSN Map
OSM Map
General Map
Google Map
MSN Map
OSM Map
General Map
Google Map
MSN Map
OSM Map
General Map
Google Map
MSN Map
Please wait while loading the map...
Real estate property taxes paid for housing units in 2022:
This zip code:
1.0% ($2,429)
Michigan:
1.2% ($2,746)
Median real estate property taxes paid for housing units with mortgages in 2022: $2,577 (1.0%) Median real estate property taxes paid for housing units with no mortgage in 2022: $2,149 (0.8%)
Business Search- 14 Million verified businesses
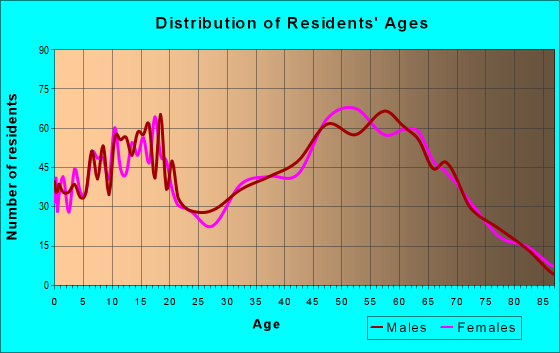
Males: 3,762
(52.4%)
Females: 3,421
(47.6%)
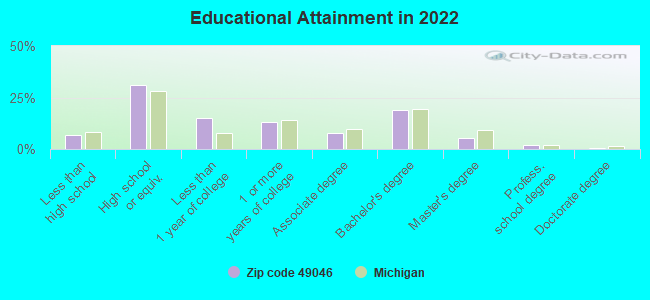
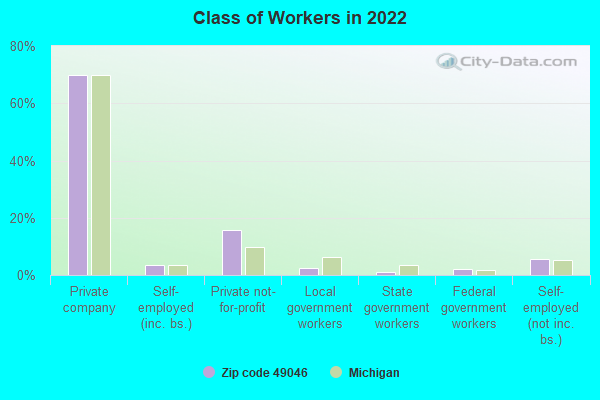
For population 25 years and over in 49046:
High school or higher: 93.1%
Bachelor's degree or higher: 26.3%
Graduate or professional degree: 7.4%
Unemployed: 3.0%
Mean travel time to work (commute): 30.9 minutes
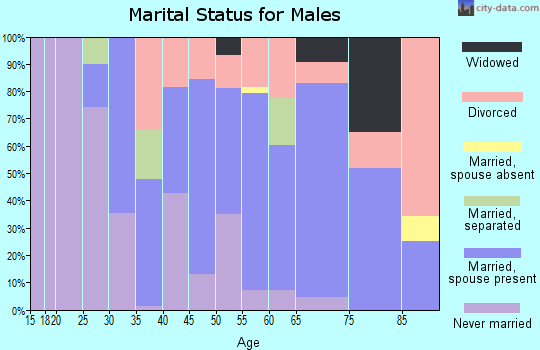
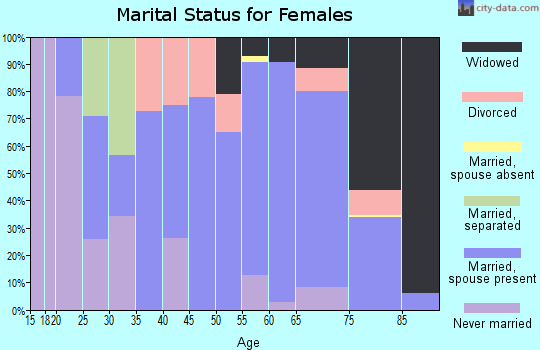
For population 15 years and over in 49046:
Never married: 20.6%
Now married: 60.4%
Separated: 1.1%
Widowed: 6.4%
Divorced: 11.5%
Zip code 49046 compared to state average:
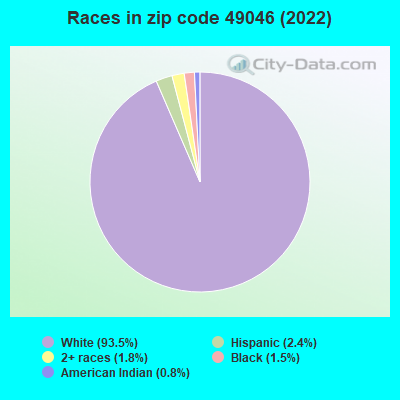
Black race population percentage significantly below state average.
Hispanic race population percentage below state average.
Median age significantly above state average.
Foreign-born population percentage significantly below state average.
Renting percentage significantly below state average.
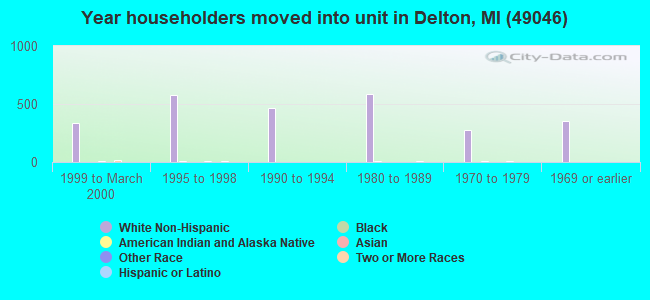
Length of stay since moving in significantly above state average.
Averages for the 2020 tax year for zip code 49046, filed in 2021:
Average Adjusted Gross Income (AGI) in 2020: $65,739 (Individual Income Tax Returns)
Here:
$65,739
State:
$68,945
Salary/wage: $54,614 (reported on 76.1% of returns)
Here:
$54,614
State:
$57,142
(% of AGI for various income ranges: 959.6% for AGIs below $25k, 3103.6% for AGIs $25k-50k, 5925.1% for AGIs $50k-75k, 8881.2% for AGIs $75k-100k, 16902.1% for AGIs $100k-200k, 74876.7% for AGIs over 200k)
Taxable interest for individuals: $1,037 (reported on 35.7% of returns)
This zip code:
$1,037
Michigan:
$1,630
(% of AGI for various income ranges: 13.4% for AGIs below $25k, 27.8% for AGIs $25k-50k, 35.6% for AGIs $50k-75k, 48.8% for AGIs $75k-100k, 67.5% for AGIs $100k-200k, 1813.3% for AGIs over 200k)
Ordinary dividends: $5,358 (reported on 19.0% of returns)
Here:
$5,358
State:
$6,972
(% of AGI for various income ranges: 31.4% for AGIs below $25k, 66.0% for AGIs $25k-50k, 80.2% for AGIs $50k-75k, 146.8% for AGIs $75k-100k, 378.6% for AGIs $100k-200k, 3686.7% for AGIs over 200k)
Net capital gain/loss in AGI: +$12,805 (reported on 16.4% of returns)
Here:
+$12,805
State:
+$20,064
(% of AGI for various income ranges: 14.3% for AGIs below $25k, 42.8% for AGIs $25k-50k, 75.9% for AGIs $50k-75k, 203.6% for AGIs $75k-100k, 595.7% for AGIs $100k-200k, 14726.7% for AGIs over 200k)
Profit/loss from business: +$13,516 (reported on 12.4% of returns)
Here:
+$13,516
State:
+$11,172
(% of AGI for various income ranges: 74.6% for AGIs below $25k, 110.6% for AGIs $25k-50k, 296.6% for AGIs $50k-75k, 177.6% for AGIs $75k-100k, 625.4% for AGIs $100k-200k, 3693.3% for AGIs over 200k)
Taxable individual retirement arrangement distribution: $21,726 (reported on 14.4% of returns)
49046:
$21,726
Michigan:
$19,803
(% of AGI for various income ranges: 101.9% for AGIs below $25k, 155.4% for AGIs $25k-50k, 352.2% for AGIs $50k-75k, 679.2% for AGIs $75k-100k, 1417.1% for AGIs $100k-200k, 6526.7% for AGIs over 200k)
Total itemized deductions: $32,744 (reported on 4.6% of returns)
Here:
$32,744
State:
$34,117
(% of AGI for various income ranges: 224.6% for AGIs $50k-75k, 198.4% for AGIs $75k-100k, 479.3% for AGIs $100k-200k, 8266.7% for AGIs over 200k)
Charity contributions: $9,991 (reported on 3.2% of returns)
Here:
$9,991
State:
$13,548
(% of AGI for various income ranges: 36.8% for AGIs $50k-75k, 98.9% for AGIs $100k-200k, 2236.7% for AGIs over 200k)
Taxes paid: $6,619 (reported on 4.6% of returns)
49046:
$6,619
State:
$7,972
(% of AGI for various income ranges: 51.5% for AGIs $50k-75k, 50.4% for AGIs $75k-100k, 136.1% for AGIs $100k-200k, 1136.7% for AGIs over 200k)
Earned income credit: $2,062 (reported on 11.5% of returns)
Here:
$2,062
State:
$2,251
(% of AGI for various income ranges: 63.6% for AGIs below $25k, 52.8% for AGIs $25k-50k)
Percentage of individuals using paid preparers for their 2020 taxes: 93.7%
Here:
94%
State:
93%
(% for various income ranges: 92.5% for AGIs below $25k, 92.9% for AGIs $25k-50k, 94.6% for AGIs $50k-75k, 94.7% for AGIs $75k-100k, 94.1% for AGIs $100k-200k, 100.0% for AGIs over 200k)
Averages for the 2012 tax year for zip code 49046, filed in 2013:
Average Adjusted Gross Income (AGI) in 2012: $50,601 (Individual Income Tax Returns)
Here:
$50,601
State:
$55,609
Salary/wage: $43,029 (reported on 79.9% of returns)
Here:
$43,029
State:
$46,782
(% of AGI for various income ranges: 65.1% for AGIs below $25k, 69.8% for AGIs $25k-50k, 71.4% for AGIs $50k-75k, 76.8% for AGIs $75k-100k, 73.2% for AGIs $100k-200k, 43.2% for AGIs over 200k)
Taxable interest for individuals: $1,084 (reported on 35.6% of returns)
This zip code:
$1,084
Michigan:
$1,491
(% of AGI for various income ranges: 1.5% for AGIs below $25k, 0.7% for AGIs $25k-50k, 0.7% for AGIs $50k-75k, 0.3% for AGIs $75k-100k, 0.4% for AGIs $100k-200k, 1.7% for AGIs over 200k)
Ordinary dividends: $4,763 (reported on 20.1% of returns)
Here:
$4,763
State:
$6,225
(% of AGI for various income ranges: 1.4% for AGIs below $25k, 1.3% for AGIs $25k-50k, 1.5% for AGIs $50k-75k, 1.3% for AGIs $75k-100k, 1.9% for AGIs $100k-200k, 4.3% for AGIs over 200k)
Net capital gain/loss in AGI: +$7,743 (reported on 13.6% of returns)
Here:
+$7,743
State:
+$9,326
(% of AGI for various income ranges: 0.4% for AGIs $25k-50k, 1.2% for AGIs $50k-75k, 0.4% for AGIs $75k-100k, 1.7% for AGIs $100k-200k, 9.4% for AGIs over 200k)
Profit/loss from business: +$10,249 (reported on 14.6% of returns)
Here:
+$10,249
State:
+$11,523
(% of AGI for various income ranges: 5.9% for AGIs below $25k, 3.5% for AGIs $25k-50k, 1.7% for AGIs $50k-75k, 1.1% for AGIs $75k-100k, 5.6% for AGIs $100k-200k)
Taxable individual retirement arrangement distribution: $15,800 (reported on 14.6% of returns)
49046:
$15,800
Michigan:
$15,298
(% of AGI for various income ranges: 5.4% for AGIs below $25k, 4.6% for AGIs $25k-50k, 4.0% for AGIs $50k-75k, 3.2% for AGIs $75k-100k, 8.3% for AGIs $100k-200k)
Total itemized deductions: $19,101 (20% of AGI, reported on 27.2% of returns)
Here:
$19,101
State:
$21,628
Here:
19.6% of AGI
State:
18.4% of AGI
(% of AGI for various income ranges: 8.6% for AGIs below $25k, 8.5% for AGIs $25k-50k, 9.5% for AGIs $50k-75k, 10.0% for AGIs $75k-100k, 12.5% for AGIs $100k-200k, 11.3% for AGIs over 200k)
Charity contributions: $3,620 (reported on 20.1% of returns)
Here:
$3,620
State:
$4,225
(% of AGI for various income ranges: 0.5% for AGIs below $25k, 1.1% for AGIs $25k-50k, 1.0% for AGIs $50k-75k, 1.4% for AGIs $75k-100k, 2.1% for AGIs $100k-200k, 2.0% for AGIs over 200k)
Taxes paid: $6,483 (reported on 27.2% of returns)
49046:
$6,483
State:
$8,327
(% of AGI for various income ranges: 1.4% for AGIs below $25k, 2.0% for AGIs $25k-50k, 2.8% for AGIs $50k-75k, 3.4% for AGIs $75k-100k, 4.8% for AGIs $100k-200k, 5.4% for AGIs over 200k)
Earned income credit: $2,042 (reported on 16.4% of returns)
Here:
$2,042
State:
$2,306
(% of AGI for various income ranges: 5.1% for AGIs below $25k, 1.1% for AGIs $25k-50k)
Percentage of individuals using paid preparers for their 2012 taxes: 55.4%
Here:
55%
State:
57%
(% for various income ranges: 49.2% for AGIs below $25k, 57.5% for AGIs $25k-50k, 62.3% for AGIs $50k-75k, 59.4% for AGIs $75k-100k, 56.7% for AGIs $100k-200k, 80.0% for AGIs over 200k)
Averages for the 2004 tax year for zip code 49046, filed in 2005:
Average Adjusted Gross Income (AGI) in 2004: $41,143 (Individual Income Tax Returns)
Here:
$41,143
State:
$48,204
Salary/wage: $38,291 (reported on 83.0% of returns)
Here:
$38,291
State:
$42,791
(% of AGI for various income ranges: 84.2% for AGIs below $10k, 64.0% for AGIs $10k-25k, 78.7% for AGIs $25k-50k, 83.2% for AGIs $50k-75k, 80.1% for AGIs $75k-100k, 71.6% for AGIs over 100k)
Taxable interest for individuals: $1,376 (reported on 46.3% of returns)
This zip code:
$1,376
Michigan:
$1,725
(% of AGI for various income ranges: 5.3% for AGIs below $10k, 3.1% for AGIs $10k-25k, 1.2% for AGIs $25k-50k, 1.1% for AGIs $50k-75k, 1.3% for AGIs $75k-100k, 1.7% for AGIs over 100k)
Taxable dividends: $2,546 (reported on 22.5% of returns)
Here:
$2,546
State:
$3,420
(% of AGI for various income ranges: 3.3% for AGIs below $10k, 1.6% for AGIs $10k-25k, 0.8% for AGIs $25k-50k, 0.7% for AGIs $50k-75k, 1.0% for AGIs $75k-100k, 2.8% for AGIs over 100k)
Net capital gain/loss: +$4,422 (reported on 17.2% of returns)
Here:
+$4,422
State:
+$8,532
(% of AGI for various income ranges: -0.6% for AGIs below $10k, -0.1% for AGIs $10k-25k, 1.1% for AGIs $25k-50k, 0.7% for AGIs $50k-75k, 1.7% for AGIs $75k-100k, 5.2% for AGIs over 100k)
Profit/loss from business: +$7,296 (reported on 16.6% of returns)
Here:
+$7,296
State:
+$9,547
(% of AGI for various income ranges: 12.3% for AGIs below $10k, 6.3% for AGIs $10k-25k, 2.8% for AGIs $25k-50k, 1.4% for AGIs $50k-75k, 1.9% for AGIs $75k-100k, 3.5% for AGIs over 100k)
IRA payment deduction: $2,809 (reported on 2.1% of returns)
49046:
$2,809
Michigan:
$2,875
(% of AGI for various income ranges: 0.2% for AGIs $10k-25k, 0.2% for AGIs $25k-50k, 0.2% for AGIs $50k-75k, 0.2% for AGIs $75k-100k)
Total itemized deductions: $15,629 (23% of AGI, reported on 33.4% of returns)
Here:
$15,629
State:
$18,509
Here:
22.6% of AGI
State:
20.7% of AGI
(% of AGI for various income ranges: 15.0% for AGIs below $10k, 9.0% for AGIs $10k-25k, 12.0% for AGIs $25k-50k, 12.2% for AGIs $50k-75k, 15.0% for AGIs $75k-100k, 13.5% for AGIs over 100k)
Charity contributions deductions: $2,670 (4% of AGI, reported on 26.3% of returns)
Here:
$2,670
State:
$3,365
Here:
3.6% of AGI
State:
3.6% of AGI
(% of AGI for various income ranges: 0.4% for AGIs below $10k, 0.9% for AGIs $10k-25k, 1.2% for AGIs $25k-50k, 1.3% for AGIs $50k-75k, 2.2% for AGIs $75k-100k, 2.8% for AGIs over 100k)
Total tax: $5,127 (reported on 75.8% of returns)
49046:
$5,127
State:
$7,691
(% of AGI for various income ranges: 3.8% for AGIs below $10k, 4.0% for AGIs $10k-25k, 6.4% for AGIs $25k-50k, 8.2% for AGIs $50k-75k, 10.3% for AGIs $75k-100k, 16.1% for AGIs over 100k)
Earned income credit: $1,654 (reported on 13.2% of returns)
Here:
$1,654
State:
$1,737
Percentage of individuals using paid preparers for their 2004 taxes: 59.6%
Here:
60%
State:
60%
(% for various income ranges: 52.2% for AGIs below $10k, 60.4% for AGIs $10k-25k, 61.8% for AGIs $25k-50k, 59.9% for AGIs $50k-75k, 61.7% for AGIs $75k-100k, 67.8% for AGIs over 100k)
Household received Food Stamps/SNAP in the past 12 months: 206 Household did not receive Food Stamps/SNAP in the past 12 months: 2,842
Women who had a birth in the past 12 months: 25 (26 now married, 0 unmarried) Women who did not have a birth in the past 12 months: 1,353 (766 now married, 581 unmarried)
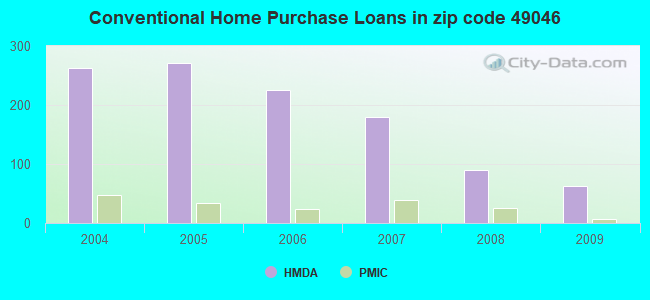
Housing units in zip code 49046 with a mortgage: 1,613 (144 second mortgage, 151 both second mortgage and home equity loan) Houses without a mortgage: 122
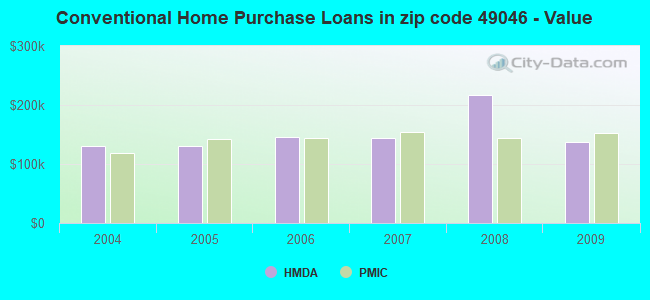
Median monthly owner costs for units with a mortgage: $1,558 Median monthly owner costs for units without a mortgage: $517
Residents with income below the poverty level in 2022:
This zip code:
8.1%
Whole state:
13.4%
Residents with income below 50% of the poverty level in 2022:
This zip code:
5.3%
Whole state:
6.9%
Median number of rooms in houses and condos:
Here:
6.1
State:
6.5
Median number of rooms in apartments:
Here:
5.0
State:
4.3
Notable locations in this zip code not listed on our city pages
Notable locations in zip code 49046: Jones Lake Campground (A), Mullenhurst Golf Course (B), Delton Fire Department (C), Mercy Ambulance Service Delton (D), Bernard Historical Museum (E), Delton District Library (F). Display/hide their locations on the map
Churches in zip code 49046 include: McCallum Church (A), Saint Ambrose Church (B), Milo Bible Church (C), Seventh-Day Adventist Church (D), Prairieville Bible Church (E), Faith United Methodist Church (F), Inter Lakes Baptist Church (G). Display/hide their locations on the map
Cemeteries: Prairieville Township Cemetery (1), McCallum Cemetery (2), Banfield Cemetery (3), North Hickory Cemetery (4). Display/hide their locations on the map
Lakes and swamps: Marshall Lake (A), Purdy Lake (B), Loomis Lake (C), Pleasant Lake (D), Long Lake (E), Wall Lake (F), Little Gilkey Lake (G), Little Cedar Lake (H). Display/hide their locations on the map
578 married couples with children.
273 single-parent households (112 men, 161 women).
97.3% of residents of 49046 zip code speak English at home.
1.8% of residents speak Spanish at home (100% very well).
1.1% of residents speak other Indo-European language at home (100% very well).
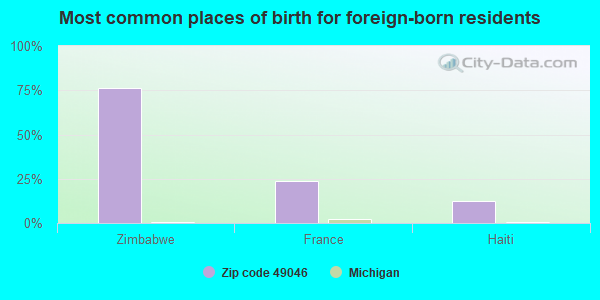
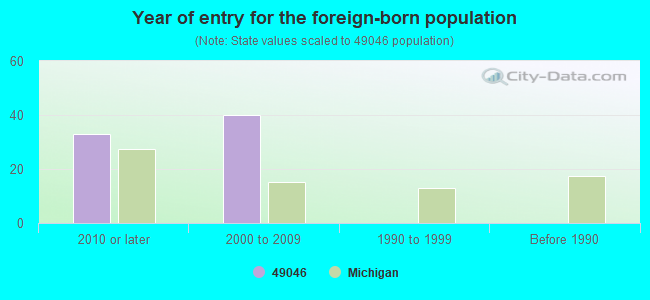
Foreign born population: 72 (1.0%) (59.6% of them are naturalized citizens)
This zip code:
1.0%
Whole state:
6.9%
76%Zimbabwe
24%France
12%Haiti
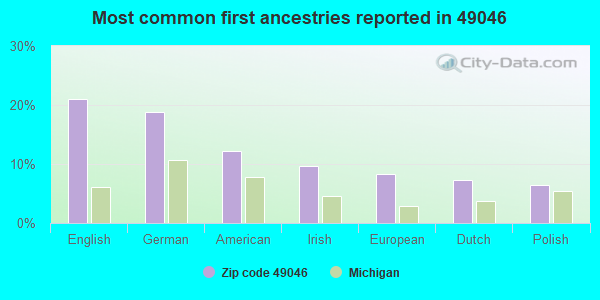
21%English
19%German
12%American
10%Irish
8%European
7%Dutch
6%Polish
Year of entry for the foreign-born population
332010 or later
402000 to 2009
01990 to 1999
0Before 1990
Facilities with environmental interests located in this zip code:
MI DEPT/STATE POLICE (10484 NORRIS in DELTON, MI)
(Resource Conservation and Recovery Act (tracking hazardous waste)) Alternative names: MI DEPT/STATE POLICE (E)
ENVIRONMENTAL TECHNOLOGY LLC (10075 KINGSBURY ROAD in DELTON, MI)
(Resource Conservation and Recovery Act (tracking hazardous waste)) Business NAICS classification: GENERAL AUTOMOTIVE REPAIR.
BATTS LEWIS PROPERTIES (149 CLOVERDALE RD in DELTON, MI)
Conditionally Exempt Small Quantity Generators, less than 100 kg/month of hazardous waste (Resource Conservation and Recovery Act (tracking hazardous waste)) - notification Organizations: BATTS DR LEWIS (CONTACT/OWNER)
Housing units lacking complete plumbing facilities: 0.6% Housing units lacking complete kitchen facilities: 3.0%
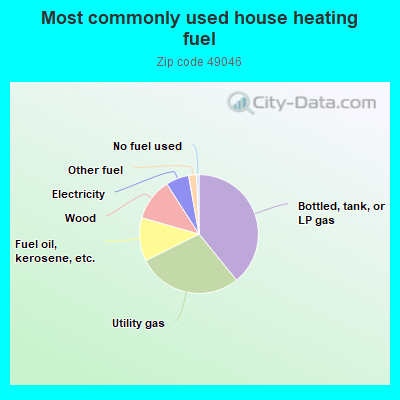
39.2%Bottled, tank, or LP gas
28.5%Utility gas
11.8%Fuel oil, kerosene, etc.
11.5%Wood
6.3%Electricity
2.2%Other fuel
0.6%No fuel used
Population in 1990: 7,306. Population change in the 1990s: +115 (+1.6%).
Place of birth for U.S.-born residents:
This state: 5,850
Northeast: 157
Midwest: 675
South: 280
West: 151
67% of the 49046 zip code residents lived in the same house 5 years ago. Out of people who lived in different houses, 43% lived in this county. Out of people who lived in different counties, 50% lived in Michigan.
93% of the 49046 zip code residents lived in the same house 1 year ago. Out of people who lived in different houses, 44% moved from this county. Out of people who lived in different houses, 35% moved from different county within same state. Out of people who lived in different houses, 23% moved from different state.
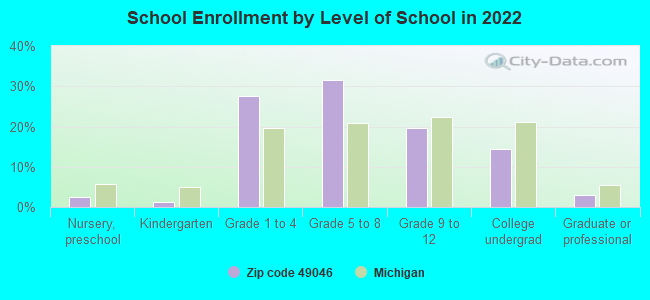
Private vs. public school enrollment:
Students in private schools in grades 1 to 8 (elementary and middle school): 92
Here:
13.4%
Michigan:
12.4%
Students in private schools in grades 9 to 12 (high school): 47
Here:
20.6%
Michigan:
9.8%
Students in private undergraduate colleges: 47
Here:
28.0%
Michigan:
14.9%
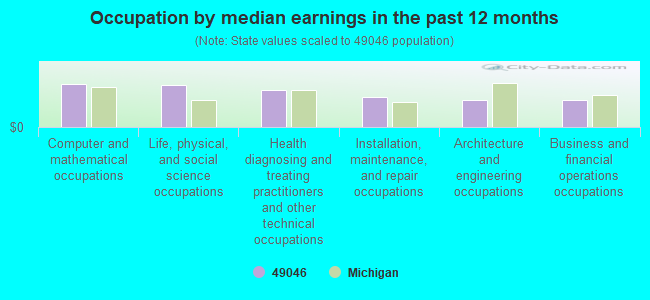
Occupation by median earnings in the past 12 months ($)
97,680Computer and mathematical occupations
96,100Life, physical, and social science occupations
85,269Health diagnosing and treating practitioners and other technical occupations
69,634Installation, maintenance, and repair occupations
62,002Architecture and engineering occupations
60,896Business and financial operations occupations
Companies with federal contracts located in this zip code:
KELTECH INC (729 S GROVE ST in DELTON, MI; small business)
$3,176 with Navy for Space and Water Heating Equipment. Signed on 2005-05-09. Completion date: 2005-06-09.
Top industries in this zip code by the number of employees in 2005:
Accommodation and Food Services: Limited-Service Restaurants (20-49 employees: 2 establishments)
Other Services (except Public Administration): Commercial and Industrial Machinery and Equipment (except Automotive and Electronic) Repair and Maintenance (20-49: 1, 5-9: 1, 1-4: 1)
Management of Companies and Enterprises: Offices of Other Holding Companies (20-49: 1)
Construction: Commercial and Institutional Building Construction (10-19: 1, 5-9: 1, 1-4: 1)
Other Services (except Public Administration): Religious Organizations (10-19: 1, 5-9: 1, 1-4: 1)
Accommodation and Food Services: Full-Service Restaurants (10-19: 1, 1-4: 1)
Finance and Insurance: Insurance Agencies and Brokerages (10-19: 1)
2002 - 2018 National Fire Incident Reporting System (NFIRS) incidents
According to the data from the years 2002 - 2018 the average number of fire incidents per year is 43. The highest number of fire incidents - 84 took place in 2018, and the least - 17 in 2002. The data has an increasing trend.
When looking into fire subcategories, the most incidents belonged to: Structure Fires (52.6%), and Outside Fires (34.9%).
Fire incident types reported to NFIRS in Zip Code 49046


 Nearest zip codes: 49060, 49083, 49050, 49012, 49058, 49080.


 According to the data from the years 2002 - 2018 the average number of fire incidents per year is 43. The highest number of fire incidents - 84 took place in 2018, and the least - 17 in 2002. The data has an increasing trend.
 When looking into fire subcategories, the most incidents belonged to: Structure Fires (52.6%), and Outside Fires (34.9%).