Estimated zip code population in 2022: 15,479 Zip code population in 2010: 15,802 Zip code population in 2000: 14,277
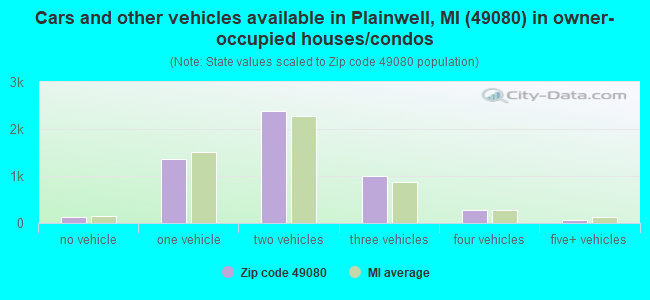
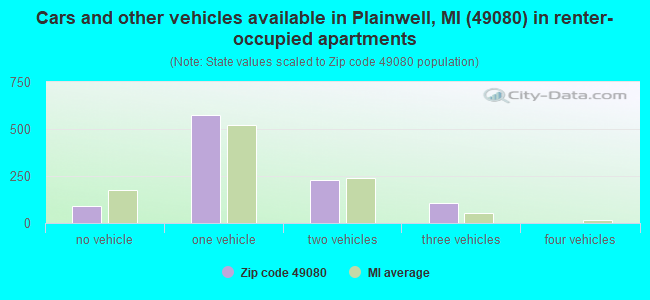
Houses and condos: 6,718 Renter-occupied apartments: 1,003
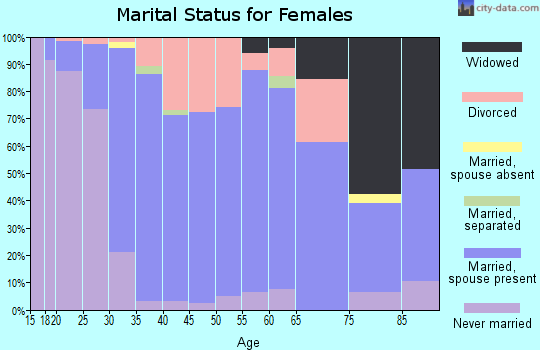
% of renters here:
16%
State:
27%
March 2022 cost of living index in zip code 49080: 81.8 (low, U.S. average is 100)
Land area: 77.9 sq. mi. Water area: 2.3 sq. mi.
Population density: 199 people per square mile
(very low).
OSM Map
General Map
Google Map
MSN Map
OSM Map
General Map
Google Map
MSN Map
OSM Map
General Map
Google Map
MSN Map
OSM Map
General Map
Google Map
MSN Map
Please wait while loading the map...
Real estate property taxes paid for housing units in 2022:
This zip code:
1.1% ($2,635)
Michigan:
1.2% ($2,746)
Median real estate property taxes paid for housing units with mortgages in 2022: $2,662 (1.1%) Median real estate property taxes paid for housing units with no mortgage in 2022: $2,618 (1.2%)
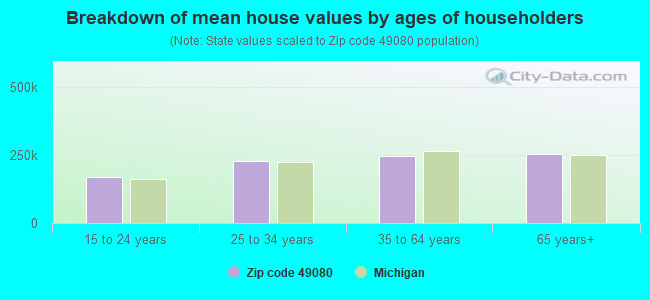
Estimated median house/condo value in 2022: $233,327
49080:
$233,327
Michigan:
$224,400
According to our research of Michigan and other state lists, there were 55 registered sex offenders living in 49080 zip code as of April 26, 2024. The ratio of all residents to sex offenders in zip code 49080 is 300 to 1. The ratio of registered sex offenders to all residents in this zip code is near the state average.
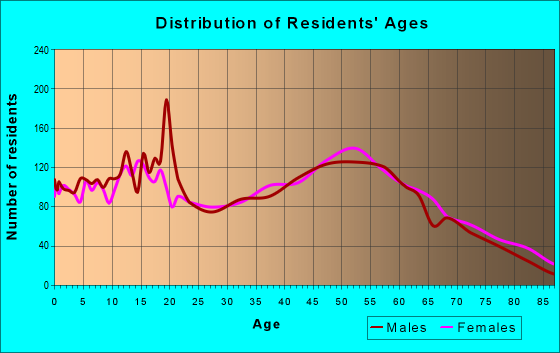
Median resident age:
This zip code:
43.8 years
Michigan median age:
40.3 years
Average household size:
This zip code:
2.4 people
Michigan:
2.4 people
Averages for the 2020 tax year for zip code 49080, filed in 2021:
Average Adjusted Gross Income (AGI) in 2020: $65,709 (Individual Income Tax Returns)
Here:
$65,709
State:
$68,945
Salary/wage: $54,920 (reported on 78.3% of returns)
Here:
$54,920
State:
$57,142
(% of AGI for various income ranges: 1026.2% for AGIs below $25k, 3257.1% for AGIs $25k-50k, 5943.1% for AGIs $50k-75k, 8967.7% for AGIs $75k-100k, 15939.2% for AGIs $100k-200k, 63697.5% for AGIs over 200k)
Taxable interest for individuals: $903 (reported on 34.5% of returns)
This zip code:
$903
Michigan:
$1,630
(% of AGI for various income ranges: 17.6% for AGIs below $25k, 14.9% for AGIs $25k-50k, 36.7% for AGIs $50k-75k, 46.0% for AGIs $75k-100k, 84.9% for AGIs $100k-200k, 886.3% for AGIs over 200k)
Ordinary dividends: $4,162 (reported on 18.8% of returns)
Here:
$4,162
State:
$6,972
(% of AGI for various income ranges: 25.4% for AGIs below $25k, 43.0% for AGIs $25k-50k, 80.0% for AGIs $50k-75k, 152.6% for AGIs $75k-100k, 243.1% for AGIs $100k-200k, 2096.2% for AGIs over 200k)
Net capital gain/loss in AGI: +$8,791 (reported on 16.6% of returns)
Here:
+$8,791
State:
+$20,064
(% of AGI for various income ranges: 11.3% for AGIs below $25k, 40.9% for AGIs $25k-50k, 53.3% for AGIs $50k-75k, 153.7% for AGIs $75k-100k, 452.7% for AGIs $100k-200k, 7376.2% for AGIs over 200k)
Profit/loss from business: +$11,445 (reported on 12.9% of returns)
Here:
+$11,445
State:
+$11,172
(% of AGI for various income ranges: 85.7% for AGIs below $25k, 123.3% for AGIs $25k-50k, 163.3% for AGIs $50k-75k, 300.2% for AGIs $75k-100k, 486.9% for AGIs $100k-200k, 1956.2% for AGIs over 200k)
Taxable individual retirement arrangement distribution: $19,130 (reported on 12.7% of returns)
49080:
$19,130
Michigan:
$19,803
(% of AGI for various income ranges: 99.5% for AGIs below $25k, 178.3% for AGIs $25k-50k, 280.1% for AGIs $50k-75k, 487.9% for AGIs $75k-100k, 935.2% for AGIs $100k-200k, 3198.8% for AGIs over 200k)
Self-employed (Keogh) retirement plans: $15,800 (reported on 0.4% of returns)
49080:
$15,800
Michigan:
$25,132
(% of AGI for various income ranges: 66.8% for AGIs $100k-200k)
Total itemized deductions: $37,738 (reported on 4.1% of returns)
Here:
$37,738
State:
$34,117
(% of AGI for various income ranges: 37.0% for AGIs below $25k, 50.8% for AGIs $25k-50k, 107.4% for AGIs $50k-75k, 184.7% for AGIs $75k-100k, 463.5% for AGIs $100k-200k, 6775.0% for AGIs over 200k)
Charity contributions: $16,383 (reported on 3.1% of returns)
Here:
$16,383
State:
$13,548
(% of AGI for various income ranges: 10.3% for AGIs $25k-50k, 15.6% for AGIs $50k-75k, 22.1% for AGIs $75k-100k, 140.1% for AGIs $100k-200k, 3155.0% for AGIs over 200k)
Taxes paid: $7,512 (reported on 4.1% of returns)
49080:
$7,512
State:
$7,972
(% of AGI for various income ranges: 6.0% for AGIs below $25k, 13.1% for AGIs $25k-50k, 30.0% for AGIs $50k-75k, 50.9% for AGIs $75k-100k, 126.5% for AGIs $100k-200k, 826.2% for AGIs over 200k)
Earned income credit: $2,082 (reported on 12.9% of returns)
Here:
$2,082
State:
$2,251
(% of AGI for various income ranges: 66.6% for AGIs below $25k, 61.3% for AGIs $25k-50k, 2.0% for AGIs $50k-75k)
Percentage of individuals using paid preparers for their 2020 taxes: 95.5%
Here:
95%
State:
93%
(% for various income ranges: 94.9% for AGIs below $25k, 95.7% for AGIs $25k-50k, 95.6% for AGIs $50k-75k, 96.3% for AGIs $75k-100k, 94.7% for AGIs $100k-200k, 100.0% for AGIs over 200k)
Averages for the 2012 tax year for zip code 49080, filed in 2013:
Average Adjusted Gross Income (AGI) in 2012: $53,358 (Individual Income Tax Returns)
Here:
$53,358
State:
$55,609
Salary/wage: $45,850 (reported on 81.8% of returns)
Here:
$45,850
State:
$46,782
(% of AGI for various income ranges: 67.7% for AGIs below $25k, 74.8% for AGIs $25k-50k, 78.1% for AGIs $50k-75k, 76.9% for AGIs $75k-100k, 78.8% for AGIs $100k-200k, 41.2% for AGIs over 200k)
Taxable interest for individuals: $1,002 (reported on 33.8% of returns)
This zip code:
$1,002
Michigan:
$1,491
(% of AGI for various income ranges: 1.2% for AGIs below $25k, 0.6% for AGIs $25k-50k, 0.6% for AGIs $50k-75k, 0.6% for AGIs $75k-100k, 0.6% for AGIs $100k-200k, 0.4% for AGIs over 200k)
Ordinary dividends: $2,973 (reported on 19.2% of returns)
Here:
$2,973
State:
$6,225
(% of AGI for various income ranges: 1.5% for AGIs below $25k, 0.8% for AGIs $25k-50k, 1.0% for AGIs $50k-75k, 0.8% for AGIs $75k-100k, 0.9% for AGIs $100k-200k, 1.7% for AGIs over 200k)
Net capital gain/loss in AGI: +$9,787 (reported on 15.1% of returns)
Here:
+$9,787
State:
+$9,326
(% of AGI for various income ranges: 0.4% for AGIs $25k-50k, 0.4% for AGIs $50k-75k, 1.0% for AGIs $75k-100k, 1.2% for AGIs $100k-200k, 12.5% for AGIs over 200k)
Profit/loss from business: +$8,895 (reported on 14.6% of returns)
Here:
+$8,895
State:
+$11,523
(% of AGI for various income ranges: 6.1% for AGIs below $25k, 2.8% for AGIs $25k-50k, 2.6% for AGIs $50k-75k, 1.8% for AGIs $75k-100k, 2.2% for AGIs $100k-200k, 1.1% for AGIs over 200k)
Taxable individual retirement arrangement distribution: $14,572 (reported on 13.4% of returns)
49080:
$14,572
Michigan:
$15,298
(% of AGI for various income ranges: 5.5% for AGIs below $25k, 4.4% for AGIs $25k-50k, 3.6% for AGIs $50k-75k, 4.4% for AGIs $75k-100k, 3.5% for AGIs $100k-200k, 1.8% for AGIs over 200k)
Self-employment retirement plans: $18,733 (reported on 0.4% of returns)
49080:
$18,733
Michigan:
$20,834
Total itemized deductions: $18,382 (18% of AGI, reported on 29.0% of returns)
Here:
$18,382
State:
$21,628
Here:
17.5% of AGI
State:
18.4% of AGI
(% of AGI for various income ranges: 8.7% for AGIs below $25k, 8.4% for AGIs $25k-50k, 10.0% for AGIs $50k-75k, 10.4% for AGIs $75k-100k, 12.6% for AGIs $100k-200k, 7.9% for AGIs over 200k)
Charity contributions: $3,282 (reported on 22.9% of returns)
Here:
$3,282
State:
$4,225
(% of AGI for various income ranges: 0.7% for AGIs below $25k, 1.0% for AGIs $25k-50k, 1.2% for AGIs $50k-75k, 1.3% for AGIs $75k-100k, 2.0% for AGIs $100k-200k, 1.5% for AGIs over 200k)
Taxes paid: $6,807 (reported on 29.0% of returns)
49080:
$6,807
State:
$8,327
(% of AGI for various income ranges: 1.6% for AGIs below $25k, 2.2% for AGIs $25k-50k, 3.0% for AGIs $50k-75k, 3.6% for AGIs $75k-100k, 5.2% for AGIs $100k-200k, 4.7% for AGIs over 200k)
Earned income credit: $2,079 (reported on 15.3% of returns)
Here:
$2,079
State:
$2,306
(% of AGI for various income ranges: 5.0% for AGIs below $25k, 1.2% for AGIs $25k-50k)
Percentage of individuals using paid preparers for their 2012 taxes: 60.2%
Here:
60%
State:
57%
(% for various income ranges: 56.7% for AGIs below $25k, 61.5% for AGIs $25k-50k, 62.5% for AGIs $50k-75k, 63.4% for AGIs $75k-100k, 62.7% for AGIs $100k-200k, 71.4% for AGIs over 200k)
Averages for the 2004 tax year for zip code 49080, filed in 2005:
Average Adjusted Gross Income (AGI) in 2004: $44,511 (Individual Income Tax Returns)
Here:
$44,511
State:
$48,204
Salary/wage: $41,912 (reported on 85.1% of returns)
Here:
$41,912
State:
$42,791
(% of AGI for various income ranges: 108.6% for AGIs below $10k, 72.5% for AGIs $10k-25k, 81.7% for AGIs $25k-50k, 84.0% for AGIs $50k-75k, 85.3% for AGIs $75k-100k, 73.9% for AGIs over 100k)
Taxable interest for individuals: $983 (reported on 48.5% of returns)
This zip code:
$983
Michigan:
$1,725
(% of AGI for various income ranges: 5.0% for AGIs below $10k, 2.3% for AGIs $10k-25k, 1.1% for AGIs $25k-50k, 0.9% for AGIs $50k-75k, 0.7% for AGIs $75k-100k, 0.9% for AGIs over 100k)
Taxable dividends: $1,613 (reported on 25.0% of returns)
Here:
$1,613
State:
$3,420
(% of AGI for various income ranges: 3.8% for AGIs below $10k, 1.2% for AGIs $10k-25k, 0.8% for AGIs $25k-50k, 0.8% for AGIs $50k-75k, 0.5% for AGIs $75k-100k, 1.1% for AGIs over 100k)
Net capital gain/loss: +$5,293 (reported on 18.9% of returns)
Here:
+$5,293
State:
+$8,532
(% of AGI for various income ranges: -1.4% for AGIs below $10k, 0.6% for AGIs $10k-25k, 0.8% for AGIs $25k-50k, 1.0% for AGIs $50k-75k, 1.4% for AGIs $75k-100k, 5.3% for AGIs over 100k)
Profit/loss from business: +$8,148 (reported on 15.2% of returns)
Here:
+$8,148
State:
+$9,547
(% of AGI for various income ranges: 8.8% for AGIs below $10k, 5.0% for AGIs $10k-25k, 2.9% for AGIs $25k-50k, 2.3% for AGIs $50k-75k, 2.3% for AGIs $75k-100k, 2.5% for AGIs over 100k)
IRA payment deduction: $2,537 (reported on 2.3% of returns)
49080:
$2,537
Michigan:
$2,875
(% of AGI for various income ranges: 0.2% for AGIs $10k-25k, 0.2% for AGIs $25k-50k, 0.1% for AGIs $50k-75k, 0.1% for AGIs $75k-100k, 0.1% for AGIs over 100k)
Self-employed pension: $9,568 (reported on 0.6% of returns)
Here:
$9,568
Michigan:
$13,826
Total itemized deductions: $15,568 (20% of AGI, reported on 36.3% of returns)
Here:
$15,568
State:
$18,509
Here:
20.2% of AGI
State:
20.7% of AGI
(% of AGI for various income ranges: 12.7% for AGIs below $10k, 10.8% for AGIs $10k-25k, 11.5% for AGIs $25k-50k, 13.8% for AGIs $50k-75k, 13.9% for AGIs $75k-100k, 12.5% for AGIs over 100k)
Charity contributions deductions: $2,482 (3% of AGI, reported on 29.9% of returns)
Here:
$2,482
State:
$3,365
Here:
3.0% of AGI
State:
3.6% of AGI
(% of AGI for various income ranges: 0.5% for AGIs below $10k, 1.0% for AGIs $10k-25k, 1.2% for AGIs $25k-50k, 1.7% for AGIs $50k-75k, 1.8% for AGIs $75k-100k, 2.1% for AGIs over 100k)
Total tax: $6,163 (reported on 76.4% of returns)
49080:
$6,163
State:
$7,691
(% of AGI for various income ranges: 3.1% for AGIs below $10k, 4.3% for AGIs $10k-25k, 6.9% for AGIs $25k-50k, 8.4% for AGIs $50k-75k, 10.3% for AGIs $75k-100k, 17.0% for AGIs over 100k)
Earned income credit: $1,710 (reported on 11.8% of returns)
Here:
$1,710
State:
$1,737
Percentage of individuals using paid preparers for their 2004 taxes: 60.7%
Here:
61%
State:
60%
(% for various income ranges: 51.5% for AGIs below $10k, 61.7% for AGIs $10k-25k, 63.1% for AGIs $25k-50k, 64.5% for AGIs $50k-75k, 59.8% for AGIs $75k-100k, 67.4% for AGIs over 100k)
Household received Food Stamps/SNAP in the past 12 months: 637 Household did not receive Food Stamps/SNAP in the past 12 months: 5,557
Women who had a birth in the past 12 months: 139 (117 now married, 23 unmarried) Women who did not have a birth in the past 12 months: 2,868 (1,497 now married, 1,362 unmarried)
Housing units in zip code 49080 with a mortgage: 2,984 (417 second mortgage, 371 both second mortgage and home equity loan) Houses without a mortgage: 43
Median monthly owner costs for units with a mortgage: $1,367 Median monthly owner costs for units without a mortgage: $482
Residents with income below the poverty level in 2022:
This zip code:
10.6%
Whole state:
13.4%
Residents with income below 50% of the poverty level in 2022:
This zip code:
6.8%
Whole state:
6.9%
Median number of rooms in houses and condos:
Here:
6.4
State:
6.5
Median number of rooms in apartments:
Here:
4.7
State:
4.3
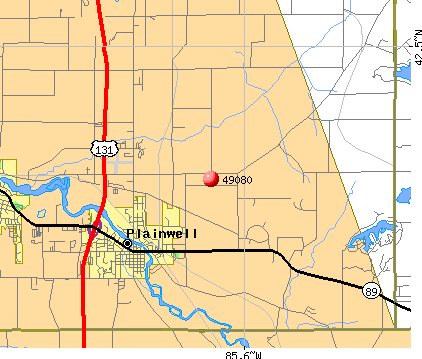
Notable locations in this zip code not listed on our city pages
Notable locations in zip code 49080: Lake Doster Golf Club (A), Camp Merrie Wood (B), Silver Creek (C), Plainwell Station (D), Plainwell Public Safety Department Fire Station (E), Gun Plain Charter Township Fire Department (F), Michigan Department of Natural Resources Plainwell Area (G), Prairieville Township - Pine Lake Fire Department (H), Plainwell Pines Nursing Center (I), Plainwell City Hall (J), Ransom District Library (K), Plainwell City Police Department (L). Display/hide their locations on the map
Churches in zip code 49080 include: Doster Church (A), Orangeville Baptist Church (B), Saint Stephen's Episcopal Church (C), Plainwell Assembly of God Church (D), First United Methodist Church (E), First Baptist Church (F), First Presbyterian Church (G), Church of Christ (H), Canaanland Church of God (I). Display/hide their locations on the map
Cemeteries: Brown Cemetery (1), Lindsey Cemetery (2), Ives Cemetery (3), Cressey Cemetery (4), Hillside Cemetery (5), Saint Margaret Cemetery (6), Oak Hill Cemetery (7). Display/hide their locations on the map
Lakes: Pine Lake (A), Warner Lake (B), West Gilkey Lake (C), Miller Lake (D), Lake Doster (E), Cook Lake (F), Silver Lake (G). Display/hide their locations on the map
In group quarters: 409 (-1 institutionalized population)
Size of family households: 2,115 2-persons, 959 3-persons, 872 4-persons, 255 5-persons, 151 6-persons, 13 7-or-more-persons
Size of nonfamily households: 1,551 1-person, 272 2-persons
2,316 married couples with children.
604 single-parent households (157 men, 447 women).
95.5% of residents of 49080 zip code speak English at home.
2.3% of residents speak Spanish at home (85% very well, 13% well, 2% not well).
0.5% of residents speak other Indo-European language at home (78% very well, 22% well).
0.1% of residents speak Asian or Pacific Island language at home (100% very well).
1.4% of residents speak other language at home (100% very well).
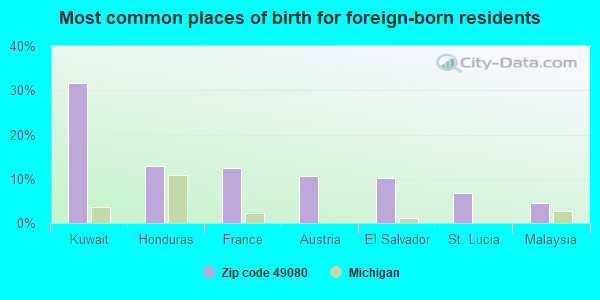
Foreign born population: 176 (1.1%) (50.4% of them are naturalized citizens)
This zip code:
1.1%
Whole state:
6.9%
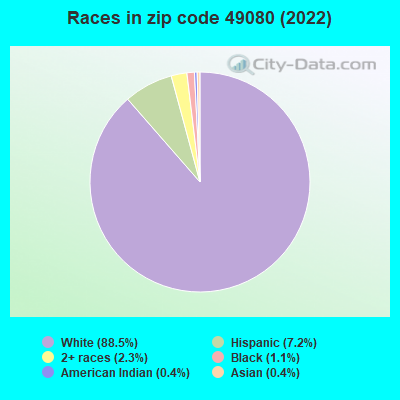
32%Kuwait
13%Honduras
12%France
11%Austria
10%El Salvador
7%St. Lucia
5%Malaysia
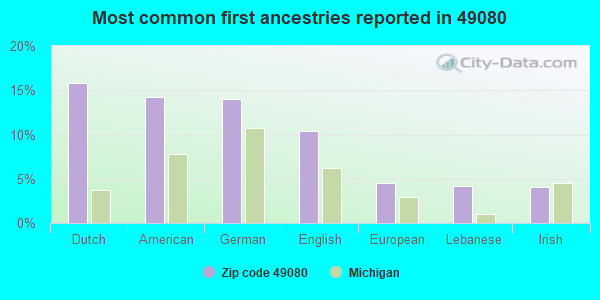
16%Dutch
14%American
14%German
10%English
5%European
4%Lebanese
4%Irish
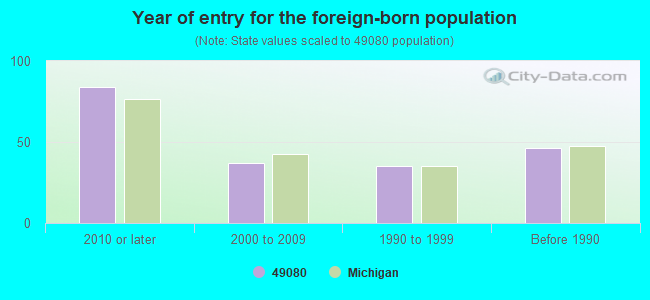
Year of entry for the foreign-born population
842010 or later
372000 to 2009
351990 to 1999
46Before 1990
Major facilities with environmental interests located in this zip code:
DRUG & LABORATORY DISPOSAL (331 BROAD ST in PLAINWELL, MI)
AIR MINOR (AIRS/AFS) (Integrated Compliance Information System) - ICIS-05-1996-0175, FORMAL ENFORCEMENT ACTION COMPLIANCE ACTIVITY (Tracking inspections of insecticide, fungicide, and rodenticide, and toxic substances) STATE MASTER (New Jersey environmental info) - NJEMS-MID092947928, TRANSPORTER HAZARDOUS WASTE BIENNIAL REPORTER (Resource Conservation and Recovery Act (tracking hazardous waste)) Large Quantity Generators, more that 1000 kg of hazardous waste/month (Resource Conservation and Recovery Act (tracking hazardous waste)) TRANSPORTER (Resource Conservation and Recovery Act (tracking hazardous waste)) TSD (Resource Conservation and Recovery Act (tracking hazardous waste)) TRI REPORTER (Tracking of toxic chemicals releasing facilities) Business SIC classification: REFUSE SYSTEMS Organizations: WARD T. WALTER (CONTACT/OPERATOR)
Alternative names: DRUG AND LABORATORY DISPO
MI DEPT/NATURAL RESOURCES (621 10TH STREET in PLAINWELL, MI)
(Resource Conservation and Recovery Act (tracking hazardous waste)) Alternative names: MI DEPT/DNR
A 1 DISPOSAL CORPORATION (400 BROAD ST in PLAINWELL, MI)
(Integrated Compliance Information System) - ICIS-05-1986-0259, FORMAL ENFORCEMENT ACTION, ICIS-05-1985-0542, (Resource Conservation and Recovery Act (tracking hazardous waste)) Business SIC classification: SERVICE INDUSTRY MACHINERY; TRANSPORTATION SERVICES; REFUSE SYSTEMS
GILKEY ELEMENTARY SCHOOL (707 S. WOODHAMS STREET in PLAINWELL, MI)
(National Center for Education Statistics) - STATE ID-01403 Organizations: PLAINWELL COMMUNITY SCHOOLS (SCHOOL DISTRICT)
METAL COMPONENTS INC FLEXIBLE FURNITURE DIV (323 ACORN STREET in PLAINWELL, MI)
AIR SYNTHETIC MINOR (AIRS/AFS) CRITERIA AND HAZARDOUS AIR POLLUTANT INVENTORY (Inventory of air pollution sources) Conditionally Exempt Small Quantity Generators, less than 100 kg/month of hazardous waste (Resource Conservation and Recovery Act (tracking hazardous waste)) TRI REPORTER (Tracking of toxic chemicals releasing facilities) Business SIC classification: FABRICATED METAL PRODUCTS; NONCLASSIFIABLE ESTABLISHMENTS Business NAICS classification: POWDER METALLURGY PART MANUFACTURING. Organizations: MCFLEX (CONTACT/OWNER)
Alternative names: FLEXIBLE FURNITURE DIVISION, METAL COMPONENTS INC FLEX FURNITURE DIV
MI DEPT/NATURAL RESOURCES (PO BOX 355 in PLAINWELL, MI)
(Resource Conservation and Recovery Act (tracking hazardous waste)) Alternative names: MI DEPT/DNR
ADMIRAL PETROLEUM CO (1149 M-89 in PLAINWELL, MI)
(Resource Conservation and Recovery Act (tracking hazardous waste)) Organizations: MARATHON OIL CO (CONTACT/OWNER)
Alternative names: SPEEDWAY 2370
MI DEPT/TRANSPORTATION BRIDGE B01-03024 (M89 OVER KALAMAZOO RIVER in PLAINWELL, MI)
(Resource Conservation and Recovery Act (tracking hazardous waste)) Organizations: MICH DEPT OF TRANSPORTATION (CONTACT/OPERATOR)
MI DEPT/TRANSPORTATION BRIDGE R01-03111 (US-131 OVER CONRAIL in PLAINWELL, MI)
(Resource Conservation and Recovery Act (tracking hazardous waste)) Organizations: MICH DEPT OF TRANSPORTATION (CONTACT/OPERATOR)
Alternative names: MIDOT BRIDGE US-131 OVER CONRAIL
DEYOUNG HOG FARM LLC (381 114TH AVE in PLAINWELL, MI)
National Pollutant Discharge Elimination System NON-MAJOR (Tracking pollutant discharge elimination systems) - permit Business SIC classification: HOGS Alternative names: DEYOUNG HOG FARM-PLAINWEL-CAFO
ALLEN TESTPRODUCTS (790 E BRIDGE ST in PLAINWELL, MI)
(Resource Conservation and Recovery Act (tracking hazardous waste))
BELLE TIRE DISTRIBUTORS INC (1250 M-89 in PLAINWELL, MI)
Small Quantity Generators, between 100 kg and 1000 kg of hazardous waste/month (Resource Conservation and Recovery Act (tracking hazardous waste)) Organizations: DON BARNES (CONTACT/OWNER)
MI DEPT/ENVIRONMENTAL QUALITY (734 JERSEY ST in PLAINWELL, MI)
(Resource Conservation and Recovery Act (tracking hazardous waste)) Alternative names: ANO-KAL CO INC
Housing units lacking complete plumbing facilities: 1.2% Housing units lacking complete kitchen facilities: 0.7%
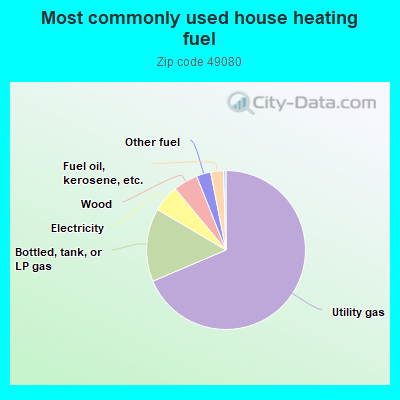
68.6%Utility gas
14.9%Bottled, tank, or LP gas
5.5%Electricity
5.0%Wood
2.9%Other fuel
2.6%Fuel oil, kerosene, etc.
Population in 1990: 15,308.
Place of birth for U.S.-born residents:
This state: 12,909
Northeast: 441
Midwest: 928
South: 755
West: 235
61% of the 49080 zip code residents lived in the same house 5 years ago. Out of people who lived in different houses, 51% lived in this county. Out of people who lived in different counties, 50% lived in Michigan.
93% of the 49080 zip code residents lived in the same house 1 year ago. Out of people who lived in different houses, 35% moved from this county. Out of people who lived in different houses, 35% moved from different county within same state. Out of people who lived in different houses, 20% moved from different state. Out of people who lived in different houses, 13% moved from abroad.
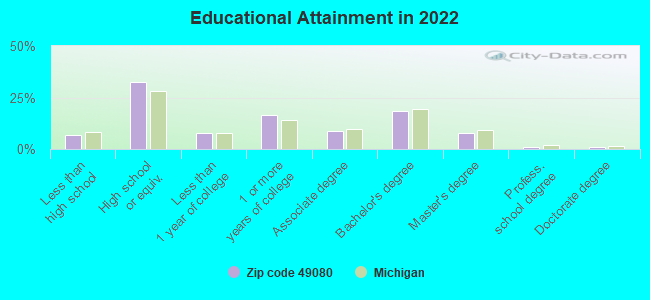
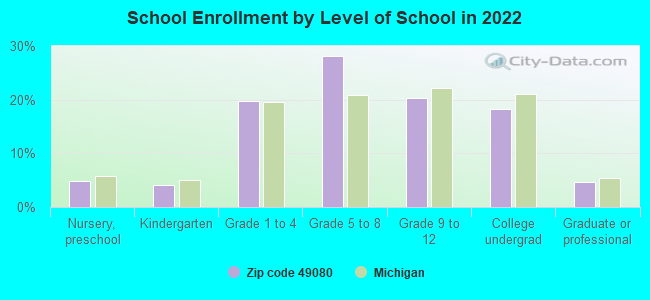
Private vs. public school enrollment:
Students in private schools in grades 1 to 8 (elementary and middle school): 133
Here:
8.2%
Michigan:
12.4%
Students in private schools in grades 9 to 12 (high school): 7
Here:
1.1%
Michigan:
9.8%
Students in private undergraduate colleges: 57
Here:
9.2%
Michigan:
14.9%
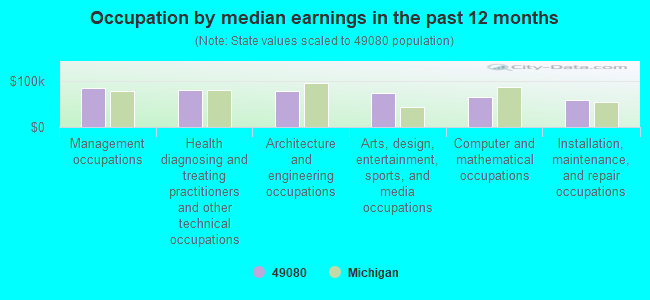
Occupation by median earnings in the past 12 months ($)
86,431Management occupations
80,271Health diagnosing and treating practitioners and other technical occupations
79,131Architecture and engineering occupations
75,103Arts, design, entertainment, sports, and media occupations
64,647Computer and mathematical occupations
58,139Installation, maintenance, and repair occupations
Top industries in this zip code by the number of employees in 2005:
2002 - 2018 National Fire Incident Reporting System (NFIRS) incidents
Based on the data from the years 2002 - 2018 the average number of fire incidents per year is 46. The highest number of fire incidents - 70 took place in 2012, and the least - 16 in 2008. The data has a rising trend.
When looking into fire subcategories, the most incidents belonged to: Structure Fires (53.2%), and Outside Fires (27.7%).
Fire incident types reported to NFIRS in Zip Code 49080


 Nearest zip codes: 49070, 49004, 49344, 49078, 49074, 49083.


 Based on the data from the years 2002 - 2018 the average number of fire incidents per year is 46. The highest number of fire incidents - 70 took place in 2012, and the least - 16 in 2008. The data has a rising trend.
 When looking into fire subcategories, the most incidents belonged to: Structure Fires (53.2%), and Outside Fires (27.7%).