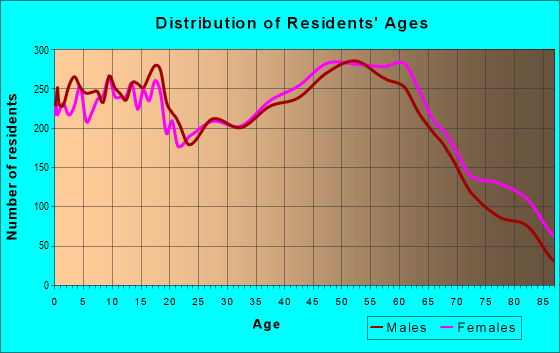
Estimated zip code population in 2022: 36,704 Zip code population in 2010: 37,122 Zip code population in 2000: 35,356
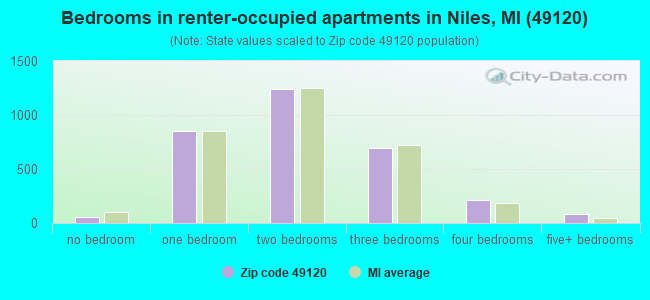
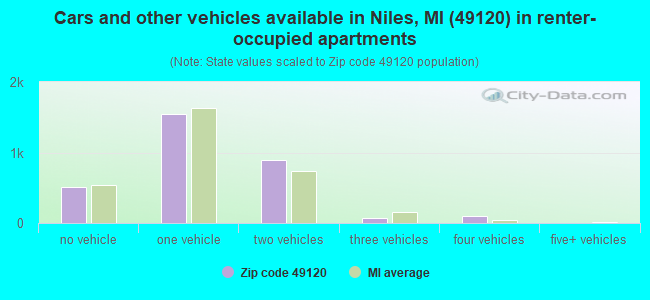
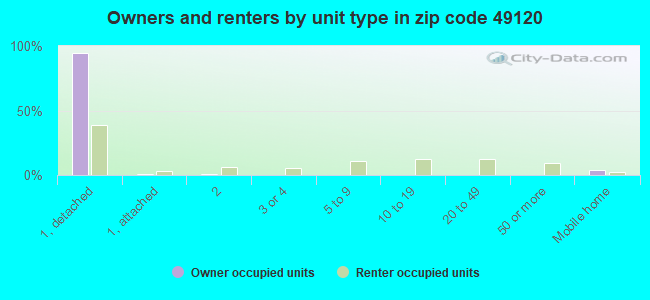
Houses and condos: 15,869 Renter-occupied apartments: 3,131
% of renters here:
21%
State:
27%
March 2022 cost of living index in zip code 49120: 81.6 (low, U.S. average is 100)
Land area: 117.4 sq. mi. Water area: 2.5 sq. mi.
Population density: 313 people per square mile
(very low).
OSM Map
General Map
Google Map
MSN Map
OSM Map
General Map
Google Map
MSN Map
OSM Map
General Map
Google Map
MSN Map
OSM Map
General Map
Google Map
MSN Map
Please wait while loading the map...
Real estate property taxes paid for housing units in 2022:
This zip code:
1.0% ($1,696)
Michigan:
1.2% ($2,746)
Median real estate property taxes paid for housing units with mortgages in 2022: $1,788 (1.0%) Median real estate property taxes paid for housing units with no mortgage in 2022: $1,501 (1.0%)
Averages for the 2020 tax year for zip code 49120, filed in 2021:
Average Adjusted Gross Income (AGI) in 2020: $58,221 (Individual Income Tax Returns)
Here:
$58,221
State:
$68,945
Salary/wage: $49,212 (reported on 80.8% of returns)
Here:
$49,212
State:
$57,142
(% of AGI for various income ranges: 1059.0% for AGIs below $25k, 3321.5% for AGIs $25k-50k, 6199.7% for AGIs $50k-75k, 8982.0% for AGIs $75k-100k, 16959.7% for AGIs $100k-200k, 72639.3% for AGIs over 200k)
Taxable interest for individuals: $1,593 (reported on 25.2% of returns)
This zip code:
$1,593
Michigan:
$1,630
(% of AGI for various income ranges: 16.3% for AGIs below $25k, 15.6% for AGIs $25k-50k, 34.2% for AGIs $50k-75k, 50.9% for AGIs $75k-100k, 136.9% for AGIs $100k-200k, 1950.0% for AGIs over 200k)
Ordinary dividends: $5,217 (reported on 14.2% of returns)
Here:
$5,217
State:
$6,972
(% of AGI for various income ranges: 19.8% for AGIs below $25k, 25.6% for AGIs $25k-50k, 57.5% for AGIs $50k-75k, 104.3% for AGIs $75k-100k, 369.4% for AGIs $100k-200k, 3125.3% for AGIs over 200k)
Net capital gain/loss in AGI: +$13,216 (reported on 12.9% of returns)
Here:
+$13,216
State:
+$20,064
(% of AGI for various income ranges: 9.1% for AGIs below $25k, 22.8% for AGIs $25k-50k, 60.3% for AGIs $50k-75k, 113.5% for AGIs $75k-100k, 552.4% for AGIs $100k-200k, 13328.7% for AGIs over 200k)
Profit/loss from business: +$14,238 (reported on 11.4% of returns)
Here:
+$14,238
State:
+$11,172
(% of AGI for various income ranges: 72.5% for AGIs below $25k, 106.5% for AGIs $25k-50k, 165.6% for AGIs $50k-75k, 350.2% for AGIs $75k-100k, 661.0% for AGIs $100k-200k, 4350.7% for AGIs over 200k)
Taxable individual retirement arrangement distribution: $16,235 (reported on 10.8% of returns)
49120:
$16,235
Michigan:
$19,803
(% of AGI for various income ranges: 83.7% for AGIs below $25k, 109.9% for AGIs $25k-50k, 218.9% for AGIs $50k-75k, 333.5% for AGIs $75k-100k, 1017.8% for AGIs $100k-200k, 2256.0% for AGIs over 200k)
Self-employed (Keogh) retirement plans: $29,020 (reported on 0.3% of returns)
49120:
$29,020
Michigan:
$25,132
(% of AGI for various income ranges: 60.6% for AGIs $100k-200k, 531.3% for AGIs over 200k)
Total itemized deductions: $37,873 (reported on 4.1% of returns)
Here:
$37,873
State:
$34,117
(% of AGI for various income ranges: 24.9% for AGIs below $25k, 54.0% for AGIs $25k-50k, 138.8% for AGIs $50k-75k, 181.4% for AGIs $75k-100k, 641.1% for AGIs $100k-200k, 7965.3% for AGIs over 200k)
Charity contributions: $13,515 (reported on 3.5% of returns)
Here:
$13,515
State:
$13,548
(% of AGI for various income ranges: 2.0% for AGIs below $25k, 7.8% for AGIs $25k-50k, 22.0% for AGIs $50k-75k, 43.2% for AGIs $75k-100k, 196.5% for AGIs $100k-200k, 3204.0% for AGIs over 200k)
Taxes paid: $7,735 (reported on 4.1% of returns)
49120:
$7,735
State:
$7,972
(% of AGI for various income ranges: 2.9% for AGIs below $25k, 7.6% for AGIs $25k-50k, 27.9% for AGIs $50k-75k, 40.1% for AGIs $75k-100k, 170.4% for AGIs $100k-200k, 1480.7% for AGIs over 200k)
Earned income credit: $2,268 (reported on 16.6% of returns)
Here:
$2,268
State:
$2,251
(% of AGI for various income ranges: 87.7% for AGIs below $25k, 66.6% for AGIs $25k-50k, 1.0% for AGIs $50k-75k)
Percentage of individuals using paid preparers for their 2020 taxes: 93.5%
Here:
93%
State:
93%
(% for various income ranges: 92.7% for AGIs below $25k, 93.7% for AGIs $25k-50k, 93.8% for AGIs $50k-75k, 94.3% for AGIs $75k-100k, 93.6% for AGIs $100k-200k, 95.7% for AGIs over 200k)
Averages for the 2012 tax year for zip code 49120, filed in 2013:
Average Adjusted Gross Income (AGI) in 2012: $47,356 (Individual Income Tax Returns)
Here:
$47,356
State:
$55,609
Salary/wage: $40,238 (reported on 82.9% of returns)
Here:
$40,238
State:
$46,782
(% of AGI for various income ranges: 71.0% for AGIs below $25k, 79.3% for AGIs $25k-50k, 79.2% for AGIs $50k-75k, 77.9% for AGIs $75k-100k, 75.7% for AGIs $100k-200k, 43.0% for AGIs over 200k)
Taxable interest for individuals: $1,130 (reported on 29.9% of returns)
This zip code:
$1,130
Michigan:
$1,491
(% of AGI for various income ranges: 1.3% for AGIs below $25k, 0.6% for AGIs $25k-50k, 0.5% for AGIs $50k-75k, 0.7% for AGIs $75k-100k, 0.6% for AGIs $100k-200k, 0.8% for AGIs over 200k)
Ordinary dividends: $4,542 (reported on 14.5% of returns)
Here:
$4,542
State:
$6,225
(% of AGI for various income ranges: 1.1% for AGIs below $25k, 0.7% for AGIs $25k-50k, 0.6% for AGIs $50k-75k, 1.0% for AGIs $75k-100k, 1.3% for AGIs $100k-200k, 3.3% for AGIs over 200k)
Net capital gain/loss in AGI: +$5,462 (reported on 11.5% of returns)
Here:
+$5,462
State:
+$9,326
(% of AGI for various income ranges: 0.1% for AGIs $25k-50k, 0.3% for AGIs $50k-75k, 0.5% for AGIs $75k-100k, 1.1% for AGIs $100k-200k, 5.1% for AGIs over 200k)
Profit/loss from business: +$12,230 (reported on 12.3% of returns)
Here:
+$12,230
State:
+$11,523
(% of AGI for various income ranges: 5.7% for AGIs below $25k, 2.1% for AGIs $25k-50k, 2.1% for AGIs $50k-75k, 1.6% for AGIs $75k-100k, 3.1% for AGIs $100k-200k, 4.9% for AGIs over 200k)
Taxable individual retirement arrangement distribution: $12,746 (reported on 11.4% of returns)
49120:
$12,746
Michigan:
$15,298
(% of AGI for various income ranges: 4.1% for AGIs below $25k, 2.8% for AGIs $25k-50k, 3.0% for AGIs $50k-75k, 3.2% for AGIs $75k-100k, 3.4% for AGIs $100k-200k, 2.3% for AGIs over 200k)
Self-employment retirement plans: $20,400 (reported on 0.4% of returns)
49120:
$20,400
Michigan:
$20,834
(% of AGI for various income ranges: 0.4% for AGIs $100k-200k, 0.6% for AGIs over 200k)
Total itemized deductions: $21,278 (20% of AGI, reported on 21.7% of returns)
Here:
$21,278
State:
$21,628
Here:
19.7% of AGI
State:
18.4% of AGI
(% of AGI for various income ranges: 6.5% for AGIs below $25k, 6.8% for AGIs $25k-50k, 8.5% for AGIs $50k-75k, 9.9% for AGIs $75k-100k, 12.8% for AGIs $100k-200k, 12.8% for AGIs over 200k)
Charity contributions: $4,822 (reported on 16.8% of returns)
Here:
$4,822
State:
$4,225
(% of AGI for various income ranges: 0.5% for AGIs below $25k, 0.9% for AGIs $25k-50k, 1.2% for AGIs $50k-75k, 1.7% for AGIs $75k-100k, 2.3% for AGIs $100k-200k, 3.1% for AGIs over 200k)
Taxes paid: $6,958 (reported on 21.7% of returns)
49120:
$6,958
State:
$8,327
(% of AGI for various income ranges: 0.9% for AGIs below $25k, 1.6% for AGIs $25k-50k, 2.4% for AGIs $50k-75k, 3.2% for AGIs $75k-100k, 4.9% for AGIs $100k-200k, 5.2% for AGIs over 200k)
Earned income credit: $2,257 (reported on 20.9% of returns)
Here:
$2,257
State:
$2,306
(% of AGI for various income ranges: 6.7% for AGIs below $25k, 1.2% for AGIs $25k-50k)
Percentage of individuals using paid preparers for their 2012 taxes: 52.4%
Here:
52%
State:
57%
(% for various income ranges: 48.0% for AGIs below $25k, 53.2% for AGIs $25k-50k, 56.1% for AGIs $50k-75k, 56.8% for AGIs $75k-100k, 58.9% for AGIs $100k-200k, 77.4% for AGIs over 200k)
Averages for the 2004 tax year for zip code 49120, filed in 2005:
Average Adjusted Gross Income (AGI) in 2004: $38,949 (Individual Income Tax Returns)
Here:
$38,949
State:
$48,204
Salary/wage: $35,633 (reported on 86.2% of returns)
Here:
$35,633
State:
$42,791
(% of AGI for various income ranges: 96.9% for AGIs below $10k, 77.1% for AGIs $10k-25k, 84.9% for AGIs $25k-50k, 85.6% for AGIs $50k-75k, 83.6% for AGIs $75k-100k, 63.0% for AGIs over 100k)
Taxable interest for individuals: $1,318 (reported on 39.9% of returns)
This zip code:
$1,318
Michigan:
$1,725
(% of AGI for various income ranges: 4.6% for AGIs below $10k, 2.3% for AGIs $10k-25k, 1.1% for AGIs $25k-50k, 0.8% for AGIs $50k-75k, 0.9% for AGIs $75k-100k, 1.6% for AGIs over 100k)
Taxable dividends: $2,495 (reported on 17.6% of returns)
Here:
$2,495
State:
$3,420
(% of AGI for various income ranges: 2.7% for AGIs below $10k, 1.2% for AGIs $10k-25k, 0.6% for AGIs $25k-50k, 0.6% for AGIs $50k-75k, 0.6% for AGIs $75k-100k, 2.3% for AGIs over 100k)
Net capital gain/loss: +$8,882 (reported on 13.6% of returns)
Here:
+$8,882
State:
+$8,532
(% of AGI for various income ranges: -1.4% for AGIs below $10k, 0.4% for AGIs $10k-25k, 0.5% for AGIs $25k-50k, 0.7% for AGIs $50k-75k, 1.7% for AGIs $75k-100k, 10.4% for AGIs over 100k)
Profit/loss from business: +$10,425 (reported on 12.8% of returns)
Here:
+$10,425
State:
+$9,547
(% of AGI for various income ranges: 3.5% for AGIs below $10k, 3.8% for AGIs $10k-25k, 2.2% for AGIs $25k-50k, 2.6% for AGIs $50k-75k, 2.5% for AGIs $75k-100k, 5.7% for AGIs over 100k)
IRA payment deduction: $2,868 (reported on 2.8% of returns)
49120:
$2,868
Michigan:
$2,875
(% of AGI for various income ranges: 0.1% for AGIs below $10k, 0.3% for AGIs $10k-25k, 0.3% for AGIs $25k-50k, 0.2% for AGIs $50k-75k, 0.2% for AGIs $75k-100k, 0.1% for AGIs over 100k)
Self-employed pension: $13,364 (reported on 0.7% of returns)
Here:
$13,364
Michigan:
$13,826
(% of AGI for various income ranges: 0.1% for AGIs $50k-75k, 0.2% for AGIs $75k-100k, 0.7% for AGIs over 100k)
Total itemized deductions: $16,174 (21% of AGI, reported on 25.3% of returns)
Here:
$16,174
State:
$18,509
Here:
21.1% of AGI
State:
20.7% of AGI
(% of AGI for various income ranges: 8.1% for AGIs below $10k, 6.4% for AGIs $10k-25k, 8.8% for AGIs $25k-50k, 10.4% for AGIs $50k-75k, 12.8% for AGIs $75k-100k, 13.3% for AGIs over 100k)
Charity contributions deductions: $3,386 (4% of AGI, reported on 20.5% of returns)
Here:
$3,386
State:
$3,365
Here:
4.1% of AGI
State:
3.6% of AGI
(% of AGI for various income ranges: 0.6% for AGIs below $10k, 0.8% for AGIs $10k-25k, 1.1% for AGIs $25k-50k, 1.5% for AGIs $50k-75k, 2.2% for AGIs $75k-100k, 3.0% for AGIs over 100k)
Total tax: $5,514 (reported on 72.2% of returns)
49120:
$5,514
State:
$7,691
(% of AGI for various income ranges: 2.3% for AGIs below $10k, 3.8% for AGIs $10k-25k, 6.8% for AGIs $25k-50k, 8.8% for AGIs $50k-75k, 10.5% for AGIs $75k-100k, 18.6% for AGIs over 100k)
Earned income credit: $1,673 (reported on 17.0% of returns)
Here:
$1,673
State:
$1,737
Percentage of individuals using paid preparers for their 2004 taxes: 59.2%
Here:
59%
State:
60%
(% for various income ranges: 52.8% for AGIs below $10k, 61.7% for AGIs $10k-25k, 59.8% for AGIs $25k-50k, 60.9% for AGIs $50k-75k, 57.9% for AGIs $75k-100k, 68.1% for AGIs over 100k)
Likely homosexual households (counted as self-reported same-sex unmarried-partner households)
Lesbian couples: 0.2% of all households
Gay men: 0.2% of all households
Household received Food Stamps/SNAP in the past 12 months: 1,598 Household did not receive Food Stamps/SNAP in the past 12 months: 13,372
Women who had a birth in the past 12 months: 342 (228 now married, 114 unmarried) Women who did not have a birth in the past 12 months: 7,182 (3,176 now married, 3,998 unmarried)
Housing units in zip code 49120 with a mortgage: 7,123 (599 second mortgage, 11 home equity loan, 547 both second mortgage and home equity loan) Houses without a mortgage: 469
Median monthly owner costs for units with a mortgage: $1,107 Median monthly owner costs for units without a mortgage: $435
Residents with income below the poverty level in 2022:
This zip code:
15.0%
Whole state:
13.4%
Residents with income below 50% of the poverty level in 2022:
This zip code:
8.4%
Whole state:
6.9%
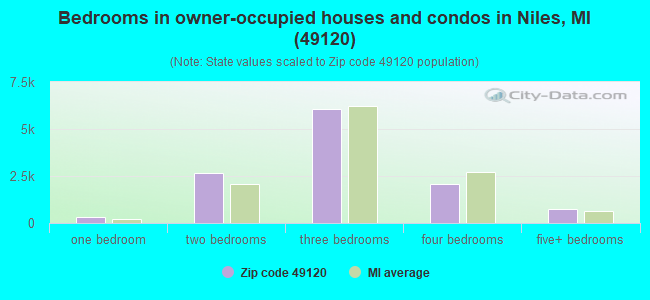
Median number of rooms in houses and condos:
Here:
6.3
State:
6.5
Median number of rooms in apartments:
Here:
4.0
State:
4.3
Notable locations in this zip code not listed on our city pages
3,971 married couples with children.
2,130 single-parent households (674 men, 1,456 women).
95.8% of residents of 49120 zip code speak English at home.
2.1% of residents speak Spanish at home (83% very well, 9% well, 5% not well, 3% not at all).
1.4% of residents speak other Indo-European language at home (90% very well, 10% well).
0.2% of residents speak Asian or Pacific Island language at home (73% very well, 21% well, 6% not well).
0.3% of residents speak other language at home (100% very well).
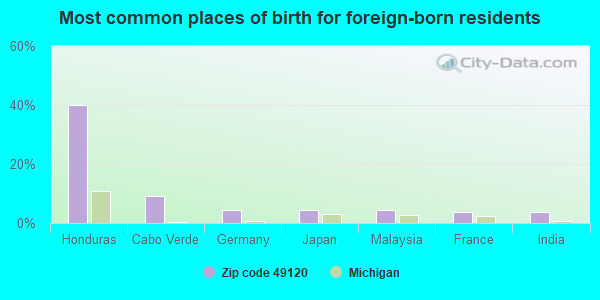
Foreign born population: 1,026 (2.8%) (49.0% of them are naturalized citizens)
This zip code:
2.8%
Whole state:
6.9%
40%Honduras
9%Cabo Verde
4%Germany
4%Japan
4%Malaysia
4%France
4%India
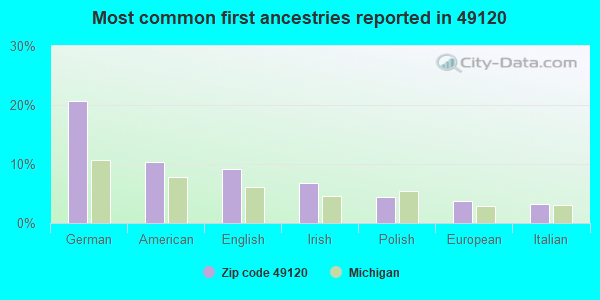
21%German
10%American
9%English
7%Irish
4%Polish
4%European
3%Italian
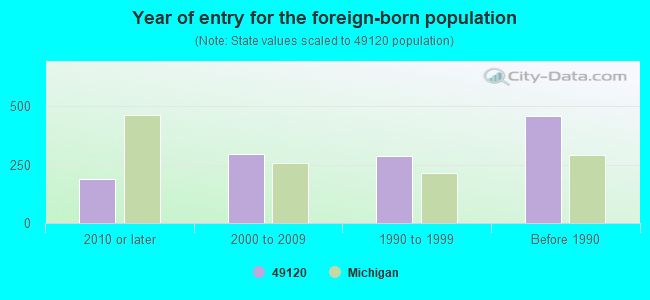
Year of entry for the foreign-born population
1892010 or later
2942000 to 2009
2861990 to 1999
458Before 1990
Major facilities with environmental interests located in this zip code:
EXXONMOBIL OIL CORP NILES TERMINAL (2150 S. THIRD ST. in NILES, MI)
AIR MINOR (AIRS/AFS) OIL CONTROL (Facility Response Plan for oil discharge) CRITERIA AND HAZARDOUS AIR POLLUTANT INVENTORY (Inventory of air pollution sources) Small Quantity Generators, between 100 kg and 1000 kg of hazardous waste/month (Resource Conservation and Recovery Act (tracking hazardous waste)) TRI REPORTER (Tracking of toxic chemicals releasing facilities) Business SIC classification: PETROLEUM BULK STATIONS AND TERMINALS Organizations: EXXONMOBIL OIL CORPORATION (CONTACT/GENERAL)
Alternative names: EXXONMOBIL OIL CORPORATION NILES, MI TERMINAL, MOBIL OIL NILES TERMINAL
BALLARD ELEMENTARY SCHOOL (1601 W. CHICAGO ROAD in NILES, MI)
(National Center for Education Statistics) - STATE ID-00184 Organizations: NILES COMMUNITY SCHOOL DISTRICT (SCHOOL DISTRICT)
MERRITT ELEMENTARY SCHOOL (1620 LASALLE STREET in NILES, MI)
(National Center for Education Statistics) - STATE ID-08303 Organizations: BRANDYWINE PUBLIC SCHOOL DISTRICT (SCHOOL DISTRICT)
BELL EDUCATION CENTER (1830 S. THIRD in NILES, MI)
(National Center for Education Statistics) - STATE ID-08161 Organizations: BRANDYWINE PUBLIC SCHOOL DISTRICT (SCHOOL DISTRICT)
EASTSIDE ELEMENTARY SCHOOL (315 N. 14TH STREET in NILES, MI)
(National Center for Education Statistics) - STATE ID-01056 Organizations: NILES COMMUNITY SCHOOL DISTRICT (SCHOOL DISTRICT)
FRENCH PAPER CO (100 FRENCH STREET in NILES, MI)
AIR SYNTHETIC MINOR (AIRS/AFS) COMPLIANCE ACTIVITY (Tracking inspections of insecticide, fungicide, and rodenticide, and toxic substances) CRITERIA AND HAZARDOUS AIR POLLUTANT INVENTORY (Inventory of air pollution sources) National Pollutant Discharge Elimination System MAJOR (Tracking pollutant discharge elimination systems) - permit Business SIC classification: PAPER MILLS Organizations: FRENCH PAPER COMPANY (CONTACT/OWNER)
EQUILON ENTERPRISES LLC (NILES PLANT in NILES, MI)
National Pollutant Discharge Elimination System NON-MAJOR (Tracking pollutant discharge elimination systems) - permit Business SIC classification: PETROLEUM BULK STATIONS AND TERMINALS Alternative names: EQUILON ENTERPRISES-NILES
GREATER NILES COMMUNITY DEVELOPMENT CORP (700 N 5TH ST in NILES, MI)
(Resource Conservation and Recovery Act (tracking hazardous waste)) Organizations: SECOR (CONTACT/OPERATOR)
Alternative names: SPENCERS CLEANERS
AT&T TECHNOLOGIES INC INFO SYSTEMS (2121 W CHICAGO RD in NILES, MI)
(Resource Conservation and Recovery Act (tracking hazardous waste)) Organizations: AT&T TECHNOLOGIES, INC. (CONTACT/OWNER)
AAA ASSOCIATES INC (2732 SOUTH 3RD STREET in NILES, MI)
AIR MAJOR (AIRS/AFS) Conditionally Exempt Small Quantity Generators, less than 100 kg/month of hazardous waste (Resource Conservation and Recovery Act (tracking hazardous waste)) TRI REPORTER (Tracking of toxic chemicals releasing facilities) Business SIC classification: CUSTOM COMPOUNDING OF PURCHASED PLASTICS RESINS Organizations: ROBERT J AND VELMA MCVICKER (CONTACT/OPERATOR)
MI DEPT/ENVIRONMENTAL QUALITY (1056 HUNTLEY ROAD in NILES, MI)
(Resource Conservation and Recovery Act (tracking hazardous waste)) Alternative names: FORMER U.S. AVIEX SITE
MI DEPT/TRANSPORTATION BRIDGE (US-12 OVER ST JOE RIVER BRIDGE in NILES, MI)
(Resource Conservation and Recovery Act (tracking hazardous waste)) Organizations: MICH DEPT OF TRANSPORTATION (CONTACT/OPERATOR)
Alternative names: MIDOT BRIDGE US-12 OVER ST JOE RIVER
MDEQ-RRD-FORMER HENCO ENT (2241 LAKE ST in NILES, MI)
National Pollutant Discharge Elimination System NON-MAJOR (Tracking pollutant discharge elimination systems) - permit Business SIC classification: NONCLASSIFIABLE ESTABLISHMENTS
Housing units lacking complete plumbing facilities: 1.7% Housing units lacking complete kitchen facilities: 2.1%
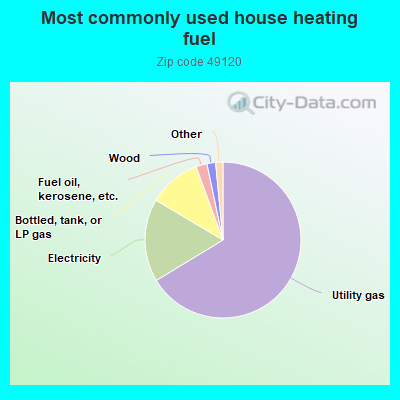
66.4%Utility gas
17.2%Electricity
10.9%Bottled, tank, or LP gas
2.3%Fuel oil, kerosene, etc.
1.8%Wood
0.7%No fuel used
0.6%Other fuel
Population in 1990: 33,750. Population change in the 1990s: +1,606 (+4.8%).
Place of birth for U.S.-born residents:
This state: 17,748
Northeast: 647
Midwest: 14,360
South: 1,732
West: 1,193
62% of the 49120 zip code residents lived in the same house 5 years ago. Out of people who lived in different houses, 51% lived in this county. Out of people who lived in different counties, 50% lived in Michigan.
93% of the 49120 zip code residents lived in the same house 1 year ago. Out of people who lived in different houses, 44% moved from this county. Out of people who lived in different houses, 26% moved from different county within same state. Out of people who lived in different houses, 33% moved from different state. Out of people who lived in different houses, 0% moved from abroad.
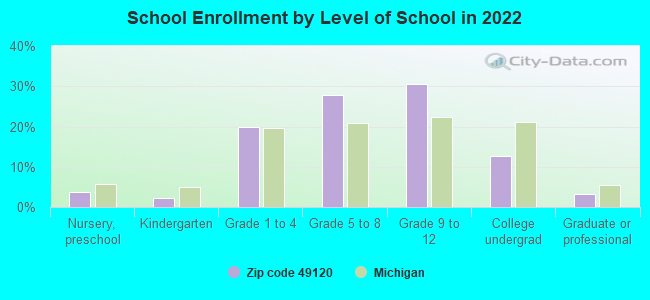
Private vs. public school enrollment:
Students in private schools in grades 1 to 8 (elementary and middle school): 374
Here:
10.5%
Michigan:
12.4%
Students in private schools in grades 9 to 12 (high school): 390
Here:
17.2%
Michigan:
9.8%
Students in private undergraduate colleges: 120
Here:
12.7%
Michigan:
14.9%
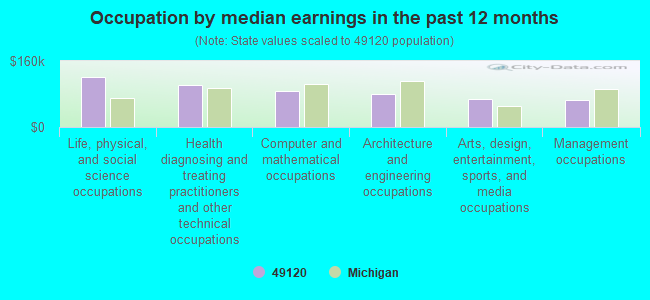
Occupation by median earnings in the past 12 months ($)
122,371Life, physical, and social science occupations
100,709Health diagnosing and treating practitioners and other technical occupations
87,237Computer and mathematical occupations
80,124Architecture and engineering occupations
67,536Arts, design, entertainment, sports, and media occupations
65,219Management occupations
Companies with federal contracts located in this zip code (NILES, MI):
RR TEMPLETON CORP (1916 INDUSTRIAL DRIVE; small business) : $412,963 in 54 contractsfrom 2000 to 2006
Contracts for Engine Fuel System Components, Aircraft and Missile Prime Movers, Bearings, Plain, Unmounted, Engine Electrical System Components, Aircraft Prime Moving, Nuts and Washers, and moreby Defense Logistics Agency Signed by year:2000: $84,316; 2001: $0; 2002: $0; 2003: $0; 2004: $57,469; 2005: $213,014; 2006: $58,164.
Biggest contracts:
$84,316 with Defense Logistics Agency for Engine Fuel System Components, Aircraft and Missile Prime Movers. Signed on 2000-04-02. Completion date: 2000-06-02.
$24,742 with Defense Logistics Agency for Bearings, Plain, Unmounted. Signed on 2005-09-28. Completion date: 2005-10-30.
$18,540 with Defense Logistics Agency for Engine Electrical System Components, Aircraft Prime Moving. Signed on 2004-12-10. Completion date: 2005-02-21.
$14,750 with Defense Logistics Agency for Engine Fuel System Components, Aircraft and Missile Prime Movers. Signed on 2004-10-30. Completion date: 2004-12-08.
NILES PRECISION CO (1308 FORT ST; small business) : $407,570 in 13 contractsfrom 2000 to 2006
Contracts for Nails, Machine Keys, and Pins, Engine Fuel System Components, Aircraft and Missile Prime Movers, Miscellaneous Engine Accessories, Aircraft, Gas Turbines and Jet Engines, Aircraft; Prime Moving, and Components by Defense Logistics Agency Signed by year:2000: $37,940; 2001: $104,730; 2002: $159,801; 2003: $0; 2004: $10,513; 2005: $3,604; 2006: $90,982.
Biggest contracts:
$87,900 with Defense Logistics Agency for Nails, Machine Keys, and Pins. Signed on 2006-03-30. Completion date: 2007-06-23.
$85,461, same as above.Signed on 2002-06-12. Completion date: 2002-10-30.
$74,340, same as above.Signed on 2002-06-25. Completion date: 2002-06-25.
$53,500, same as above.Signed on 2001-03-22. Completion date: 2001-03-23.
FAN GROUP INC (1701 TERMINAL RD # B; small business)
$12,838 with Army for Machine Tool Accessories. Signed on 2006-02-14. Completion date: 2006-04-11.
MARK AND CINDY SCHLUTT (1322 LYKINS LANE; small business) : $7,759 in 5 contractsfrom 2003 to 2004
Contracts for Landscaping/Groundskeeping Services by Army Signed by year:2000: $0; 2001: $0; 2002: $0; 2003: $3,679; 2004: $4,080; 2005: $0; 2006: $0.
Biggest contracts:
$3,684 with Army for Landscaping/Groundskeeping Services. Taking place in IN. Signed on 2004-03-21. Completion date: 2004-03-31.
$3,612, same as above.Signed on 2003-03-08. Completion date: 2004-03-31.
$396, same as above.Signed on 2004-10-13. Completion date: 2005-03-31.
$67, same as above.Signed on 2003-12-30. Completion date: 2004-03-31.
MODINEER CO (2190 INDUSTRIAL DRIVE)
$139 with Navy for Metal Finishing Equipment. Taking place in IL. Signed on 2005-09-22. Completion date: 2005-10-21.
Top industries in this zip code by the number of employees in 2005:
Health Care and Social Assistance: Nursing Care Facilities (100-249 employees: 2 establishments, 50-99 employees: 1 establishment)
2002 - 2018 National Fire Incident Reporting System (NFIRS) incidents
According to the data from the years 2002 - 2018 the average number of fire incidents per year is 162. The highest number of reported fire incidents - 256 took place in 2010, and the least - 81 in 2008. The data has a decreasing trend.
When looking into fire subcategories, the most reports belonged to: Structure Fires (52.1%), and Outside Fires (28.9%).
Fire incident types reported to NFIRS in Zip Code 49120


 Nearest zip codes: 46637, 49102, 46635, 46556, 46530, 46616.
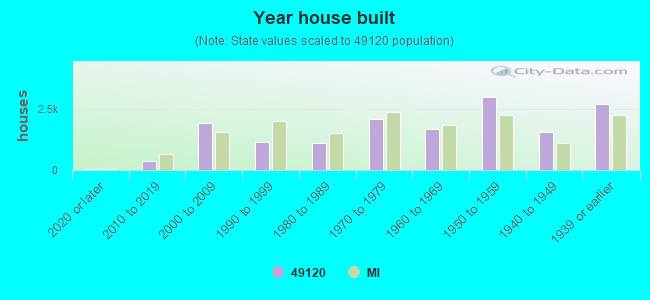


 According to the data from the years 2002 - 2018 the average number of fire incidents per year is 162. The highest number of reported fire incidents - 256 took place in 2010, and the least - 81 in 2008. The data has a decreasing trend.
 When looking into fire subcategories, the most reports belonged to: Structure Fires (52.1%), and Outside Fires (28.9%).