Estimated zip code population in 2022: 49,391 Zip code population in 2010: 45,190 Zip code population in 2000: 45,567
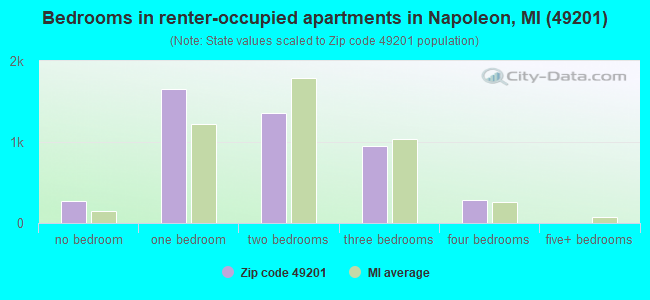
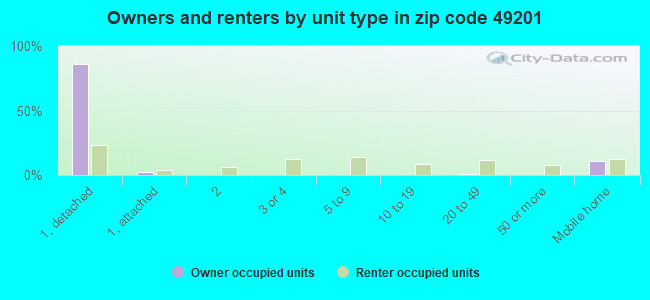
Houses and condos: 18,258 Renter-occupied apartments: 4,539
% of renters here:
27%
State:
27%
March 2022 cost of living index in zip code 49201: 82.8 (low, U.S. average is 100)
Land area: 152.6 sq. mi. Water area: 5.0 sq. mi.
Population density: 324 people per square mile
(very low).
OSM Map
General Map
Google Map
MSN Map
OSM Map
General Map
Google Map
MSN Map
OSM Map
General Map
Google Map
MSN Map
OSM Map
General Map
Google Map
MSN Map
Please wait while loading the map...
Real estate property taxes paid for housing units in 2022:
This zip code:
1.2% ($2,471)
Michigan:
1.2% ($2,746)
Median real estate property taxes paid for housing units with mortgages in 2022: $2,608 (1.1%) Median real estate property taxes paid for housing units with no mortgage in 2022: $2,291 (1.3%)
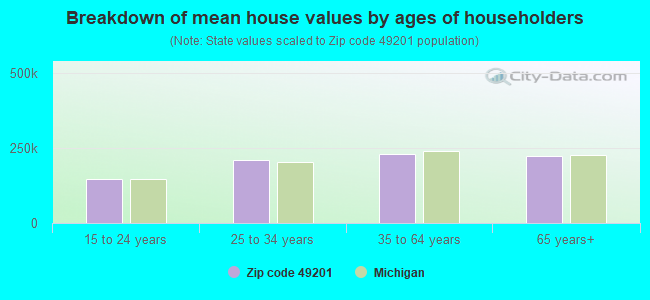
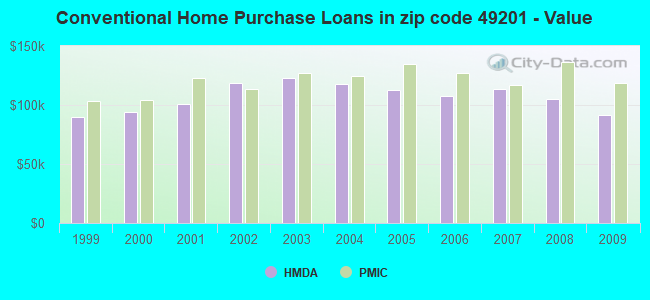
Estimated median house/condo value in 2022: $208,332
49201:
$208,332
Michigan:
$224,400
According to our research of Michigan and other state lists, there were 139 registered sex offenders living in 49201 zip code as of April 27, 2024. The ratio of all residents to sex offenders in zip code 49201 is 325 to 1. The ratio of registered sex offenders to all residents in this zip code is near the state average.
Median resident age:
This zip code:
42.5 years
Michigan median age:
40.3 years
Average household size:
This zip code:
2.4 people
Michigan:
2.4 people
Averages for the 2020 tax year for zip code 49201, filed in 2021:
Average Adjusted Gross Income (AGI) in 2020: $63,064 (Individual Income Tax Returns)
Here:
$63,064
State:
$68,945
Salary/wage: $55,128 (reported on 77.5% of returns)
Here:
$55,128
State:
$57,142
(% of AGI for various income ranges: 966.5% for AGIs below $25k, 3213.2% for AGIs $25k-50k, 6061.2% for AGIs $50k-75k, 8874.0% for AGIs $75k-100k, 16052.3% for AGIs $100k-200k, 66360.9% for AGIs over 200k)
Taxable interest for individuals: $1,072 (reported on 31.7% of returns)
This zip code:
$1,072
Michigan:
$1,630
(% of AGI for various income ranges: 15.7% for AGIs below $25k, 17.3% for AGIs $25k-50k, 29.3% for AGIs $50k-75k, 56.2% for AGIs $75k-100k, 71.0% for AGIs $100k-200k, 1195.2% for AGIs over 200k)
Ordinary dividends: $5,293 (reported on 16.2% of returns)
Here:
$5,293
State:
$6,972
(% of AGI for various income ranges: 18.7% for AGIs below $25k, 31.4% for AGIs $25k-50k, 63.5% for AGIs $50k-75k, 76.0% for AGIs $75k-100k, 236.0% for AGIs $100k-200k, 3706.1% for AGIs over 200k)
Net capital gain/loss in AGI: +$14,250 (reported on 14.0% of returns)
Here:
+$14,250
State:
+$20,064
(% of AGI for various income ranges: 7.1% for AGIs below $25k, 28.4% for AGIs $25k-50k, 65.0% for AGIs $50k-75k, 133.7% for AGIs $75k-100k, 412.4% for AGIs $100k-200k, 12211.7% for AGIs over 200k)
Profit/loss from business: +$12,376 (reported on 11.7% of returns)
Here:
+$12,376
State:
+$11,172
(% of AGI for various income ranges: 66.2% for AGIs below $25k, 73.8% for AGIs $25k-50k, 132.9% for AGIs $50k-75k, 191.3% for AGIs $75k-100k, 408.6% for AGIs $100k-200k, 4507.0% for AGIs over 200k)
Taxable individual retirement arrangement distribution: $21,187 (reported on 10.9% of returns)
49201:
$21,187
Michigan:
$19,803
(% of AGI for various income ranges: 67.7% for AGIs below $25k, 125.3% for AGIs $25k-50k, 289.3% for AGIs $50k-75k, 545.2% for AGIs $75k-100k, 959.9% for AGIs $100k-200k, 3324.8% for AGIs over 200k)
Self-employed (Keogh) retirement plans: $18,800 (reported on 0.5% of returns)
49201:
$18,800
Michigan:
$25,132
(% of AGI for various income ranges: 26.4% for AGIs $100k-200k, 537.0% for AGIs over 200k)
Total itemized deductions: $34,813 (reported on 4.6% of returns)
Here:
$34,813
State:
$34,117
(% of AGI for various income ranges: 26.2% for AGIs below $25k, 61.8% for AGIs $25k-50k, 132.6% for AGIs $50k-75k, 238.7% for AGIs $75k-100k, 458.0% for AGIs $100k-200k, 6238.3% for AGIs over 200k)
Charity contributions: $15,201 (reported on 3.5% of returns)
Here:
$15,201
State:
$13,548
(% of AGI for various income ranges: 1.6% for AGIs below $25k, 7.8% for AGIs $25k-50k, 27.1% for AGIs $50k-75k, 41.2% for AGIs $75k-100k, 124.7% for AGIs $100k-200k, 3026.5% for AGIs over 200k)
Taxes paid: $7,616 (reported on 4.5% of returns)
49201:
$7,616
State:
$7,972
(% of AGI for various income ranges: 4.0% for AGIs below $25k, 8.8% for AGIs $25k-50k, 34.2% for AGIs $50k-75k, 69.0% for AGIs $75k-100k, 137.7% for AGIs $100k-200k, 983.5% for AGIs over 200k)
Earned income credit: $2,213 (reported on 13.7% of returns)
Here:
$2,213
State:
$2,251
(% of AGI for various income ranges: 75.1% for AGIs below $25k, 65.2% for AGIs $25k-50k, 1.5% for AGIs $50k-75k)
Percentage of individuals using paid preparers for their 2020 taxes: 91.3%
Here:
91%
State:
93%
(% for various income ranges: 86.0% for AGIs below $25k, 93.8% for AGIs $25k-50k, 94.3% for AGIs $50k-75k, 93.9% for AGIs $75k-100k, 93.9% for AGIs $100k-200k, 95.7% for AGIs over 200k)
Averages for the 2012 tax year for zip code 49201, filed in 2013:
Average Adjusted Gross Income (AGI) in 2012: $53,639 (Individual Income Tax Returns)
Here:
$53,639
State:
$55,609
Salary/wage: $47,135 (reported on 82.7% of returns)
Here:
$47,135
State:
$46,782
(% of AGI for various income ranges: 70.8% for AGIs below $25k, 75.1% for AGIs $25k-50k, 76.3% for AGIs $50k-75k, 78.0% for AGIs $75k-100k, 79.7% for AGIs $100k-200k, 53.6% for AGIs over 200k)
Taxable interest for individuals: $1,320 (reported on 34.5% of returns)
This zip code:
$1,320
Michigan:
$1,491
(% of AGI for various income ranges: 1.3% for AGIs below $25k, 0.8% for AGIs $25k-50k, 0.6% for AGIs $50k-75k, 0.5% for AGIs $75k-100k, 0.6% for AGIs $100k-200k, 1.5% for AGIs over 200k)
Ordinary dividends: $4,889 (reported on 18.1% of returns)
Here:
$4,889
State:
$6,225
(% of AGI for various income ranges: 1.3% for AGIs below $25k, 0.9% for AGIs $25k-50k, 0.8% for AGIs $50k-75k, 0.9% for AGIs $75k-100k, 1.1% for AGIs $100k-200k, 4.6% for AGIs over 200k)
Net capital gain/loss in AGI: +$6,692 (reported on 13.1% of returns)
Here:
+$6,692
State:
+$9,326
(% of AGI for various income ranges: 0.2% for AGIs $25k-50k, 0.3% for AGIs $50k-75k, 0.4% for AGIs $75k-100k, 1.0% for AGIs $100k-200k, 7.0% for AGIs over 200k)
Profit/loss from business: +$12,294 (reported on 12.8% of returns)
Here:
+$12,294
State:
+$11,523
(% of AGI for various income ranges: 5.2% for AGIs below $25k, 2.2% for AGIs $25k-50k, 2.3% for AGIs $50k-75k, 1.5% for AGIs $75k-100k, 2.6% for AGIs $100k-200k, 4.7% for AGIs over 200k)
Taxable individual retirement arrangement distribution: $16,140 (reported on 11.7% of returns)
49201:
$16,140
Michigan:
$15,298
(% of AGI for various income ranges: 4.1% for AGIs below $25k, 3.8% for AGIs $25k-50k, 3.7% for AGIs $50k-75k, 3.6% for AGIs $75k-100k, 3.2% for AGIs $100k-200k, 3.2% for AGIs over 200k)
Self-employment retirement plans: $21,088 (reported on 0.4% of returns)
49201:
$21,088
Michigan:
$20,834
(% of AGI for various income ranges: 0.4% for AGIs below $25k, 0.1% for AGIs $100k-200k, 0.5% for AGIs over 200k)
Total itemized deductions: $20,027 (18% of AGI, reported on 27.9% of returns)
Here:
$20,027
State:
$21,628
Here:
18.1% of AGI
State:
18.4% of AGI
(% of AGI for various income ranges: 6.4% for AGIs below $25k, 7.4% for AGIs $25k-50k, 9.9% for AGIs $50k-75k, 11.7% for AGIs $75k-100k, 12.9% for AGIs $100k-200k, 10.5% for AGIs over 200k)
Charity contributions: $3,625 (reported on 21.8% of returns)
Here:
$3,625
State:
$4,225
(% of AGI for various income ranges: 0.6% for AGIs below $25k, 0.7% for AGIs $25k-50k, 1.1% for AGIs $50k-75k, 1.6% for AGIs $75k-100k, 2.1% for AGIs $100k-200k, 1.8% for AGIs over 200k)
Taxes paid: $7,437 (reported on 27.9% of returns)
49201:
$7,437
State:
$8,327
(% of AGI for various income ranges: 1.4% for AGIs below $25k, 1.9% for AGIs $25k-50k, 3.0% for AGIs $50k-75k, 3.9% for AGIs $75k-100k, 5.3% for AGIs $100k-200k, 5.3% for AGIs over 200k)
Earned income credit: $2,265 (reported on 18.0% of returns)
Here:
$2,265
State:
$2,306
(% of AGI for various income ranges: 6.8% for AGIs below $25k, 1.1% for AGIs $25k-50k)
Percentage of individuals using paid preparers for their 2012 taxes: 50.1%
Here:
50%
State:
57%
(% for various income ranges: 44.9% for AGIs below $25k, 51.2% for AGIs $25k-50k, 52.7% for AGIs $50k-75k, 54.3% for AGIs $75k-100k, 55.9% for AGIs $100k-200k, 75.0% for AGIs over 200k)
Averages for the 2004 tax year for zip code 49201, filed in 2005:
Average Adjusted Gross Income (AGI) in 2004: $45,219 (Individual Income Tax Returns)
Here:
$45,219
State:
$48,204
Salary/wage: $42,024 (reported on 85.7% of returns)
Here:
$42,024
State:
$42,791
(% of AGI for various income ranges: 105.4% for AGIs below $10k, 73.3% for AGIs $10k-25k, 80.4% for AGIs $25k-50k, 83.7% for AGIs $50k-75k, 86.1% for AGIs $75k-100k, 73.1% for AGIs over 100k)
Taxable interest for individuals: $1,425 (reported on 47.3% of returns)
This zip code:
$1,425
Michigan:
$1,725
(% of AGI for various income ranges: 5.3% for AGIs below $10k, 2.7% for AGIs $10k-25k, 1.6% for AGIs $25k-50k, 1.1% for AGIs $50k-75k, 1.0% for AGIs $75k-100k, 1.5% for AGIs over 100k)
Taxable dividends: $2,412 (reported on 21.3% of returns)
Here:
$2,412
State:
$3,420
(% of AGI for various income ranges: 2.9% for AGIs below $10k, 1.3% for AGIs $10k-25k, 0.9% for AGIs $25k-50k, 0.7% for AGIs $50k-75k, 0.7% for AGIs $75k-100k, 1.6% for AGIs over 100k)
Net capital gain/loss: +$6,639 (reported on 16.4% of returns)
Here:
+$6,639
State:
+$8,532
(% of AGI for various income ranges: 0.5% for AGIs below $10k, 0.1% for AGIs $10k-25k, 0.6% for AGIs $25k-50k, 0.7% for AGIs $50k-75k, 1.1% for AGIs $75k-100k, 6.0% for AGIs over 100k)
Profit/loss from business: +$10,174 (reported on 13.4% of returns)
Here:
+$10,174
State:
+$9,547
(% of AGI for various income ranges: 3.1% for AGIs below $10k, 3.6% for AGIs $10k-25k, 2.2% for AGIs $25k-50k, 2.0% for AGIs $50k-75k, 1.7% for AGIs $75k-100k, 4.7% for AGIs over 100k)
IRA payment deduction: $2,986 (reported on 2.0% of returns)
49201:
$2,986
Michigan:
$2,875
(% of AGI for various income ranges: 0.2% for AGIs below $10k, 0.1% for AGIs $10k-25k, 0.2% for AGIs $25k-50k, 0.2% for AGIs $50k-75k, 0.1% for AGIs $75k-100k, 0.1% for AGIs over 100k)
Self-employed pension: $13,583 (reported on 0.7% of returns)
Here:
$13,583
Michigan:
$13,826
(% of AGI for various income ranges: 0.1% for AGIs $25k-50k, 0.1% for AGIs $50k-75k, 0.1% for AGIs $75k-100k, 0.5% for AGIs over 100k)
Total itemized deductions: $16,835 (20% of AGI, reported on 34.1% of returns)
Here:
$16,835
State:
$18,509
Here:
20.2% of AGI
State:
20.7% of AGI
(% of AGI for various income ranges: 11.1% for AGIs below $10k, 8.1% for AGIs $10k-25k, 11.0% for AGIs $25k-50k, 13.9% for AGIs $50k-75k, 14.6% for AGIs $75k-100k, 13.0% for AGIs over 100k)
Charity contributions deductions: $2,829 (3% of AGI, reported on 28.6% of returns)
Here:
$2,829
State:
$3,365
Here:
3.2% of AGI
State:
3.6% of AGI
(% of AGI for various income ranges: 0.5% for AGIs below $10k, 0.7% for AGIs $10k-25k, 1.1% for AGIs $25k-50k, 1.7% for AGIs $50k-75k, 1.9% for AGIs $75k-100k, 2.6% for AGIs over 100k)
Total tax: $6,648 (reported on 74.5% of returns)
49201:
$6,648
State:
$7,691
(% of AGI for various income ranges: 2.5% for AGIs below $10k, 3.9% for AGIs $10k-25k, 6.9% for AGIs $25k-50k, 8.5% for AGIs $50k-75k, 10.0% for AGIs $75k-100k, 17.6% for AGIs over 100k)
Earned income credit: $1,684 (reported on 14.2% of returns)
Here:
$1,684
State:
$1,737
Percentage of individuals using paid preparers for their 2004 taxes: 54.5%
Here:
54%
State:
60%
(% for various income ranges: 47.9% for AGIs below $10k, 55.1% for AGIs $10k-25k, 56.1% for AGIs $25k-50k, 57.1% for AGIs $50k-75k, 55.9% for AGIs $75k-100k, 59.1% for AGIs over 100k)
Likely homosexual households (counted as self-reported same-sex unmarried-partner households)
Lesbian couples: 0.1% of all households
Gay men: 0.0% of all households
Household received Food Stamps/SNAP in the past 12 months: 2,362 Household did not receive Food Stamps/SNAP in the past 12 months: 14,766
Women who had a birth in the past 12 months: 251 (195 now married, 57 unmarried) Women who did not have a birth in the past 12 months: 8,139 (3,313 now married, 4,823 unmarried)
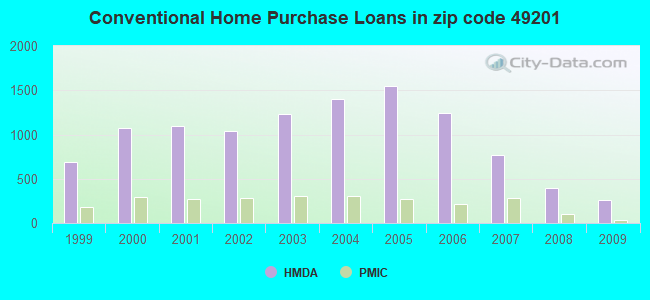
Housing units in zip code 49201 with a mortgage: 6,696 (600 second mortgage, 406 both second mortgage and home equity loan) Houses without a mortgage: 328
Median monthly owner costs for units with a mortgage: $1,387 Median monthly owner costs for units without a mortgage: $575
Residents with income below the poverty level in 2022:
This zip code:
11.3%
Whole state:
13.4%
Residents with income below 50% of the poverty level in 2022:
This zip code:
7.4%
Whole state:
6.9%
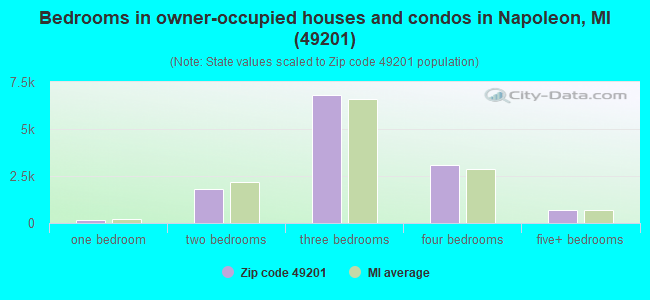
Median number of rooms in houses and condos:
Here:
6.6
State:
6.5
Median number of rooms in apartments:
Here:
4.1
State:
4.3
Notable locations in this zip code not listed on our city pages
Notable locations in zip code 49201: Jackson Harness Raceway (A), Jackson Station (B), Jackson County Fairgrounds (C), Withington Stadium (D), Jackson District Library-Carnegia Branch (E), Jackson Fire Department Station 1 Headquarters (F), Jackson City Hall (G), Jackson Police Department (H), Jackson Community Ambulance (I). Display/hide their locations on the map
Churches in zip code 49201 include: Mount Zion Church of Deliverance (A), African Methodist Episcopal Church (B), Saint Paul's Episcopal Church (C), First Baptist Church (D), First Congregational Church (E), Trinity Lutheran Church (F), Saint Mary Catholic Church (G), First United Methodist Church (H), First Church of Christ Scientist (I). Display/hide their locations on the map
Parks in zip code 49201 include: First Baptist Church Historical Marker (1), First Congregational Church Historical Marker (2), Horace Ismon Historical Marker (3), Ismon Building Historical Marker (4), Jacksonburg Public Square Historical Marker (5), Saint John's Church Historical Marker (6), Saint Mary Star of the Sea Church Historical Marker (7), Saint Paul's Episcopal Church Historical Marker (8), Bucky Harris Park (9). Display/hide their locations on the map
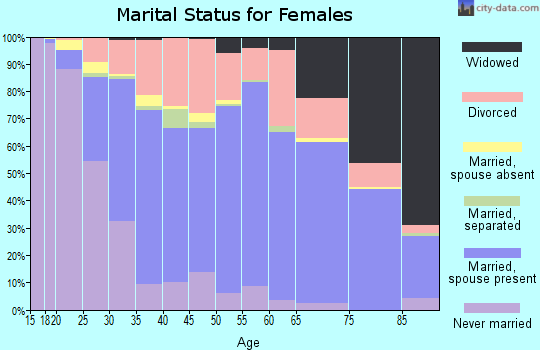
5,470 married couples with children.
2,278 single-parent households (1,027 men, 1,251 women).
96.0% of residents of 49201 zip code speak English at home.
1.9% of residents speak Spanish at home (82% very well, 3% well, 15% not well).
1.2% of residents speak other Indo-European language at home (77% very well, 21% well, 2% not well).
0.3% of residents speak Asian or Pacific Island language at home (66% very well, 4% well, 21% not well, 8% not at all).
0.4% of residents speak other language at home (67% very well, 4% well, 28% not well).
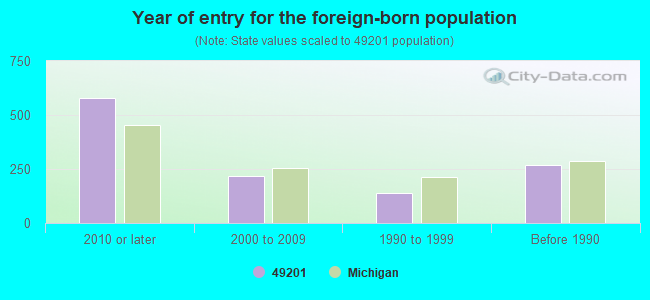
Foreign born population: 1,013 (2.1%) (44.3% of them are naturalized citizens)
Major facilities with environmental interests located in this zip code:
ALLEN SCHOOL (900 E. PEARL STREET in JACKSON, MI)
(Geographic Names Information System) (National Center for Education Statistics) - STATE ID-00066 Organizations: JACKSON PUBLIC SCHOOLS (SCHOOL DISTRICT)
BERTHA ROBINSON SCHOOL (5400 SEYMOUR ROAD in JACKSON, MI)
(National Center for Education Statistics) - STATE ID-00302 Organizations: EAST JACKSON COMMUNITY SCHOOLS (SCHOOL DISTRICT)
ACKERSON LAKE COMMUNITY EDUCATION (4126 BROOKLYN ROAD in JACKSON, MI)
(National Center for Education Statistics) - STATE ID-07973 Organizations: NAPOLEON COMMUNITY SCHOOLS (SCHOOL DISTRICT)
EAST JACKSON MIDDLE SCHOOL (4340 WALZ ROAD in JACKSON, MI)
(National Center for Education Statistics) - STATE ID-01016 Organizations: EAST JACKSON COMMUNITY SCHOOLS (SCHOOL DISTRICT)
FLORA LIST ELEMENTARY SCHOOL (6900 RIVES JUNCTION ROAD in JACKSON, MI)
(National Center for Education Statistics) - STATE ID-01252 Organizations: NORTHWEST COMMUNITY SCHOOLS (SCHOOL DISTRICT)
DIBBLE ELEMENTARY SCHOOL (3450 KIBBY ROAD in JACKSON, MI)
(National Center for Education Statistics) - STATE ID-00914 Organizations: JACKSON PUBLIC SCHOOLS (SCHOOL DISTRICT)
GENERAL PRODUCTS (2400 E SOUTH ST in JACKSON, MI)
AIR MINOR (AIRS/AFS) CRITERIA AND HAZARDOUS AIR POLLUTANT INVENTORY (Inventory of air pollution sources) Conditionally Exempt Small Quantity Generators, less than 100 kg/month of hazardous waste (Resource Conservation and Recovery Act (tracking hazardous waste)) Business SIC classification: ELECTROPLATING, PLATING, POLISHING, ANODIZING, AND COLORING; MOTOR VEHICLE PARTS AND ACCESSORIES Organizations: GENERAL PRODUCTS CORPORATION (CONTACT/OPERATOR)
AMOCO OIL CO (724 W GANSON in JACKSON, MI)
(Resource Conservation and Recovery Act (tracking hazardous waste)) Organizations: AMOCO OIL COMPANY (CONTACT/OWNER)
, BP PRODUCTS NORTH AMERICA INC (CONTACT/OWNER)
Alternative names: AMOCO OIL CO 5443
MDC-SPSM-GWCU (3955 COOPER ST in JACKSON, MI)
National Pollutant Discharge Elimination System NON-MAJOR (Tracking pollutant discharge elimination systems) - permit Business SIC classification: NONCLASSIFIABLE ESTABLISHMENTS Organizations: MICHIGAN DEPT OF CORRECTIONS (CONTACT/OWNER)
Alternative names: MDC-SPSM-ROOT CELLAR GWCU
MI DEPT/ENVIRONMENTAL QUALITY (301 E LOUIS GLICK HIGHWAY in JACKSON, MI)
Conditionally Exempt Small Quantity Generators, less than 100 kg/month of hazardous waste (Resource Conservation and Recovery Act (tracking hazardous waste)) Conditionally Exempt Small Quantity Generators, less than 100 kg/month of hazardous waste (Resource Conservation and Recovery Act (tracking hazardous waste)) Business NAICS classification: SUPPORT ACTIVITIES FOR OIL AND GAS OPERATIONS. Alternative names: MDEQ RRD JACKSON DISTRICT, MI DEPT/ENV QUALITY-REMEDIATION & REDEVE, MI DEPT/ENVIRONMENTAL QUALITY GLMD (WELL, MI DEPT/ENVIRONMENTAL QUALITY RRD
ATLAS BAKERY SUPPLIES (533 HUPP AVE in JACKSON, MI)
(Resource Conservation and Recovery Act (tracking hazardous waste)) Business NAICS classification: COMMERCIAL BAKERIES. Organizations: ABS INC (CONTACT/OWNER)
MI DEPT/TRANSPORTATION BRIDGE (US-127 UNDER PAGE AVE in JACKSON, MI)
(Resource Conservation and Recovery Act (tracking hazardous waste)) Organizations: MICH DEPT OF TRANSPORTATION (CONTACT/OPERATOR)
Alternative names: MIDOT BRIDGE US-127 UNDER PAGE AVE
Housing units lacking complete plumbing facilities: 2.4% Housing units lacking complete kitchen facilities: 3.1%
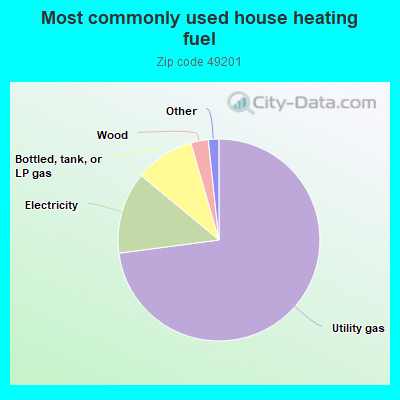
73.0%Utility gas
13.1%Electricity
9.5%Bottled, tank, or LP gas
2.8%Wood
0.7%Other fuel
0.6%Fuel oil, kerosene, etc.
Population in 1990: 42,076. Population change in the 1990s: +3,491 (+8.3%).
Place of birth for U.S.-born residents:
This state: 40,790
Northeast: 876
Midwest: 3,705
South: 2,058
West: 748
58% of the 49201 zip code residents lived in the same house 5 years ago. Out of people who lived in different houses, 62% lived in this county. Out of people who lived in different counties, 50% lived in Michigan.
84% of the 49201 zip code residents lived in the same house 1 year ago. Out of people who lived in different houses, 42% moved from this county. Out of people who lived in different houses, 43% moved from different county within same state. Out of people who lived in different houses, 12% moved from different state. Out of people who lived in different houses, 1% moved from abroad.
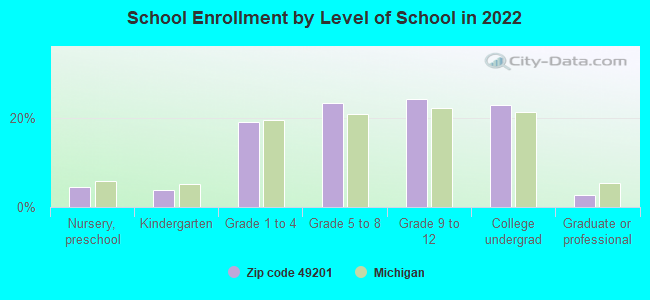
Private vs. public school enrollment:
Students in private schools in grades 1 to 8 (elementary and middle school): 445
Here:
10.1%
Michigan:
12.4%
Students in private schools in grades 9 to 12 (high school): 280
Here:
11.1%
Michigan:
9.8%
Students in private undergraduate colleges: 569
Here:
23.7%
Michigan:
14.9%
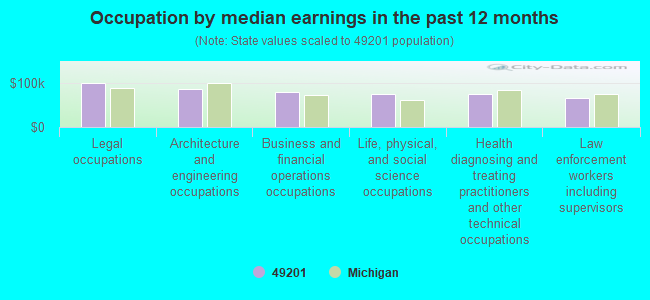
Occupation by median earnings in the past 12 months ($)
99,584Legal occupations
85,881Architecture and engineering occupations
79,522Business and financial operations occupations
74,755Life, physical, and social science occupations
73,944Health diagnosing and treating practitioners and other technical occupations
65,023Law enforcement workers including supervisors
Companies with federal contracts located in this zip code (JACKSON, MI):
DATAWARE (5750 MARATHON DRIVE; small business) : $527,249 in 5 contractsfrom 2000 to 2003
Contracts for Other Defense -- Management and Support (R&D), Other Defense -- Operational Systems Development (R&D), Other Defense -- Basic Research (R&D) by Navy Signed by year:2000: $69,776; 2001: $179,741; 2002: $149,439; 2003: $128,293; 2004: $0; 2005: $0; 2006: $0.
Biggest contracts:
$150,000 with Navy for Other Defense -- Management and Support (R&D). Signed on 2001-05-07. Completion date: 2002-12-31.
$149,439, same as above.Signed on 2002-07-12. Completion date: 2002-11-07.
$128,293 with Navy for Other Defense -- Operational Systems Development (R&D). Signed on 2003-06-19. Completion date: 2003-12-19.
$69,776 with Navy for Other Defense -- Basic Research (R&D). Signed on 2000-05-10. Completion date: 2000-09-30.
KICKING GRASS INC (2205 COOPER ST; small business) : $20,754 in 2 contractsfrom 2005 to 2006
$11,254 with Navy for Landscaping/Groundskeeping Services. Signed on 2006-03-02. Completion date: 2006-03-31.
$9,500, same as above.Signed on 2005-06-07. Completion date: 2006-03-31.
SAFETY TOOLS LLC (5060 STONE OAK DR; small business)
$7,494 with Army for Hand Tools, Edged, Nonpowered. Taking place in AL. Signed on 2005-02-18. Completion date: 2005-03-20.
ROBOT COUPE U S A, INC (P O BOX 16625; small business) : $304 in 2 contractsin 2006
$190 with Department of Veterans Affairs for Miscellaneous Items. Taking place in WV. Signed on 2006-09-01. Completion date: 2006-09-11.
$114 with Department of Veterans Affairs for Kitchen Equipment and Appliances. Taking place in WV. Signed on 2006-04-19. Completion date: 2006-04-29.
Top industries in this zip code by the number of employees in 2005:
2002 - 2018 National Fire Incident Reporting System (NFIRS) incidents
According to the data from the years 2002 - 2018 the average number of fire incidents per year is 242. The highest number of reported fire incidents - 329 took place in 2005, and the least - 150 in 2004. The data has an increasing trend.
When looking into fire subcategories, the most reports belonged to: Structure Fires (57.0%), and Outside Fires (22.2%).
Fire incident types reported to NFIRS in Zip Code 49201

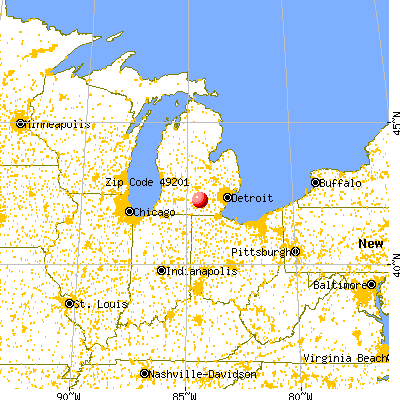


 Nearest zip codes: 49254, 49261, 49234, 49203, 49263, 49230.


 According to the data from the years 2002 - 2018 the average number of fire incidents per year is 242. The highest number of reported fire incidents - 329 took place in 2005, and the least - 150 in 2004. The data has an increasing trend.
 When looking into fire subcategories, the most reports belonged to: Structure Fires (57.0%), and Outside Fires (22.2%).