Jackson, Michigan Submit your own pictures of this city and show them to the world
OSM Map
General Map
Google Map
MSN Map
OSM Map
General Map
Google Map
MSN Map
OSM Map
General Map
Google Map
MSN Map
OSM Map
General Map
Google Map
MSN Map
Please wait while loading the map...
Population in 2022: 31,031 (100% urban, 0% rural). Population change since 2000: -14.6%Males: 14,810 Females: 16,221
March 2022 cost of living index in Jackson: 81.6 (low, U.S. average is 100) Percentage of residents living in poverty in 2022: 24.0%for White Non-Hispanic residents , 34.5% for Black residents , 32.7% for Hispanic or Latino residents , 79.2% for American Indian residents , 100.0% for Native Hawaiian and other Pacific Islander residents , 9.8% for other race residents , 29.0% for two or more races residents )
Profiles of local businesses
Business Search - 14 Million verified businesses
Data:
Median household income ($)
Median household income (% change since 2000)
Household income diversity
Ratio of average income to average house value (%)
Ratio of average income to average rent
Median household income ($) - White
Median household income ($) - Black or African American
Median household income ($) - Asian
Median household income ($) - Hispanic or Latino
Median household income ($) - American Indian and Alaska Native
Median household income ($) - Multirace
Median household income ($) - Other Race
Median household income for houses/condos with a mortgage ($)
Median household income for apartments without a mortgage ($)
Races - White alone (%)
Races - White alone (% change since 2000)
Races - Black alone (%)
Races - Black alone (% change since 2000)
Races - American Indian alone (%)
Races - American Indian alone (% change since 2000)
Races - Asian alone (%)
Races - Asian alone (% change since 2000)
Races - Hispanic (%)
Races - Hispanic (% change since 2000)
Races - Native Hawaiian and Other Pacific Islander alone (%)
Races - Native Hawaiian and Other Pacific Islander alone (% change since 2000)
Races - Two or more races (%)
Races - Two or more races (% change since 2000)
Races - Other race alone (%)
Races - Other race alone (% change since 2000)
Racial diversity
Unemployment (%)
Unemployment (% change since 2000)
Unemployment (%) - White
Unemployment (%) - Black or African American
Unemployment (%) - Asian
Unemployment (%) - Hispanic or Latino
Unemployment (%) - American Indian and Alaska Native
Unemployment (%) - Multirace
Unemployment (%) - Other Race
Population density (people per square mile)
Population - Males (%)
Population - Females (%)
Population - Males (%) - White
Population - Males (%) - Black or African American
Population - Males (%) - Asian
Population - Males (%) - Hispanic or Latino
Population - Males (%) - American Indian and Alaska Native
Population - Males (%) - Multirace
Population - Males (%) - Other Race
Population - Females (%) - White
Population - Females (%) - Black or African American
Population - Females (%) - Asian
Population - Females (%) - Hispanic or Latino
Population - Females (%) - American Indian and Alaska Native
Population - Females (%) - Multirace
Population - Females (%) - Other Race
Coronavirus confirmed cases (Apr 27, 2024)
Deaths caused by coronavirus (Apr 27, 2024)
Coronavirus confirmed cases (per 100k population) (Apr 27, 2024)
Deaths caused by coronavirus (per 100k population) (Apr 27, 2024)
Daily increase in number of cases (Apr 27, 2024)
Weekly increase in number of cases (Apr 27, 2024)
Cases doubled (in days) (Apr 27, 2024)
Hospitalized patients (Apr 18, 2022)
Negative test results (Apr 18, 2022)
Total test results (Apr 18, 2022)
COVID Vaccine doses distributed (per 100k population) (Sep 19, 2023)
COVID Vaccine doses administered (per 100k population) (Sep 19, 2023)
COVID Vaccine doses distributed (Sep 19, 2023)
COVID Vaccine doses administered (Sep 19, 2023)
Likely homosexual households (%)
Likely homosexual households (% change since 2000)
Likely homosexual households - Lesbian couples (%)
Likely homosexual households - Lesbian couples (% change since 2000)
Likely homosexual households - Gay men (%)
Likely homosexual households - Gay men (% change since 2000)
Cost of living index
Median gross rent ($)
Median contract rent ($)
Median monthly housing costs ($)
Median house or condo value ($)
Median house or condo value ($ change since 2000)
Mean house or condo value by units in structure - 1, detached ($)
Mean house or condo value by units in structure - 1, attached ($)
Mean house or condo value by units in structure - 2 ($)
Mean house or condo value by units in structure by units in structure - 3 or 4 ($)
Mean house or condo value by units in structure - 5 or more ($)
Mean house or condo value by units in structure - Boat, RV, van, etc. ($)
Mean house or condo value by units in structure - Mobile home ($)
Median house or condo value ($) - White
Median house or condo value ($) - Black or African American
Median house or condo value ($) - Asian
Median house or condo value ($) - Hispanic or Latino
Median house or condo value ($) - American Indian and Alaska Native
Median house or condo value ($) - Multirace
Median house or condo value ($) - Other Race
Median resident age
Resident age diversity
Median resident age - Males
Median resident age - Females
Median resident age - White
Median resident age - Black or African American
Median resident age - Asian
Median resident age - Hispanic or Latino
Median resident age - American Indian and Alaska Native
Median resident age - Multirace
Median resident age - Other Race
Median resident age - Males - White
Median resident age - Males - Black or African American
Median resident age - Males - Asian
Median resident age - Males - Hispanic or Latino
Median resident age - Males - American Indian and Alaska Native
Median resident age - Males - Multirace
Median resident age - Males - Other Race
Median resident age - Females - White
Median resident age - Females - Black or African American
Median resident age - Females - Asian
Median resident age - Females - Hispanic or Latino
Median resident age - Females - American Indian and Alaska Native
Median resident age - Females - Multirace
Median resident age - Females - Other Race
Commute - mean travel time to work (minutes)
Travel time to work - Less than 5 minutes (%)
Travel time to work - Less than 5 minutes (% change since 2000)
Travel time to work - 5 to 9 minutes (%)
Travel time to work - 5 to 9 minutes (% change since 2000)
Travel time to work - 10 to 19 minutes (%)
Travel time to work - 10 to 19 minutes (% change since 2000)
Travel time to work - 20 to 29 minutes (%)
Travel time to work - 20 to 29 minutes (% change since 2000)
Travel time to work - 30 to 39 minutes (%)
Travel time to work - 30 to 39 minutes (% change since 2000)
Travel time to work - 40 to 59 minutes (%)
Travel time to work - 40 to 59 minutes (% change since 2000)
Travel time to work - 60 to 89 minutes (%)
Travel time to work - 60 to 89 minutes (% change since 2000)
Travel time to work - 90 or more minutes (%)
Travel time to work - 90 or more minutes (% change since 2000)
Marital status - Never married (%)
Marital status - Now married (%)
Marital status - Separated (%)
Marital status - Widowed (%)
Marital status - Divorced (%)
Median family income ($)
Median family income (% change since 2000)
Median non-family income ($)
Median non-family income (% change since 2000)
Median per capita income ($)
Median per capita income (% change since 2000)
Median family income ($) - White
Median family income ($) - Black or African American
Median family income ($) - Asian
Median family income ($) - Hispanic or Latino
Median family income ($) - American Indian and Alaska Native
Median family income ($) - Multirace
Median family income ($) - Other Race
Median year house/condo built
Median year apartment built
Year house built - Built 2005 or later (%)
Year house built - Built 2000 to 2004 (%)
Year house built - Built 1990 to 1999 (%)
Year house built - Built 1980 to 1989 (%)
Year house built - Built 1970 to 1979 (%)
Year house built - Built 1960 to 1969 (%)
Year house built - Built 1950 to 1959 (%)
Year house built - Built 1940 to 1949 (%)
Year house built - Built 1939 or earlier (%)
Average household size
Household density (households per square mile)
Average household size - White
Average household size - Black or African American
Average household size - Asian
Average household size - Hispanic or Latino
Average household size - American Indian and Alaska Native
Average household size - Multirace
Average household size - Other Race
Occupied housing units (%)
Vacant housing units (%)
Owner occupied housing units (%)
Renter occupied housing units (%)
Vacancy status - For rent (%)
Vacancy status - For sale only (%)
Vacancy status - Rented or sold, not occupied (%)
Vacancy status - For seasonal, recreational, or occasional use (%)
Vacancy status - For migrant workers (%)
Vacancy status - Other vacant (%)
Residents with income below the poverty level (%)
Residents with income below 50% of the poverty level (%)
Children below poverty level (%)
Poor families by family type - Married-couple family (%)
Poor families by family type - Male, no wife present (%)
Poor families by family type - Female, no husband present (%)
Poverty status for native-born residents (%)
Poverty status for foreign-born residents (%)
Poverty among high school graduates not in families (%)
Poverty among people who did not graduate high school not in families (%)
Residents with income below the poverty level (%) - White
Residents with income below the poverty level (%) - Black or African American
Residents with income below the poverty level (%) - Asian
Residents with income below the poverty level (%) - Hispanic or Latino
Residents with income below the poverty level (%) - American Indian and Alaska Native
Residents with income below the poverty level (%) - Multirace
Residents with income below the poverty level (%) - Other Race
Air pollution - Air Quality Index (AQI)
Air pollution - CO
Air pollution - NO2
Air pollution - SO2
Air pollution - Ozone
Air pollution - PM10
Air pollution - PM25
Air pollution - Pb
Crime - Murders per 100,000 population
Crime - Rapes per 100,000 population
Crime - Robberies per 100,000 population
Crime - Assaults per 100,000 population
Crime - Burglaries per 100,000 population
Crime - Thefts per 100,000 population
Crime - Auto thefts per 100,000 population
Crime - Arson per 100,000 population
Crime - City-data.com crime index
Crime - Violent crime index
Crime - Property crime index
Crime - Murders per 100,000 population (5 year average)
Crime - Rapes per 100,000 population (5 year average)
Crime - Robberies per 100,000 population (5 year average)
Crime - Assaults per 100,000 population (5 year average)
Crime - Burglaries per 100,000 population (5 year average)
Crime - Thefts per 100,000 population (5 year average)
Crime - Auto thefts per 100,000 population (5 year average)
Crime - Arson per 100,000 population (5 year average)
Crime - City-data.com crime index (5 year average)
Crime - Violent crime index (5 year average)
Crime - Property crime index (5 year average)
1996 Presidential Elections Results (%) - Democratic Party (Clinton)
1996 Presidential Elections Results (%) - Republican Party (Dole)
1996 Presidential Elections Results (%) - Other
2000 Presidential Elections Results (%) - Democratic Party (Gore)
2000 Presidential Elections Results (%) - Republican Party (Bush)
2000 Presidential Elections Results (%) - Other
2004 Presidential Elections Results (%) - Democratic Party (Kerry)
2004 Presidential Elections Results (%) - Republican Party (Bush)
2004 Presidential Elections Results (%) - Other
2008 Presidential Elections Results (%) - Democratic Party (Obama)
2008 Presidential Elections Results (%) - Republican Party (McCain)
2008 Presidential Elections Results (%) - Other
2012 Presidential Elections Results (%) - Democratic Party (Obama)
2012 Presidential Elections Results (%) - Republican Party (Romney)
2012 Presidential Elections Results (%) - Other
2016 Presidential Elections Results (%) - Democratic Party (Clinton)
2016 Presidential Elections Results (%) - Republican Party (Trump)
2016 Presidential Elections Results (%) - Other
2020 Presidential Elections Results (%) - Democratic Party (Biden)
2020 Presidential Elections Results (%) - Republican Party (Trump)
2020 Presidential Elections Results (%) - Other
Ancestries Reported - Arab (%)
Ancestries Reported - Czech (%)
Ancestries Reported - Danish (%)
Ancestries Reported - Dutch (%)
Ancestries Reported - English (%)
Ancestries Reported - French (%)
Ancestries Reported - French Canadian (%)
Ancestries Reported - German (%)
Ancestries Reported - Greek (%)
Ancestries Reported - Hungarian (%)
Ancestries Reported - Irish (%)
Ancestries Reported - Italian (%)
Ancestries Reported - Lithuanian (%)
Ancestries Reported - Norwegian (%)
Ancestries Reported - Polish (%)
Ancestries Reported - Portuguese (%)
Ancestries Reported - Russian (%)
Ancestries Reported - Scotch-Irish (%)
Ancestries Reported - Scottish (%)
Ancestries Reported - Slovak (%)
Ancestries Reported - Subsaharan African (%)
Ancestries Reported - Swedish (%)
Ancestries Reported - Swiss (%)
Ancestries Reported - Ukrainian (%)
Ancestries Reported - United States (%)
Ancestries Reported - Welsh (%)
Ancestries Reported - West Indian (%)
Ancestries Reported - Other (%)
Educational Attainment - No schooling completed (%)
Educational Attainment - Less than high school (%)
Educational Attainment - High school or equivalent (%)
Educational Attainment - Less than 1 year of college (%)
Educational Attainment - 1 or more years of college (%)
Educational Attainment - Associate degree (%)
Educational Attainment - Bachelor's degree (%)
Educational Attainment - Master's degree (%)
Educational Attainment - Professional school degree (%)
Educational Attainment - Doctorate degree (%)
School Enrollment - Nursery, preschool (%)
School Enrollment - Kindergarten (%)
School Enrollment - Grade 1 to 4 (%)
School Enrollment - Grade 5 to 8 (%)
School Enrollment - Grade 9 to 12 (%)
School Enrollment - College undergrad (%)
School Enrollment - Graduate or professional (%)
School Enrollment - Not enrolled in school (%)
School enrollment - Public schools (%)
School enrollment - Private schools (%)
School enrollment - Not enrolled (%)
Median number of rooms in houses and condos
Median number of rooms in apartments
Housing units lacking complete plumbing facilities (%)
Housing units lacking complete kitchen facilities (%)
Density of houses
Urban houses (%)
Rural houses (%)
Households with people 60 years and over (%)
Households with people 65 years and over (%)
Households with people 75 years and over (%)
Households with one or more nonrelatives (%)
Households with no nonrelatives (%)
Population in households (%)
Family households (%)
Nonfamily households (%)
Population in families (%)
Family households with own children (%)
Median number of bedrooms in owner occupied houses
Mean number of bedrooms in owner occupied houses
Median number of bedrooms in renter occupied houses
Mean number of bedrooms in renter occupied houses
Median number of vehichles in owner occupied houses
Mean number of vehichles in owner occupied houses
Median number of vehichles in renter occupied houses
Mean number of vehichles in renter occupied houses
Mortgage status - with mortgage (%)
Mortgage status - with second mortgage (%)
Mortgage status - with home equity loan (%)
Mortgage status - with both second mortgage and home equity loan (%)
Mortgage status - without a mortgage (%)
Average family size
Average family size - White
Average family size - Black or African American
Average family size - Asian
Average family size - Hispanic or Latino
Average family size - American Indian and Alaska Native
Average family size - Multirace
Average family size - Other Race
Geographical mobility - Same house 1 year ago (%)
Geographical mobility - Moved within same county (%)
Geographical mobility - Moved from different county within same state (%)
Geographical mobility - Moved from different state (%)
Geographical mobility - Moved from abroad (%)
Place of birth - Born in state of residence (%)
Place of birth - Born in other state (%)
Place of birth - Native, outside of US (%)
Place of birth - Foreign born (%)
Housing units in structures - 1, detached (%)
Housing units in structures - 1, attached (%)
Housing units in structures - 2 (%)
Housing units in structures - 3 or 4 (%)
Housing units in structures - 5 to 9 (%)
Housing units in structures - 10 to 19 (%)
Housing units in structures - 20 to 49 (%)
Housing units in structures - 50 or more (%)
Housing units in structures - Mobile home (%)
Housing units in structures - Boat, RV, van, etc. (%)
House/condo owner moved in on average (years ago)
Renter moved in on average (years ago)
Year householder moved into unit - Moved in 1999 to March 2000 (%)
Year householder moved into unit - Moved in 1995 to 1998 (%)
Year householder moved into unit - Moved in 1990 to 1994 (%)
Year householder moved into unit - Moved in 1980 to 1989 (%)
Year householder moved into unit - Moved in 1970 to 1979 (%)
Year householder moved into unit - Moved in 1969 or earlier (%)
Means of transportation to work - Drove car alone (%)
Means of transportation to work - Carpooled (%)
Means of transportation to work - Public transportation (%)
Means of transportation to work - Bus or trolley bus (%)
Means of transportation to work - Streetcar or trolley car (%)
Means of transportation to work - Subway or elevated (%)
Means of transportation to work - Railroad (%)
Means of transportation to work - Ferryboat (%)
Means of transportation to work - Taxicab (%)
Means of transportation to work - Motorcycle (%)
Means of transportation to work - Bicycle (%)
Means of transportation to work - Walked (%)
Means of transportation to work - Other means (%)
Working at home (%)
Industry diversity
Most Common Industries - Agriculture, forestry, fishing and hunting, and mining (%)
Most Common Industries - Agriculture, forestry, fishing and hunting (%)
Most Common Industries - Mining, quarrying, and oil and gas extraction (%)
Most Common Industries - Construction (%)
Most Common Industries - Manufacturing (%)
Most Common Industries - Wholesale trade (%)
Most Common Industries - Retail trade (%)
Most Common Industries - Transportation and warehousing, and utilities (%)
Most Common Industries - Transportation and warehousing (%)
Most Common Industries - Utilities (%)
Most Common Industries - Information (%)
Most Common Industries - Finance and insurance, and real estate and rental and leasing (%)
Most Common Industries - Finance and insurance (%)
Most Common Industries - Real estate and rental and leasing (%)
Most Common Industries - Professional, scientific, and management, and administrative and waste management services (%)
Most Common Industries - Professional, scientific, and technical services (%)
Most Common Industries - Management of companies and enterprises (%)
Most Common Industries - Administrative and support and waste management services (%)
Most Common Industries - Educational services, and health care and social assistance (%)
Most Common Industries - Educational services (%)
Most Common Industries - Health care and social assistance (%)
Most Common Industries - Arts, entertainment, and recreation, and accommodation and food services (%)
Most Common Industries - Arts, entertainment, and recreation (%)
Most Common Industries - Accommodation and food services (%)
Most Common Industries - Other services, except public administration (%)
Most Common Industries - Public administration (%)
Occupation diversity
Most Common Occupations - Management, business, science, and arts occupations (%)
Most Common Occupations - Management, business, and financial occupations (%)
Most Common Occupations - Management occupations (%)
Most Common Occupations - Business and financial operations occupations (%)
Most Common Occupations - Computer, engineering, and science occupations (%)
Most Common Occupations - Computer and mathematical occupations (%)
Most Common Occupations - Architecture and engineering occupations (%)
Most Common Occupations - Life, physical, and social science occupations (%)
Most Common Occupations - Education, legal, community service, arts, and media occupations (%)
Most Common Occupations - Community and social service occupations (%)
Most Common Occupations - Legal occupations (%)
Most Common Occupations - Education, training, and library occupations (%)
Most Common Occupations - Arts, design, entertainment, sports, and media occupations (%)
Most Common Occupations - Healthcare practitioners and technical occupations (%)
Most Common Occupations - Health diagnosing and treating practitioners and other technical occupations (%)
Most Common Occupations - Health technologists and technicians (%)
Most Common Occupations - Service occupations (%)
Most Common Occupations - Healthcare support occupations (%)
Most Common Occupations - Protective service occupations (%)
Most Common Occupations - Fire fighting and prevention, and other protective service workers including supervisors (%)
Most Common Occupations - Law enforcement workers including supervisors (%)
Most Common Occupations - Food preparation and serving related occupations (%)
Most Common Occupations - Building and grounds cleaning and maintenance occupations (%)
Most Common Occupations - Personal care and service occupations (%)
Most Common Occupations - Sales and office occupations (%)
Most Common Occupations - Sales and related occupations (%)
Most Common Occupations - Office and administrative support occupations (%)
Most Common Occupations - Natural resources, construction, and maintenance occupations (%)
Most Common Occupations - Farming, fishing, and forestry occupations (%)
Most Common Occupations - Construction and extraction occupations (%)
Most Common Occupations - Installation, maintenance, and repair occupations (%)
Most Common Occupations - Production, transportation, and material moving occupations (%)
Most Common Occupations - Production occupations (%)
Most Common Occupations - Transportation occupations (%)
Most Common Occupations - Material moving occupations (%)
People in Group quarters - Institutionalized population (%)
People in Group quarters - Correctional institutions (%)
People in Group quarters - Federal prisons and detention centers (%)
People in Group quarters - Halfway houses (%)
People in Group quarters - Local jails and other confinement facilities (including police lockups) (%)
People in Group quarters - Military disciplinary barracks (%)
People in Group quarters - State prisons (%)
People in Group quarters - Other types of correctional institutions (%)
People in Group quarters - Nursing homes (%)
People in Group quarters - Hospitals/wards, hospices, and schools for the handicapped (%)
People in Group quarters - Hospitals/wards and hospices for chronically ill (%)
People in Group quarters - Hospices or homes for chronically ill (%)
People in Group quarters - Military hospitals or wards for chronically ill (%)
People in Group quarters - Other hospitals or wards for chronically ill (%)
People in Group quarters - Hospitals or wards for drug/alcohol abuse (%)
People in Group quarters - Mental (Psychiatric) hospitals or wards (%)
People in Group quarters - Schools, hospitals, or wards for the mentally retarded (%)
People in Group quarters - Schools, hospitals, or wards for the physically handicapped (%)
People in Group quarters - Institutions for the deaf (%)
People in Group quarters - Institutions for the blind (%)
People in Group quarters - Orthopedic wards and institutions for the physically handicapped (%)
People in Group quarters - Wards in general hospitals for patients who have no usual home elsewhere (%)
People in Group quarters - Wards in military hospitals for patients who have no usual home elsewhere (%)
People in Group quarters - Juvenile institutions (%)
People in Group quarters - Long-term care (%)
People in Group quarters - Homes for abused, dependent, and neglected children (%)
People in Group quarters - Residential treatment centers for emotionally disturbed children (%)
People in Group quarters - Training schools for juvenile delinquents (%)
People in Group quarters - Short-term care, detention or diagnostic centers for delinquent children (%)
People in Group quarters - Type of juvenile institution unknown (%)
People in Group quarters - Noninstitutionalized population (%)
People in Group quarters - College dormitories (includes college quarters off campus) (%)
People in Group quarters - Military quarters (%)
People in Group quarters - On base (%)
People in Group quarters - Barracks, unaccompanied personnel housing (UPH), (Enlisted/Officer), ;and similar group living quarters for military personnel (%)
People in Group quarters - Transient quarters for temporary residents (%)
People in Group quarters - Military ships (%)
People in Group quarters - Group homes (%)
People in Group quarters - Homes or halfway houses for drug/alcohol abuse (%)
People in Group quarters - Homes for the mentally ill (%)
People in Group quarters - Homes for the mentally retarded (%)
People in Group quarters - Homes for the physically handicapped (%)
People in Group quarters - Other group homes (%)
People in Group quarters - Religious group quarters (%)
People in Group quarters - Dormitories (%)
People in Group quarters - Agriculture workers' dormitories on farms (%)
People in Group quarters - Job Corps and vocational training facilities (%)
People in Group quarters - Other workers' dormitories (%)
People in Group quarters - Crews of maritime vessels (%)
People in Group quarters - Other nonhousehold living situations (%)
People in Group quarters - Other noninstitutional group quarters (%)
Residents speaking English at home (%)
Residents speaking English at home - Born in the United States (%)
Residents speaking English at home - Native, born elsewhere (%)
Residents speaking English at home - Foreign born (%)
Residents speaking Spanish at home (%)
Residents speaking Spanish at home - Born in the United States (%)
Residents speaking Spanish at home - Native, born elsewhere (%)
Residents speaking Spanish at home - Foreign born (%)
Residents speaking other language at home (%)
Residents speaking other language at home - Born in the United States (%)
Residents speaking other language at home - Native, born elsewhere (%)
Residents speaking other language at home - Foreign born (%)
Class of Workers - Employee of private company (%)
Class of Workers - Self-employed in own incorporated business (%)
Class of Workers - Private not-for-profit wage and salary workers (%)
Class of Workers - Local government workers (%)
Class of Workers - State government workers (%)
Class of Workers - Federal government workers (%)
Class of Workers - Self-employed workers in own not incorporated business and Unpaid family workers (%)
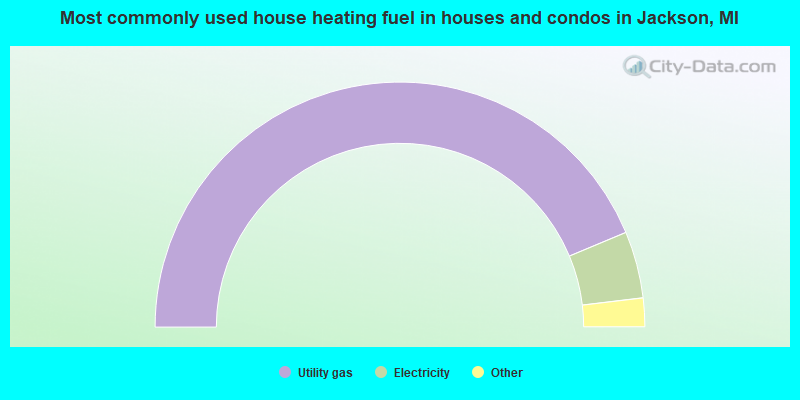
House heating fuel used in houses and condos - Utility gas (%)
House heating fuel used in houses and condos - Bottled, tank, or LP gas (%)
House heating fuel used in houses and condos - Electricity (%)
House heating fuel used in houses and condos - Fuel oil, kerosene, etc. (%)
House heating fuel used in houses and condos - Coal or coke (%)
House heating fuel used in houses and condos - Wood (%)
House heating fuel used in houses and condos - Solar energy (%)
House heating fuel used in houses and condos - Other fuel (%)
House heating fuel used in houses and condos - No fuel used (%)
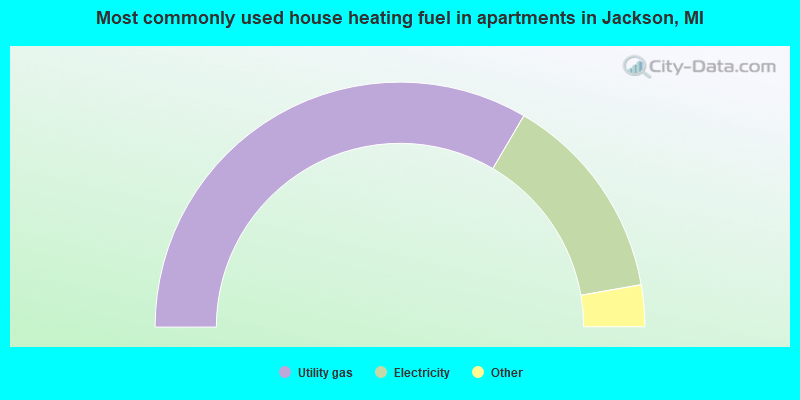
House heating fuel used in apartments - Utility gas (%)
House heating fuel used in apartments - Bottled, tank, or LP gas (%)
House heating fuel used in apartments - Electricity (%)
House heating fuel used in apartments - Fuel oil, kerosene, etc. (%)
House heating fuel used in apartments - Coal or coke (%)
House heating fuel used in apartments - Wood (%)
House heating fuel used in apartments - Solar energy (%)
House heating fuel used in apartments - Other fuel (%)
House heating fuel used in apartments - No fuel used (%)
Armed forces status - In Armed Forces (%)
Armed forces status - Civilian (%)
Armed forces status - Civilian - Veteran (%)
Armed forces status - Civilian - Nonveteran (%)
Fatal accidents locations in years 2005-2021
Fatal accidents locations in 2005
Fatal accidents locations in 2006
Fatal accidents locations in 2007
Fatal accidents locations in 2008
Fatal accidents locations in 2009
Fatal accidents locations in 2010
Fatal accidents locations in 2011
Fatal accidents locations in 2012
Fatal accidents locations in 2013
Fatal accidents locations in 2014
Fatal accidents locations in 2015
Fatal accidents locations in 2016
Fatal accidents locations in 2017
Fatal accidents locations in 2018
Fatal accidents locations in 2019
Fatal accidents locations in 2020
Fatal accidents locations in 2021
Alcohol use - People drinking some alcohol every month (%)
Alcohol use - People not drinking at all (%)
Alcohol use - Average days/month drinking alcohol
Alcohol use - Average drinks/week
Alcohol use - Average days/year people drink much
Audiometry - Average condition of hearing (%)
Audiometry - People that can hear a whisper from across a quiet room (%)
Audiometry - People that can hear normal voice from across a quiet room (%)
Audiometry - Ears ringing, roaring, buzzing (%)
Audiometry - Had a job exposure to loud noise (%)
Audiometry - Had off-work exposure to loud noise (%)
Blood Pressure & Cholesterol - Has high blood pressure (%)
Blood Pressure & Cholesterol - Checking blood pressure at home (%)
Blood Pressure & Cholesterol - Frequently checking blood cholesterol (%)
Blood Pressure & Cholesterol - Has high cholesterol level (%)
Consumer Behavior - Money monthly spent on food at supermarket/grocery store
Consumer Behavior - Money monthly spent on food at other stores
Consumer Behavior - Money monthly spent on eating out
Consumer Behavior - Money monthly spent on carryout/delivered foods
Consumer Behavior - Income spent on food at supermarket/grocery store (%)
Consumer Behavior - Income spent on food at other stores (%)
Consumer Behavior - Income spent on eating out (%)
Consumer Behavior - Income spent on carryout/delivered foods (%)
Current Health Status - General health condition (%)
Current Health Status - Blood donors (%)
Current Health Status - Has blood ever tested for HIV virus (%)
Current Health Status - Left-handed people (%)
Dermatology - People using sunscreen (%)
Diabetes - Diabetics (%)
Diabetes - Had a blood test for high blood sugar (%)
Diabetes - People taking insulin (%)
Diet Behavior & Nutrition - Diet health (%)
Diet Behavior & Nutrition - Milk product consumption (# of products/month)
Diet Behavior & Nutrition - Meals not home prepared (#/week)
Diet Behavior & Nutrition - Meals from fast food or pizza place (#/week)
Diet Behavior & Nutrition - Ready-to-eat foods (#/month)
Diet Behavior & Nutrition - Frozen meals/pizza (#/month)
Drug Use - People that ever used marijuana or hashish (%)
Drug Use - Ever used hard drugs (%)
Drug Use - Ever used any form of cocaine (%)
Drug Use - Ever used heroin (%)
Drug Use - Ever used methamphetamine (%)
Health Insurance - People covered by health insurance (%)
Kidney Conditions-Urology - Avg. # of times urinating at night
Medical Conditions - People with asthma (%)
Medical Conditions - People with anemia (%)
Medical Conditions - People with psoriasis (%)
Medical Conditions - People with overweight (%)
Medical Conditions - Elderly people having difficulties in thinking or remembering (%)
Medical Conditions - People who ever received blood transfusion (%)
Medical Conditions - People having trouble seeing even with glass/contacts (%)
Medical Conditions - People with arthritis (%)
Medical Conditions - People with gout (%)
Medical Conditions - People with congestive heart failure (%)
Medical Conditions - People with coronary heart disease (%)
Medical Conditions - People with angina pectoris (%)
Medical Conditions - People who ever had heart attack (%)
Medical Conditions - People who ever had stroke (%)
Medical Conditions - People with emphysema (%)
Medical Conditions - People with thyroid problem (%)
Medical Conditions - People with chronic bronchitis (%)
Medical Conditions - People with any liver condition (%)
Medical Conditions - People who ever had cancer or malignancy (%)
Mental Health - People who have little interest in doing things (%)
Mental Health - People feeling down, depressed, or hopeless (%)
Mental Health - People who have trouble sleeping or sleeping too much (%)
Mental Health - People feeling tired or having little energy (%)
Mental Health - People with poor appetite or overeating (%)
Mental Health - People feeling bad about themself (%)
Mental Health - People who have trouble concentrating on things (%)
Mental Health - People moving or speaking slowly or too fast (%)
Mental Health - People having thoughts they would be better off dead (%)
Oral Health - Average years since last visit a dentist
Oral Health - People embarrassed because of mouth (%)
Oral Health - People with gum disease (%)
Oral Health - General health of teeth and gums (%)
Oral Health - Average days a week using dental floss/device
Oral Health - Average days a week using mouthwash for dental problem
Oral Health - Average number of teeth
Pesticide Use - Households using pesticides to control insects (%)
Pesticide Use - Households using pesticides to kill weeds (%)
Physical Activity - People doing vigorous-intensity work activities (%)
Physical Activity - People doing moderate-intensity work activities (%)
Physical Activity - People walking or bicycling (%)
Physical Activity - People doing vigorous-intensity recreational activities (%)
Physical Activity - People doing moderate-intensity recreational activities (%)
Physical Activity - Average hours a day doing sedentary activities
Physical Activity - Average hours a day watching TV or videos
Physical Activity - Average hours a day using computer
Physical Functioning - People having limitations keeping them from working (%)
Physical Functioning - People limited in amount of work they can do (%)
Physical Functioning - People that need special equipment to walk (%)
Physical Functioning - People experiencing confusion/memory problems (%)
Physical Functioning - People requiring special healthcare equipment (%)
Prescription Medications - Average number of prescription medicines taking
Preventive Aspirin Use - Adults 40+ taking low-dose aspirin (%)
Reproductive Health - Vaginal deliveries (%)
Reproductive Health - Cesarean deliveries (%)
Reproductive Health - Deliveries resulted in a live birth (%)
Reproductive Health - Pregnancies resulted in a delivery (%)
Reproductive Health - Women breastfeeding newborns (%)
Reproductive Health - Women that had a hysterectomy (%)
Reproductive Health - Women that had both ovaries removed (%)
Reproductive Health - Women that have ever taken birth control pills (%)
Reproductive Health - Women taking birth control pills (%)
Reproductive Health - Women that have ever used Depo-Provera or injectables (%)
Reproductive Health - Women that have ever used female hormones (%)
Sexual Behavior - People 18+ that ever had sex (vaginal, anal, or oral) (%)
Sexual Behavior - Males 18+ that ever had vaginal sex with a woman (%)
Sexual Behavior - Males 18+ that ever performed oral sex on a woman (%)
Sexual Behavior - Males 18+ that ever had anal sex with a woman (%)
Sexual Behavior - Males 18+ that ever had any sex with a man (%)
Sexual Behavior - Females 18+ that ever had vaginal sex with a man (%)
Sexual Behavior - Females 18+ that ever performed oral sex on a man (%)
Sexual Behavior - Females 18+ that ever had anal sex with a man (%)
Sexual Behavior - Females 18+ that ever had any kind of sex with a woman (%)
Sexual Behavior - Average age people first had sex
Sexual Behavior - Average number of female sex partners in lifetime (males 18+)
Sexual Behavior - Average number of female vaginal sex partners in lifetime (males 18+)
Sexual Behavior - Average age people first performed oral sex on a woman (18+)
Sexual Behavior - Average number of woman performed oral sex on in lifetime (18+)
Sexual Behavior - Average number of male sex partners in lifetime (males 18+)
Sexual Behavior - Average number of male anal sex partners in lifetime (males 18+)
Sexual Behavior - Average age people first performed oral sex on a man (18+)
Sexual Behavior - Average number of male oral sex partners in lifetime (18+)
Sexual Behavior - People using protection when performing oral sex (%)
Sexual Behavior - Average number of times people have vaginal or anal sex a year
Sexual Behavior - People having sex without condom (%)
Sexual Behavior - Average number of male sex partners in lifetime (females 18+)
Sexual Behavior - Average number of male vaginal sex partners in lifetime (females 18+)
Sexual Behavior - Average number of female sex partners in lifetime (females 18+)
Sexual Behavior - Circumcised males 18+ (%)
Sleep Disorders - Average hours sleeping at night
Sleep Disorders - People that has trouble sleeping (%)
Smoking-Cigarette Use - People smoking cigarettes (%)
Taste & Smell - People 40+ having problems with smell (%)
Taste & Smell - People 40+ having problems with taste (%)
Taste & Smell - People 40+ that ever had wisdom teeth removed (%)
Taste & Smell - People 40+ that ever had tonsils teeth removed (%)
Taste & Smell - People 40+ that ever had a loss of consciousness because of a head injury (%)
Taste & Smell - People 40+ that ever had a broken nose or other serious injury to face or skull (%)
Taste & Smell - People 40+ that ever had two or more sinus infections (%)
Weight - Average height (inches)
Weight - Average weight (pounds)
Weight - Average BMI
Weight - People that are obese (%)
Weight - People that ever were obese (%)
Weight - People trying to lose weight (%)
Officers per 1,000 residents here:
1.33Michigan average:
1.86
Latest news from Jackson, MI collected exclusively by city-data.com from local newspapers, TV, and radio stations
Ancestries: English (18.6%), German (6.9%), American (6.7%), Irish (6.4%), Polish (3.2%), Italian (2.0%).
Current Local Time:
Land area: 11.1 square miles.
Population density: 2,798 people per square mile (average).
559 residents are foreign born
This city:
1.8%Michigan:
6.9%
Median real estate property taxes paid for housing units with mortgages in 2022: $1,779 (1.8%)Median real estate property taxes paid for housing units with no mortgage in 2022: $1,283 (1.6%)
Nearest city with pop. 50,000+: Lansing, MI
Nearest city with pop. 200,000+: Toledo, OH
Nearest city with pop. 1,000,000+: Chicago, IL
Nearest cities:
Latitude: 42.24 N, Longitude: 84.41 W
Nickname or alias (official or unofficial): Birthplace of the Republican Party
Daytime population change due to commuting: +11,149 (+35.6%)Workers who live and work in this city: 7,310 (55.2%)
Single-family new house construction building permits:
2022: 2 buildings , average cost: $147,2002021: 2 buildings , average cost: $250,0002020: 1 building , cost: $163,5002019: 1 building , cost: $62,1002017: 1 building , cost: $96,6002016: 1 building , cost: $191,0002014: 1 building , cost: $241,3002012: 3 buildings , average cost: $60,0002011: 2 buildings , average cost: $60,0002010: 2 buildings , average cost: $187,7002009: 2 buildings , average cost: $71,5002008: 3 buildings , average cost: $56,0002007: 6 buildings , average cost: $61,7002006: 14 buildings , average cost: $99,4002005: 28 buildings , average cost: $72,8002004: 11 buildings , average cost: $81,6002003: 15 buildings , average cost: $89,7002002: 9 buildings , average cost: $77,1002001: 20 buildings , average cost: $81,6002000: 12 buildings , average cost: $120,0001999: 18 buildings , average cost: $108,4001998: 19 buildings , average cost: $106,7001997: 10 buildings , average cost: $49,700Unemployment in December 2023:
Most common occupations in Jackson, MI (%)
Both Males Females
Other production occupations, including supervisors (6.6%)
Metal workers and plastic workers (6.1%)
Building and grounds cleaning and maintenance occupations (4.8%)
Other management occupations, except farmers and farm managers (3.5%)
Other office and administrative support workers, including supervisors (3.4%)
Assemblers and fabricators (3.2%)
Retail sales workers, except cashiers (3.1%)
Metal workers and plastic workers (10.4%)
Other production occupations, including supervisors (8.5%)
Building and grounds cleaning and maintenance occupations (5.7%)
Driver/sales workers and truck drivers (4.6%)
Electrical equipment mechanics and other installation, maintenance, and repair workers, including supervisors (4.2%)
Assemblers and fabricators (3.8%)
Other management occupations, except farmers and farm managers (3.6%)
Other office and administrative support workers, including supervisors (6.1%)
Other production occupations, including supervisors (4.7%)
Waiters and waitresses (4.1%)
Nursing, psychiatric, and home health aides (4.0%)
Secretaries and administrative assistants (3.9%)
Building and grounds cleaning and maintenance occupations (3.8%)
Information and record clerks, except customer service representatives (3.5%)
Tornado activity:
Jackson-area historical tornado activity is above Michigan state average. It is 73% greater than the overall U.S. average.
On 4/2/1977, a category F4 (max. wind speeds 207-260 mph) tornado 25.4 miles away from the Jackson city center killed one person and injured 44 people and caused between $500,000 and $5,000,000 in damages.
On 6/15/1982, a category F3 (max. wind speeds 158-206 mph) tornado 7.6 miles away from the city center killed one person and injured one person and caused between $500,000 and $5,000,000 in damages.
Earthquake activity:
Jackson-area historical earthquake activity is significantly above Michigan state average. It is 31% smaller than the overall U.S. average. On 1/31/1986 at 16:46:43, a magnitude 5.0 (5.0 MB, Class: Moderate, Intensity: VI - VII) earthquake occurred 172.9 miles away from the city center On 9/25/1998 at 19:52:52, a magnitude 5.2 (4.8 MB, 4.3 MS, 5.2 LG, 4.5 MW, Depth: 3.1 mi) earthquake occurred 213.1 miles away from the city center On 5/2/2015 at 16:23:07, a magnitude 4.2 (4.2 MW, Depth: 2.8 mi, Class: Light, Intensity: IV - V) earthquake occurred 52.3 miles away from the city center On 7/12/1986 at 08:19:37, a magnitude 4.5 (4.5 MB) earthquake occurred 118.1 miles away from the city center On 7/27/1980 at 18:52:21, a magnitude 5.2 (5.1 MB, 4.7 MS, 5.0 UK, 5.2 UK) earthquake occurred 280.4 miles away from the city center On 4/18/2008 at 09:36:59, a magnitude 5.4 (5.1 MB, 4.8 MS, 5.4 MW, 5.2 MW) earthquake occurred 320.0 miles away from the city center Magnitude types: regional Lg-wave magnitude (LG), body-wave magnitude (MB), surface-wave magnitude (MS), moment magnitude (MW) Natural disasters: The number of natural disasters in Jackson County (9) is smaller than the US average (15).Major Disasters (Presidential) Declared: 4Emergencies Declared: 4Storms: 4, Floods: 3, Tornadoes: 2, Winter Storms: 2, Blizzard: 1, Freeze: 1, Hurricane: 1, Snowstorm: 1, Other: 1 (Note: some incidents may be assigned to more than one category). Main business address for: CMS ENERGY CORP ELECTRIC & OTHER SERVICES COMBINED ), CONSUMERS FUNDING LLC ASSET-BACKED SECURITIES ), SPARTON CORP MOTOR VEHICLE PARTS & ACCESSORIES ).
Hospitals in Jackson: ALLEGIANCE HEALTH (Voluntary non-profit - Other, 205 N EAST AVE) CARELINK OF JACKSON, A COMMUNITY-OWNED SPECIALTY H (110 N ELM AVENUE) HOSPICE OF JACKSON AND OAKLAWN (1 JACKSON SQUARE, SUITE 400) SOUTHERN CARE - JACKSON/ ANN ARBOR (437 FERN AVENUE, SUITE B) Nursing Homes in Jackson: CENTER FOR TRANSITIONAL REHAB (205 N EAST AVENUE) COUNTRYSIDE CARE CENTER (2121 ROBINSON RD) FAITH HAVEN SENIOR CARE CENTRE (6531 W MICHIGAN AVENUE) HEARTLAND HEALTH CARE CENTER-JACKSON (434 W NORTH ST) JACKSON COUNTY MEDICAL CARE FACILITY (524 LANSING AVE) RIDGECREST HEALTH CAMPUS (703 ROBINSON RD) VISTA GRANDE VILLA (2251 SPRINGPORT RD) Dialysis Facilities in Jackson: DSI SE JACKSON DIALYSIS (200 SOUTH EAST AVE) FRESENIUS MEDICAL CARE - JACKSON OAKS (128 N ELM AVE) JACKSON DIALYSIS OF DAVITA (234 W LOUIS GLICK HWY STE 200) Home Health Centers in Jackson: ALLEGIANCE HOME CARE (ONE JACKSON SQUARE, SUITE 400) EVERGREEN HOME CARE, L L C (2545 SPRING ARBOR) GANTON HOME CARE (3600 SPRING ARBOR RD) GREAT LAKES HOME HEALTH (900 COOPER STREET) HOME HEALTH SERVICE OF JACKSON (111 3RD ST) Amtrak station: JACKSON (501 E. MICHIGAN AVE.)
.
Services: ticket office, fully wheelchair accessible, enclosed waiting area, public restrooms, public payphones, free short-term parking, paid long-term parking, call for taxi service, public transit connection.
Colleges/Universities in Jackson: Jackson College Full-time enrollment: 4,258; Location: 2111 Emmons Rd; Public; Website: www.jccmi.edu)
Baker College of Jackson Full-time enrollment: 1,714; Location: 2800 Springport Rd; Private, not-for-profit; Website: www.baker.edu)
Career Quest Learning Centers-Jackson Full-time enrollment: 327; Location: 209 E Washington Ave, Ste 241; Private, for-profit; Website: www.cqlc.edu)
Other colleges/universities with over 2000 students near Jackson:
Spring Arbor University (about 8 miles; Spring Arbor, MI ; Full-time enrollment: 3,374)
Siena Heights University (about 31 miles; Adrian, MI ; FT enrollment: 2,009)
Michigan State University (about 34 miles; East Lansing, MI ; FT enrollment: 41,736)
University of Michigan-Ann Arbor (about 35 miles; Ann Arbor, MI ; FT enrollment: 39,547)
Lansing Community College (about 36 miles; Lansing, MI ; FT enrollment: 12,822)
Washtenaw Community College (about 39 miles; Ann Arbor, MI ; FT enrollment: 8,452)
Kellogg Community College (about 40 miles; Battle Creek, MI ; FT enrollment: 4,078)
Biggest public high schools in Jackson: JACKSON HIGH SCHOOL Students: 1,809, Location: 544 WILDWOOD AVE, Grades: 9-12)NORTHWEST HIGH SCHOOL Students: 1,084, Location: 4200 VAN HORN RD, Grades: 9-12)VANDERCOOK LAKE HIGH SCHOOL Students: 730, Location: 1000 EAST GOLF AVE, Grades: 6-12)EAST JACKSON HIGH SCHOOL Students: 513, Location: 1566 NORTH SUTTON RD, Grades: 9-12)WOODVILLE COMMUNITY CENTER Students: 164, Location: 3950 CATHERINE ST, Grades: PK-12)TA WILSON SCHOOL Students: 149, Location: 310 WEST MORRELL ST, Grades: 6-12)NORTHWEST ALTERNATIVE HIGH SCHOOL Students: 71, Location: 6900 RIVES JUNCTION RD, Grades: 7-12)DA VINCI INSTITUTE (9-12) Students: 50, Location: 2255 EMMONS RD, Grades: 9-12, Charter school )YOUTH HOME- JACKSON ISD Students: 11, Location: 930 FLEMING AVE, Grades: 3-12)LYLE A. TORRANT CENTER Students: 4, Location: 1175 WEST PARNALL RD, Grades: PK-12)Private high schools in Jackson: LUMEN CHRISTI CATHOLIC HIGH SCHOOL Students: 471, Location: 3483 SPRING ARBOR RD, Grades: 9-12)
JACKSON CHRISTIAN MIDDLE/HIGH SCHOOL Students: 214, Location: 4200 LOWE RD, Grades: 6-12)
Biggest public elementary/middle schools in Jackson: MIDDLE SCHOOL AT PARKSIDE Students: 867, Location: 2400 4TH ST, Grades: 6-8)FROST ELEMENTARY SCHOOL Students: 755, Location: 1226 SOUTH WISNER ST, Grades: KG-5)PARAGON CHARTER ACADEMY Students: 667, Location: 3750 MCCAIN RD, Grades: KG-8, Charter school )NORTHEAST ELEMENTARY SCHOOL Students: 652, Location: 1024 FLEMING AVE, Grades: KG-5)TOWNSEND ELEMENTARY SCHOOL Students: 593, Location: 1005 FLOYD AVE, Grades: PK-5)HUNT ELEMENTARY SCHOOL Students: 513, Location: 1143 NORTH BROWN ST, Grades: KG-5)NORTHWEST ELEMENTARY SCHOOL Students: 453, Location: 3757 LANSING AVE, Grades: 3-5)PARNALL ELEMENTARY SCHOOL Students: 437, Location: 3737 LANSING AVE, Grades: PK-2)BENNETT SCHOOL Students: 410, Location: 820 BENNETT ST, Grades: KG-5)DIBBLE ELEMENTARY SCHOOL Students: 394, Location: 3450 KIBBY RD, Grades: KG-5)Private elementary/middle schools in Jackson: QUEEN OF THE MIRACULOUS MEDAL SCHOOL Students: 308, Location: 811 S WISNER ST, Grades: KG-6)
ST JOHN ELEMENTARY SCHOOL Students: 239, Location: 405 E NORTH ST, Grades: PK-6)
JACKSON CATHOLIC MIDDLE SCHOOL Students: 186, Location: 915 COOPER ST, Grades: 7-8)
ST MARY STAR OF THE SEA SCHOOL Students: 178, Location: 116 E WESLEY ST, Grades: PK-6)
TRINITY LUTHERAN SCHOOL Students: 92, Location: 4900 MCCAIN RD, Grades: PK-8)
See full list of schools located in Jackson Library in Jackson: JACKSON DISTRICT LIBRARY Operating income: $4,813,018; Location: 244 WEST MICHIGAN AVENUE; 428,003 books ; 10 e-books ; 28,671 audio materials ; 19,477 video materials ; 24 local licensed databases ; 1 other licensed databases ; 769 print serial subscriptions )
User-submitted facts and corrections:
Under: Other hospitals and medical centers - include University of Michigan Hospital, and St. Joseph Hospital.
Notable locations in Jackson: (A) , Jackson Harness Raceway (B) , Jackson Station (C) , Jackson County Fairgrounds (D) , Withington Stadium (E) , Jackson District Library-Carnegia Branch (F) , Jackson Fire Department Station 1 Headquarters (G) , Peter F Hurst Planetarium (H) , Ella Sharp Museum (I) , Jackson City Hall (J) , Jackson Police Department (K) , Jackson Fire Department Station 2 (L) , Jackson Fire Department Station 3 (M) , Jackson Community Ambulance (N) . Display/hide their locations on the map
Shopping Center: (1) . Display/hide its location on the map
Main business address in Jackson include: (A) , CONSUMERS FUNDING LLC (B) . Display/hide their locations on the map
Churches in Jackson include: (A) , Trinity United Methodist Church (B) , Berean Bible Baptist Church (C) , Church of God (D) , Greater Philadelphia Church (E) , Second Missionary Baptist Church (F) , First Evangelistic Church of God in Christ (G) , United Peoples Church (H) , Summit Seventh Day Adventist Church (I) . Display/hide their locations on the map
Cemeteries: (1) , Temple Beth Israel Cemetery (2) , East Main Street Cemetery (3) . Display/hide their locations on the map
Parks in Jackson include: (1) , Wellworth Park (2) , Austin Blair Historical Marker (3) , Ella Sharp Museum Historical Marker (4) , First Baptist Church Historical Marker (5) , First Congregational Church Historical Marker (6) , First State Prison Historical Marker (7) , Horace Ismon Historical Marker (8) , Ismon Building Historical Marker (9) . Display/hide their locations on the map
Tourist attractions:
Hotels:
Birthplace of: Arthur J Collingsworth - Diplomat, Dave Hill (golfer) - Professional golfer, Potter Stewart - (1915-1985), Supreme Court justice, James Leroy Bondsteel - Army Medal of Honor recipient, Brian VanGorder - Football coach, Gene Markey - Film producer, Charles W. Misner - Physicist, Greg Barton - Olympic canoeist, Cliff Sparks - Football player, Clyde L. Herring - Politician.
Jackson County has a predicted average indoor radon screening level greater than 4 pCi/L (pico curies per liter) - Highest Potential Drinking water stations with addresses in Jackson and their reported violations in the past:
MDOT - GRASS LAKE, R818 (Population served: 2,014, Groundwater):
Past health violations:
MCL, Monthly (TCR) - In OCT-2005, Contaminant: Coliform. Follow-up actions: St Compliance achieved (JAN-16-2007)
Past monitoring violations:
One routine major monitoring violation
Population served: 1,000, Groundwater):
Past health violations:
MCL, Monthly (TCR) - In FEB-2014, Contaminant: Coliform. Follow-up actions: St Public Notif issued (FEB-07-2014), St Violation/Reminder Notice (FEB-07-2014), St Public Notif requested (FEB-07-2014), St Compliance achieved (MAR-17-2014)
MCL, Monthly (TCR) - In JUL-2013, Contaminant: Coliform. Follow-up actions: St Public Notif requested (AUG-05-2013), St Violation/Reminder Notice (AUG-05-2013), St Public Notif issued (AUG-05-2013), St Tech Assistance Visit (AUG-09-2013), St Compliance achieved (SEP-05-2013)
MCL, Monthly (TCR) - In JUL-2009, Contaminant: Coliform. Follow-up actions: St Public Notif requested (JUL-30-2009), St Violation/Reminder Notice (JUL-30-2009), St Public Notif issued (JUL-30-2009), St Public Notif received (AUG-03-2009), St Compliance achieved (SEP-17-2009)
Population served: 700, Groundwater):
Past monitoring violations:
One routine major monitoring violation
One regular monitoring violation
Population served: 500, Groundwater):
Past health violations:
MCL, Monthly (TCR) - In JUL-2013, Contaminant: Coliform. Follow-up actions: St Public Notif issued (JUL-31-2013), St Public Notif received (AUG-02-2013), St Compliance achieved (AUG-09-2013)
Population served: 500, Groundwater):
Past monitoring violations:
2 routine major monitoring violations
Population served: 450, Groundwater):
Past monitoring violations:
3 routine major monitoring violations
4 regular monitoring violations
Population served: 250, Groundwater):
Past health violations:
MCL, Monthly (TCR) - In JUL-2009, Contaminant: Coliform. Follow-up actions: St Public Notif received (JUL-31-2009), St Public Notif issued (JUL-31-2009), St Compliance achieved (AUG-04-2009)
Past monitoring violations:
3 routine major monitoring violations
One regular monitoring violation
Population served: 250, Groundwater):
Past monitoring violations:
One regular monitoring violation
Drinking water stations with addresses in Jackson that have no violations reported:
BLACKMAN TOWNSHIP (Address: 1990 West Parnall Road Population served: 9,012, Primary Water Source Type: Purch groundwater under infl of surface water)
MDOT - SANDSTONE, R819 (Population served: 2,000, Primary Water Source Type: Groundwater)
MDOT - BERRY, R820 (Population served: 880, Primary Water Source Type: Groundwater)
YMCA - MALACHI (Population served: 400, Primary Water Source Type: Groundwater)
JACKSON FIRST CHURCH OF NAZARENE (Population served: 300, Primary Water Source Type: Groundwater)
PLEASANT LAKE CAMPGROUND #2 (Population served: 300, Primary Water Source Type: Groundwater)
SWAINS LAKE COUNTY PARK (Population served: 200, Primary Water Source Type: Groundwater)
HICKORY HILLS GOLF CLUB (Population served: 200, Primary Water Source Type: Groundwater)
PIZZA HOT LINE (Population served: 150, Primary Water Source Type: Groundwater)
YMCA-PATHFINDER (Population served: 100, Primary Water Source Type: Groundwater)
Average household size: This city:
2.5 peopleMichigan:
2.5 people
Percentage of family households: This city:
59.2%Whole state:
66.0%
Percentage of households with unmarried partners: This city:
9.8%Whole state:
6.4%
Likely homosexual households (counted as self-reported same-sex unmarried-partner households)
Lesbian couples: 0.4% of all households Gay men: 0.2% of all households
People in group quarters in Jackson in 2010:
263 people in nursing facilities/skilled-nursing facilities
178 people in local jails and other municipal confinement facilities
130 people in college/university student housing
105 people in group homes intended for adults
42 people in emergency and transitional shelters (with sleeping facilities) for people experiencing homelessness
28 people in other noninstitutional facilities
27 people in correctional facilities intended for juveniles
People in group quarters in Jackson in 2000:
327 people in nursing homes
213 people in other noninstitutional group quarters
206 people in local jails and other confinement facilities (including police lockups)
155 people in college dormitories (includes college quarters off campus)
53 people in other group homes
46 people in homes for the mentally retarded
42 people in unknown juvenile institutions
25 people in homes for the mentally ill
21 people in mental (psychiatric) hospitals or wards
7 people in religious group quarters
6 people in other nonhousehold living situations
3 people in orthopedic wards and institutions for the physically handicapped
Banks with branches in Jackson (2011 data):
Comerica Bank: East Jackson Branch, South Jackson Branch, Auto Bank Branch, Westwood Mall Branch, Airport Road Branch, Jackson Main Banking Center. Info updated 2011/07/29: Bank assets: $60,970.5 mil, Deposits: $48,300.9 mil, headquarters in Dallas, TX, positive income , Commercial Lending Specialization, 497 total offices , Holding Company: Comerica Incorporated
Citizens Bank: One Jackson Square Branch, West Point Branch, East Michigan Branch, Vandercook Branch, North Street Branch, Fourth Street Branch. Info updated 2011/08/01: Bank assets: $9,212.3 mil, Deposits: $7,452.0 mil, headquarters in Flint, MI, positive income , Commercial Lending Specialization, 220 total offices , Holding Company: Citizens Republic Bancorp, Inc.
Flagstar Bank, FSB: North West Avenue Branch, Horton Road Branch, Flagstar Centre Branch, 704 S. Brown St. Branch, East Michigan Branch. Info updated 2011/07/21: Bank assets: $13,623.5 mil, Deposits: $7,802.8 mil, headquarters in Troy, MI, negative income in the last year , Mortgage Lending Specialization, 135 total offices
Hillsdale County National Bank: Jackson Branch, Horton Rd. Branch, North Wisner Branch. Info updated 2006/11/03: Bank assets: $382.5 mil, Deposits: $324.7 mil, headquarters in Hillsdale, MI, positive income , Commercial Lending Specialization, 13 total offices , Holding Company: Cnb Community Bancorp, Inc.
Fifth Third Bank: Spring Arbor Banking Center Branch, Jackson East Banking Center Branch, Argyle/Wisner Banking Center. Info updated 2009/10/05: Bank assets: $114,540.4 mil, Deposits: $89,689.1 mil, headquarters in Cincinnati, OH, positive income , Commercial Lending Specialization, 1378 total offices , Holding Company: Fifth Third Bancorp
Bank of America, National Association: Downtown Jackson Branch at 215 S. Jackson, branch established on 1936/01/01; West Jackson Branch at 1650 West Michigan Avenue, branch established on 1893/01/01. Info updated 2009/11/18: Bank assets: $1,451,969.3 mil, Deposits: $1,077,176.8 mil, headquarters in Charlotte, NC, positive income , 5782 total offices , Holding Company: Bank Of America Corporation
PNC Bank, National Association: Boardmand Road Branch at 1965 Boardman Road, branch established on 2006/02/06. Info updated 2012/03/20: Bank assets: $263,309.6 mil, Deposits: $197,343.0 mil, headquarters in Wilmington, DE, positive income , Commercial Lending Specialization, 3085 total offices , Holding Company: Pnc Financial Services Group, Inc., The
For population 15 years and over in Jackson:
Never married: 43.5%Now married: 32.3%Separated: 1.3%Widowed: 4.8%Divorced: 18.1% For population 25 years and over in Jackson:
High school or higher: 87.3%Bachelor's degree or higher: 15.3%Graduate or professional degree: 4.6%Unemployed: 8.1%Mean travel time to work (commute): 14.9 minutes
Education Gini index (Inequality in education) Here:
9.6Michigan average:
11.0
Religion statistics for Jackson, MI (based on Jackson County data)
Religion Adherents Congregations Catholic 19,651 8 Evangelical Protestant 16,909 91 Mainline Protestant 8,645 42 Black Protestant 1,790 9 Other 1,649 10 Orthodox 112 2 None 111,492 -
Source: Clifford Grammich, Kirk Hadaway, Richard Houseal, Dale E.Jones, Alexei Krindatch, Richie Stanley and Richard H.Taylor. 2012. 2010 U.S.Religion Census: Religious Congregations & Membership Study. Association of Statisticians of American Religious Bodies. Jones, Dale E., et al. 2002. Congregations and Membership in the United States 2000. Nashville, TN: Glenmary Research Center. Graphs represent county-level data
Food Environment Statistics: Number of grocery stores : 30Jackson County :
1.84 / 10,000 pop.State :
2.34 / 10,000 pop.
Number of supercenters and club stores : 3Jackson County :
0.18 / 10,000 pop.Michigan :
0.18 / 10,000 pop.
Number of convenience stores (no gas) : 39This county :
2.40 / 10,000 pop.Michigan :
1.52 / 10,000 pop.
Number of convenience stores (with gas) : 58Jackson County :
3.56 / 10,000 pop.State :
2.99 / 10,000 pop.
Number of full-service restaurants : 91Here :
5.59 / 10,000 pop.State :
6.80 / 10,000 pop.
Adult diabetes rate : This county :
9.4%State :
9.7%
Adult obesity rate : Jackson County :
30.3%Michigan :
29.7%
Low-income preschool obesity rate : This county :
13.1%Michigan :
13.4%
Health and Nutrition:
Average overall health of teeth and gums : Jackson:
46.6%Michigan:
47.9%
People feeling badly about themselves : People not drinking alcohol at all : Average hours sleeping at night : Overweight people : Jackson:
34.2%Michigan:
34.1%
General health condition : This city:
56.3%State:
57.0%
Average condition of hearing : This city:
80.0%Michigan:
79.6%
More about Health and Nutrition of Jackson, MI Residents
Local government employment and payroll (March 2022)
Function
Full-time employees
Monthly full-time payroll
Average yearly full-time wage
Part-time employees
Monthly part-time payroll
Police Protection - Officers
57 $366,107 $77,075 0 $0 Water Supply
44 $247,824 $67,588 0 $0 Firefighters
26 $167,085 $77,116 0 $0 Financial Administration
15 $100,068 $80,054 2 $5,956 Parks and Recreation
15 $93,324 $74,659 37 $21,328 Sewerage
10 $53,696 $64,435 0 $0 Other and Unallocable
10 $52,765 $63,318 4 $9,145 Other Government Administration
7 $53,396 $91,536 2 $4,573 Streets and Highways
7 $51,222 $87,809 2 $1,752 Housing and Community Development (Local)
5 $34,312 $82,349 0 $0 Judicial and Legal
4 $25,948 $77,844 1 $4,448 Police - Other
3 $12,793 $51,172 9 $6,711
Totals for Government
203 $1,258,540 $74,396 57 $53,913
Jackson government finances - Expenditure in 2021 (per resident):
Construction - Water Utilities: $3,482,000 ($112.21)
Sewerage: $913,000 ($29.42)Current Operations - General - Other: $13,132,000 ($423.19)
Sewerage: $11,728,000 ($377.94)Police Protection: $9,887,000 ($318.62)Regular Highways: $9,825,000 ($316.62)Local Fire Protection: $4,673,000 ($150.59)Parks and Recreation: $2,545,000 ($82.01)Financial Administration: $1,394,000 ($44.92)Central Staff Services: $1,112,000 ($35.84)Protective Inspection and Regulation - Other: $917,000 ($29.55)Judicial and Legal Services: $585,000 ($18.85)General Public Buildings: $311,000 ($10.02)General - Interest on Debt: $3,145,000 ($101.35)
Other Capital Outlay - Regular Highways: $8,445,000 ($272.15)
Parks and Recreation: $2,548,000 ($82.11)General - Other: $1,722,000 ($55.49)Total Salaries and Wages: $16,102,000 ($518.90)
Jackson government finances - Revenue in 2021 (per resident):
Charges - Sewerage: $5,928,000 ($191.03)
Other: $5,380,000 ($173.38)Parks and Recreation: $627,000 ($20.21)Parking Facilities: $139,000 ($4.48)Federal Intergovernmental - Other: $5,209,000 ($167.86)
Housing and Community Development: $1,065,000 ($34.32)Local Intergovernmental - Other: $1,835,000 ($59.13)
Miscellaneous - General Revenue - Other: $3,193,000 ($102.90)
Rents: $1,540,000 ($49.63)Special Assessments: $633,000 ($20.40)Sale of Property: $619,000 ($19.95)Fines and Forfeits: $442,000 ($14.24)Interest Earnings: $333,000 ($10.73)Revenue - Water Utilities: $9,868,000 ($318.00)
State Intergovernmental - General Local Government Support: $5,082,000 ($163.77)
Highways: $4,649,000 ($149.82)Other: $1,318,000 ($42.47)Tax - Property: $14,648,000 ($472.04)
Individual Income: $9,218,000 ($297.06)Other License: $1,056,000 ($34.03)
Jackson government finances - Debt in 2021 (per resident):
Long Term Debt - Beginning Outstanding - Unspecified Public Purpose: $53,187,000 ($1714.00)
Outstanding Unspecified Public Purpose: $50,534,000 ($1628.50)Retired Unspecified Public Purpose: $12,803,000 ($412.59)Issue, Unspecified Public Purpose: $10,150,000 ($327.09)
Jackson government finances - Cash and Securities in 2021 (per resident):
Other Funds - Cash and Securities: $61,509,000 ($1982.18)
Businesses in Jackson, MI
Name Count Name Count
7-Eleven 1 Lowe's 1 ALDI 1 Marriott 1 AMF Bowling 1 MasterBrand Cabinets 4 AT&T 2 Maurices 1 Ace Hardware 1 McDonald's 8 Advance Auto Parts 3 Meijer 2 Aeropostale 1 Men's Wearhouse 1 American Eagle Outfitters 1 Menards 1 Applebee's 1 Motel 6 1 Arby's 2 New Balance 4 AutoZone 3 Nike 14 Bath & Body Works 2 Nissan 1 Baymont Inn 1 Office Depot 1 Bed Bath & Beyond 1 OfficeMax 1 Blockbuster 1 Old Country Buffet 1 Burger King 3 Olive Garden 1 CVS 1 Outback 1 Carson Pirie Scott 1 Outback Steakhouse 1 Chevrolet 1 Pac Sun 1 Cold Stone Creamery 1 Panera Bread 1 Comfort Inn 1 Papa John's Pizza 1 Cracker Barrel 1 Payless 3 Curves 1 Penske 2 DHL 2 Pizza Hut 2 Dairy Queen 1 Quiznos 2 Deb 1 RadioShack 2 Dennys 1 Red Lobster 1 Discount Tire 1 Rite Aid 4 Dunkin Donuts 1 Ryder Rental & Truck Leasing 1 Famous Footwear 1 SAS Shoes 1 Fashion Bug 1 Sam's Club 1 FedEx 12 Sears 4 Firestone Complete Auto Care 1 Sprint Nextel 1 Foot Locker 1 Starbucks 2 Ford 1 Steak 'n Shake 1 GNC 3 Subway 3 GameStop 1 Super 8 1 Gymboree 1 T-Mobile 2 H&R Block 4 T.J.Maxx 1 Hilton 1 Taco Bell 3 Holiday Inn 1 Target 1 Home Depot 1 The Room Place 1 Honda 1 Tim Hortons 3 Hot Topic 1 Toys"R"Us 2 JCPenney 1 Travelodge 1 Jones New York 3 U-Haul 4 Justice 1 UPS 18 KFC 2 Vans 1 Kmart 2 Verizon Wireless 1 Kohl's 1 Victoria's Secret 1 Kroger 2 Walgreens 2 La-Z-Boy 2 Walmart 1 Lane Furniture 2 Wendy's 6 Little Caesars Pizza 3 YMCA 2 Long John Silver's 1
Strongest AM radio stations in Jackson:
WJKN (1510 AM; daytime; 5 kW; JACKSON, MI)
WIBM (1450 AM; 1 kW; JACKSON, MI; Owner: JACKSON RADIO WORKS, INC.)
WKHM (970 AM; 1 kW; JACKSON, MI; Owner: JACKSON RADIO WORKS, INC.)
WFDF (910 AM; 50 kW; FLINT, MI; Owner: ABC, INC.)
WJR (760 AM; 50 kW; DETROIT, MI; Owner: ABC, INC.)
WOAP (1080 AM; 50 kW; OWOSSO, MI)
WCHB (1200 AM; 50 kW; TAYLOR, MI; Owner: RADIO ONE OF DETROIT, LLC)
WWJ (950 AM; 50 kW; DETROIT, MI; Owner: INFINITY BROADCASTING OPERATIONS, INC.)
WDFN (1130 AM; 50 kW; DETROIT, MI; Owner: AMFM RADIO LICENSES, L.L.C.)
WKAR (870 AM; daytime; 10 kW; EAST LANSING, MI; Owner: MICHIGAN STATE UNIVERSITY)
WXYT (1270 AM; 50 kW; DETROIT, MI; Owner: INFINITY BROADCASTING CORP. OF DETROIT)
WTKA (1050 AM; 10 kW; ANN ARBOR, MI; Owner: CAPSTAR TX LIMITED PARTNERSHIP)
WDEO (990 AM; 9 kW; YPSILANTI, MI; Owner: WORD BROADCASTERS, INC.)
Strongest FM radio stations in Jackson:
WKHM-FM (105.3 FM; BROOKLYN, MI; Owner: JACKSON RADIO WORKS, INC.)
WAAQ (88.3 FM; ONSTED, MI; Owner: GREAT LAKES COMMUNITY BROADCASTING, INC.)
WUFN (96.7 FM; ALBION, MI; Owner: FAMILY LIFE BROADCASTING SYSTEM)
WSAE (106.9 FM; SPRING ARBOR, MI; Owner: SPRING ARBOR COLLEGE COMMUNICATIONS)
WJXQ (106.1 FM; JACKSON, MI; Owner: RUBBER CITY RADIO GROUP)
WVIC (94.1 FM; JACKSON, MI; Owner: RUBBER CITY RADIO GROUP)
WUOM (91.7 FM; ANN ARBOR, MI; Owner: THE REGENTS OF THE UNIV. OF MICH.)
WKAR-FM (90.5 FM; EAST LANSING, MI; Owner: MICHIGAN STATE UNIVERSITY)
WFMK (99.1 FM; EAST LANSING, MI; Owner: CITADEL BROADCASTING COMPANY)
WITL-FM (100.7 FM; LANSING, MI; Owner: CITADEL BROADCASTING COMPANY)
WLGH (88.1 FM; LEROY TOWNSHIP, MI; Owner: SUPERIOR COMMUNICATIONS)
WJIM-FM (97.5 FM; LANSING, MI; Owner: CITADEL BROADCASTING COMPANY)
WMMQ (94.9 FM; EAST LANSING, MI; Owner: CITADEL BROADCASTING COMPANY)
WWWW (102.9 FM; ANN ARBOR, MI; Owner: CAPSTAR TX LIMITED PARTNERSHIP)
WBZV (102.5 FM; HUDSON, MI; Owner: FRIENDS COMMUNICATIONS OF HUDSON INC)
TV broadcast stations around Jackson:
WLAJ (Channel 53; LANSING, MI; Owner: FREEDOM BROADCASTING OF MICHIGAN, INC.)
WHTV (Channel 18; JACKSON, MI; Owner: SPARTAN-TV, L.L.C.)
WILX-TV (Channel 10; ONONDAGA, MI; Owner: GRAY MIDAMERICA TV LICENSEE CORP.)
W24CG (Channel 24; HOUGHTON LAKE, MI; Owner: MS COMMUNICATIONS, LLC)
WPXD (Channel 31; ANN ARBOR, MI; Owner: PAXSON COMMUNICATIONS LICENSE COMPANY, LLC)
WSYM-TV (Channel 47; LANSING, MI; Owner: JOURNAL BROADCAST CORPORATION)
W27CJ (Channel 27; ANN ARBOR, MI; Owner: TCT OF MICHIGAN, INC.)
WLNS-TV (Channel 6; LANSING, MI; Owner: YOUNG BROADCASTING OF LANSING, INC.)
WKAR-TV (Channel 23; EAST LANSING, MI; Owner: BOARD OF TRUSTEES, MICH. STATE UNIV.)
W69BJ (Channel 69; LANSING, MI; Owner: TRI-STATE CHRISTIAN TV, INC.)
WZPX (Channel 43; BATTLE CREEK, MI; Owner: PAXSON BATTLE CREEK LICENSE, INC.)
Medal of Honor Recipients
Medal of Honor Recipients born in Jackson: Edwin F. Savacool, James Leroy Bondsteel.
National Bridge Inventory (NBI) Statistics 73 Number of bridges774ft / 236m Total length $2,031,000 Total costs1,279,900 Total average daily traffic160,037 Total average daily truck traffic
New bridges - historical statistics
1 1900-1909 2 1910-1919 1 1920-1929 2 1930-1939 2 1940-1949 27 1950-1959 6 1960-1969 6 1970-1979 2 1980-1989 1 1990-1999 9 2000-2009 5 2010-2019 9 2020-2022
See full National Bridge Inventory statistics for Jackson, MI
Home Mortgage Disclosure Act Aggregated Statistics For Year 2009(Based on 13 full tracts) A) FHA, FSA/RHS & VA B) Conventional C) Refinancings D) Home Improvement Loans E) Loans on Dwellings For 5+ Families F) Non-occupant Loans on G) Loans On Manufactured Number Average Value Number Average Value Number Average Value Number Average Value Number Average Value Number Average Value Number Average Value
LOANS ORIGINATED 113 $66,832 50 $43,960 203 $85,005 57 $18,421 2 $361,000 52 $41,481 6 $31,667 APPLICATIONS APPROVED, NOT ACCEPTED 6 $50,000 7 $73,143 42 $84,357 7 $22,857 0 $0 7 $59,286 1 $41,000 APPLICATIONS DENIED 21 $62,619 16 $51,438 123 $79,211 57 $24,386 0 $0 15 $43,267 2 $96,500 APPLICATIONS WITHDRAWN 7 $46,714 5 $75,600 56 $92,268 29 $21,034 0 $0 7 $52,571 0 $0 FILES CLOSED FOR INCOMPLETENESS 1 $20,000 0 $0 11 $78,727 4 $26,500 0 $0 1 $65,000 0 $0
Aggregated Statistics For Year 2008(Based on 13 full tracts) A) FHA, FSA/RHS & VA B) Conventional C) Refinancings D) Home Improvement Loans E) Loans on Dwellings For 5+ Families F) Non-occupant Loans on G) Loans On Manufactured Number Average Value Number Average Value Number Average Value Number Average Value Number Average Value Number Average Value Number Average Value
LOANS ORIGINATED 121 $72,116 98 $68,694 271 $75,458 73 $19,164 8 $840,750 97 $52,876 4 $62,500 APPLICATIONS APPROVED, NOT ACCEPTED 11 $73,636 13 $74,615 58 $80,190 8 $86,000 0 $0 14 $69,357 2 $27,000 APPLICATIONS DENIED 22 $73,818 49 $52,837 291 $88,701 106 $29,840 2 $133,500 56 $52,232 5 $58,000 APPLICATIONS WITHDRAWN 13 $57,231 12 $53,083 126 $92,143 24 $31,042 0 $0 13 $60,231 0 $0 FILES CLOSED FOR INCOMPLETENESS 1 $91,000 5 $64,600 28 $90,143 1 $83,000 0 $0 9 $60,778 0 $0
Aggregated Statistics For Year 2007(Based on 13 full tracts) A) FHA, FSA/RHS & VA B) Conventional C) Refinancings D) Home Improvement Loans E) Loans on Dwellings For 5+ Families F) Non-occupant Loans on G) Loans On Manufactured Number Average Value Number Average Value Number Average Value Number Average Value Number Average Value Number Average Value Number Average Value
LOANS ORIGINATED 63 $83,619 330 $71,842 485 $74,078 144 $30,132 0 $0 218 $63,101 3 $57,000 APPLICATIONS APPROVED, NOT ACCEPTED 4 $53,500 54 $80,111 121 $77,306 25 $26,560 0 $0 37 $74,027 3 $80,333 APPLICATIONS DENIED 29 $76,655 221 $83,335 634 $81,716 154 $29,773 2 $121,000 164 $70,805 12 $45,250 APPLICATIONS WITHDRAWN 7 $63,429 47 $68,191 238 $87,374 46 $42,043 0 $0 51 $73,137 1 $48,000 FILES CLOSED FOR INCOMPLETENESS 0 $0 19 $89,053 63 $85,016 4 $51,500 0 $0 11 $72,818 0 $0
Aggregated Statistics For Year 2006(Based on 13 full tracts) A) FHA, FSA/RHS & VA B) Conventional C) Refinancings D) Home Improvement Loans E) Loans on Dwellings For 5+ Families F) Non-occupant Loans on G) Loans On Manufactured Number Average Value Number Average Value Number Average Value Number Average Value Number Average Value Number Average Value Number Average Value
LOANS ORIGINATED 91 $85,747 723 $74,568 724 $73,217 151 $35,285 2 $198,500 406 $68,473 6 $93,000 APPLICATIONS APPROVED, NOT ACCEPTED 6 $93,667 153 $74,647 176 $79,443 32 $36,438 0 $0 73 $76,712 5 $43,200 APPLICATIONS DENIED 17 $80,824 441 $75,980 764 $89,211 173 $43,052 1 $210,000 286 $81,385 17 $35,529 APPLICATIONS WITHDRAWN 9 $94,778 112 $69,714 362 $88,445 46 $49,261 0 $0 65 $68,923 3 $108,333 FILES CLOSED FOR INCOMPLETENESS 0 $0 37 $77,568 172 $89,017 6 $54,667 0 $0 18 $62,111 0 $0
Aggregated Statistics For Year 2005(Based on 13 full tracts) A) FHA, FSA/RHS & VA B) Conventional C) Refinancings D) Home Improvement Loans E) Loans on Dwellings For 5+ Families F) Non-occupant Loans on G) Loans On Manufactured Number Average Value Number Average Value Number Average Value Number Average Value Number Average Value Number Average Value Number Average Value
LOANS ORIGINATED 100 $88,410 779 $72,634 867 $75,122 158 $34,886 1 $195,000 324 $68,182 5 $67,000 APPLICATIONS APPROVED, NOT ACCEPTED 28 $104,643 181 $73,039 172 $77,076 32 $33,875 0 $0 82 $73,195 8 $38,500 APPLICATIONS DENIED 22 $86,091 366 $66,566 915 $81,927 171 $36,520 1 $100,000 177 $70,339 20 $42,800 APPLICATIONS WITHDRAWN 7 $96,286 176 $84,801 389 $84,787 64 $82,297 0 $0 66 $80,742 6 $37,167 FILES CLOSED FOR INCOMPLETENESS 3 $94,000 40 $77,375 229 $84,192 7 $58,143 0 $0 9 $66,778 0 $0
Aggregated Statistics For Year 2004(Based on 13 full tracts) A) FHA, FSA/RHS & VA B) Conventional C) Refinancings D) Home Improvement Loans E) Loans on Dwellings For 5+ Families F) Non-occupant Loans on G) Loans On Manufactured Number Average Value Number Average Value Number Average Value Number Average Value Number Average Value Number Average Value Number Average Value
LOANS ORIGINATED 120 $84,858 528 $73,415 1,024 $75,727 146 $35,918 8 $250,875 312 $63,596 13 $58,769 APPLICATIONS APPROVED, NOT ACCEPTED 29 $96,552 118 $82,212 244 $80,422 26 $50,500 1 $260,000 62 $69,339 8 $70,000 APPLICATIONS DENIED 35 $84,000 183 $64,361 911 $78,344 164 $34,421 2 $288,000 106 $63,292 17 $49,471 APPLICATIONS WITHDRAWN 12 $90,417 62 $72,565 314 $82,073 38 $52,658 0 $0 37 $62,405 1 $133,000 FILES CLOSED FOR INCOMPLETENESS 9 $81,556 27 $68,889 250 $80,072 4 $40,750 0 $0 20 $61,400 0 $0
Aggregated Statistics For Year 2003(Based on 13 full tracts) A) FHA, FSA/RHS & VA B) Conventional C) Refinancings D) Home Improvement Loans E) Loans on Dwellings For 5+ Families F) Non-occupant Loans on Number Average Value Number Average Value Number Average Value Number Average Value Number Average Value Number Average Value
LOANS ORIGINATED 129 $83,930 425 $73,558 1,482 $77,394 119 $22,034 9 $326,778 244 $60,631 APPLICATIONS APPROVED, NOT ACCEPTED 8 $81,875 68 $66,000 211 $76,019 24 $21,458 0 $0 35 $66,057 APPLICATIONS DENIED 17 $93,824 158 $69,082 963 $81,067 150 $16,340 1 $140,000 93 $59,441 APPLICATIONS WITHDRAWN 12 $80,417 70 $74,043 345 $80,452 14 $37,214 0 $0 43 $70,767 FILES CLOSED FOR INCOMPLETENESS 14 $83,214 20 $76,550 105 $85,171 5 $34,400 0 $0 8 $58,625
Aggregated Statistics For Year 2002(Based on 13 full tracts) A) FHA, FSA/RHS & VA B) Conventional C) Refinancings D) Home Improvement Loans E) Loans on Dwellings For 5+ Families F) Non-occupant Loans on Number Average Value Number Average Value Number Average Value Number Average Value Number Average Value Number Average Value
LOANS ORIGINATED 146 $78,397 428 $70,811 1,097 $72,938 131 $17,611 6 $286,667 208 $55,538 APPLICATIONS APPROVED, NOT ACCEPTED 6 $74,833 55 $59,145 192 $70,474 23 $14,696 0 $0 24 $49,500 APPLICATIONS DENIED 17 $77,059 147 $54,082 641 $67,084 131 $13,015 0 $0 65 $49,754 APPLICATIONS WITHDRAWN 8 $99,125 42 $69,643 231 $63,844 11 $34,818 0 $0 18 $52,778 FILES CLOSED FOR INCOMPLETENESS 10 $79,000 15 $59,067 269 $71,305 1 $12,000 0 $0 10 $51,200
Aggregated Statistics For Year 2001(Based on 13 full tracts) A) FHA, FSA/RHS & VA B) Conventional C) Refinancings D) Home Improvement Loans E) Loans on Dwellings For 5+ Families F) Non-occupant Loans on Number Average Value Number Average Value Number Average Value Number Average Value Number Average Value Number Average Value
LOANS ORIGINATED 173 $75,335 369 $70,398 1,006 $67,836 151 $17,477 4 $423,500 172 $57,012 APPLICATIONS APPROVED, NOT ACCEPTED 6 $57,667 63 $63,349 157 $62,025 45 $14,267 0 $0 21 $52,571 APPLICATIONS DENIED 13 $56,846 205 $54,341 632 $57,960 151 $13,344 0 $0 59 $57,068 APPLICATIONS WITHDRAWN 14 $65,929 22 $52,318 299 $63,117 19 $21,158 0 $0 17 $61,412 FILES CLOSED FOR INCOMPLETENESS 7 $64,286 9 $49,889 99 $61,515 5 $39,400 0 $0 10 $61,400
Aggregated Statistics For Year 2000(Based on 13 full tracts) A) FHA, FSA/RHS & VA B) Conventional C) Refinancings D) Home Improvement Loans E) Loans on Dwellings For 5+ Families F) Non-occupant Loans on Number Average Value Number Average Value Number Average Value Number Average Value Number Average Value Number Average Value
LOANS ORIGINATED 200 $68,750 412 $63,633 482 $56,658 131 $17,695 6 $203,000 104 $53,433 APPLICATIONS APPROVED, NOT ACCEPTED 8 $51,000 68 $57,250 162 $56,377 60 $14,150 0 $0 27 $46,926 APPLICATIONS DENIED 17 $63,235 447 $50,911 451 $53,031 233 $15,764 0 $0 64 $57,531 APPLICATIONS WITHDRAWN 19 $61,947 50 $58,720 237 $45,916 31 $38,806 1 $40,000 21 $39,571 FILES CLOSED FOR INCOMPLETENESS 2 $86,000 10 $59,500 91 $52,725 0 $0 0 $0 15 $41,667
Aggregated Statistics For Year 1999(Based on 13 full tracts) A) FHA, FSA/RHS & VA B) Conventional C) Refinancings D) Home Improvement Loans E) Loans on Dwellings For 5+ Families F) Non-occupant Loans on Number Average Value Number Average Value Number Average Value Number Average Value Number Average Value Number Average Value
LOANS ORIGINATED 160 $61,789 343 $62,402 704 $52,655 166 $14,497 1 $350,000 120 $44,480 APPLICATIONS APPROVED, NOT ACCEPTED 9 $56,797 52 $57,587 248 $54,574 57 $13,818 0 $0 15 $48,205 APPLICATIONS DENIED 24 $56,883 380 $51,193 467 $52,071 228 $9,940 0 $0 54 $41,014 APPLICATIONS WITHDRAWN 13 $60,512 57 $61,917 326 $52,588 37 $32,623 0 $0 19 $44,396 FILES CLOSED FOR INCOMPLETENESS 5 $56,730 9 $50,180 107 $56,387 5 $15,694 0 $0 11 $46,850
Detailed mortgage data for all 13 tracts in Jackson, MI
Private Mortgage Insurance Companies Aggregated Statistics For Year 2009(Based on 5 full tracts) A) Conventional B) Refinancings Number Average Value Number Average Value
LOANS ORIGINATED 2 $63,500 4 $91,500 APPLICATIONS APPROVED, NOT ACCEPTED 2 $34,000 1 $128,000 APPLICATIONS DENIED 0 $0 1 $192,000 APPLICATIONS WITHDRAWN 0 $0 2 $135,000 FILES CLOSED FOR INCOMPLETENESS 0 $0 0 $0
Aggregated Statistics For Year 2008(Based on 13 full tracts) A) Conventional B) Refinancings C) Non-occupant Loans on Number Average Value Number Average Value Number Average Value
LOANS ORIGINATED 30 $68,933 28 $85,964 11 $45,091 APPLICATIONS APPROVED, NOT ACCEPTED 29 $81,448 16 $108,812 10 $47,300 APPLICATIONS DENIED 2 $49,000 6 $87,500 4 $50,500 APPLICATIONS WITHDRAWN 3 $50,667 2 $74,000 3 $50,333 FILES CLOSED FOR INCOMPLETENESS 3 $68,333 1 $241,000 2 $74,000
Aggregated Statistics For Year 2007(Based on 13 full tracts) A) Conventional B) Refinancings C) Non-occupant Loans on Number Average Value Number Average Value Number Average Value
LOANS ORIGINATED 145 $81,579 51 $91,196 23 $69,652 APPLICATIONS APPROVED, NOT ACCEPTED 21 $75,143 24 $93,667 8 $63,625 APPLICATIONS DENIED 5 $112,400 1 $82,000 2 $76,500 APPLICATIONS WITHDRAWN 6 $121,167 3 $112,000 1 $68,000 FILES CLOSED FOR INCOMPLETENESS 1 $25,000 0 $0 0 $0
Aggregated Statistics For Year 2006(Based on 12 full tracts) A) Conventional B) Refinancings C) Non-occupant Loans on Number Average Value Number Average Value Number Average Value
LOANS ORIGINATED 144 $86,986 35 $99,743 40 $77,675 APPLICATIONS APPROVED, NOT ACCEPTED 18 $78,000 11 $80,455 9 $72,333 APPLICATIONS DENIED 3 $91,000 0 $0 2 $98,500 APPLICATIONS WITHDRAWN 3 $77,000 5 $101,800 2 $79,000 FILES CLOSED FOR INCOMPLETENESS 1 $77,000 0 $0 1 $77,000
Aggregated Statistics For Year 2005(Based on 13 full tracts) A) Conventional B) Refinancings C) Non-occupant Loans on D) Loans On Manufactured Number Average Value Number Average Value Number Average Value Number Average Value
LOANS ORIGINATED 166 $86,060 56 $97,214 49 $78,490 1 $103,000 APPLICATIONS APPROVED, NOT ACCEPTED 38 $73,947 18 $108,944 13 $56,231 0 $0 APPLICATIONS DENIED 5 $66,600 0 $0 5 $66,600 0 $0 APPLICATIONS WITHDRAWN 12 $77,750 5 $88,400 7 $73,857 0 $0 FILES CLOSED FOR INCOMPLETENESS 1 $69,000 1 $86,000 0 $0 0 $0
Aggregated Statistics For Year 2004(Based on 13 full tracts) A) Conventional B) Refinancings C) Non-occupant Loans on Number Average Value Number Average Value Number Average Value
LOANS ORIGINATED 131 $77,252 63 $86,317 44 $59,864 APPLICATIONS APPROVED, NOT ACCEPTED 35 $77,743 35 $86,629 10 $65,400 APPLICATIONS DENIED 1 $61,000 1 $76,000 1 $61,000 APPLICATIONS WITHDRAWN 7 $77,857 5 $96,400 2 $61,500 FILES CLOSED FOR INCOMPLETENESS 0 $0 1 $106,000 0 $0
Aggregated Statistics For Year 2003(Based on 13 full tracts) A) Conventional B) Refinancings C) Non-occupant Loans on Number Average Value Number Average Value Number Average Value
LOANS ORIGINATED 165 $82,309 128 $90,594 34 $57,176 APPLICATIONS APPROVED, NOT ACCEPTED 35 $80,114 53 $89,491 13 $62,308 APPLICATIONS DENIED 3 $101,333 0 $0 1 $36,000 APPLICATIONS WITHDRAWN 9 $76,778 10 $86,900 5 $72,400 FILES CLOSED FOR INCOMPLETENESS 0 $0 0 $0 0 $0
Aggregated Statistics For Year 2002(Based on 13 full tracts) A) Conventional B) Refinancings C) Non-occupant Loans on Number Average Value Number Average Value Number Average Value
LOANS ORIGINATED 187 $73,701 112 $83,429 54 $52,000 APPLICATIONS APPROVED, NOT ACCEPTED 23 $74,435 46 $77,717 10 $64,900 APPLICATIONS DENIED 4 $60,000 4 $86,000 2 $66,500 APPLICATIONS WITHDRAWN 5 $61,000 9 $78,556 3 $72,000 FILES CLOSED FOR INCOMPLETENESS 1 $76,000 2 $53,500 0 $0
Aggregated Statistics For Year 2001(Based on 13 full tracts) A) Conventional B) Refinancings C) Non-occupant Loans on Number Average Value Number Average Value Number Average Value
LOANS ORIGINATED 125 $75,984 94 $80,787 27 $55,481 APPLICATIONS APPROVED, NOT ACCEPTED 17 $89,882 18 $98,222 2 $83,500 APPLICATIONS DENIED 3 $33,000 3 $70,333 2 $47,500 APPLICATIONS WITHDRAWN 3 $59,000 2 $68,500 1 $65,000 FILES CLOSED FOR INCOMPLETENESS 0 $0 0 $0 0 $0
Aggregated Statistics For Year 2000(Based on 13 full tracts) A) Conventional B) Refinancings C) Non-occupant Loans on Number Average Value Number Average Value Number Average Value
LOANS ORIGINATED 151 $68,483 58 $59,276 28 $44,536 APPLICATIONS APPROVED, NOT ACCEPTED 20 $70,900 12 $65,167 2 $40,000 APPLICATIONS DENIED 5 $58,400 1 $68,000 1 $86,000 APPLICATIONS WITHDRAWN 1 $113,000 0 $0 0 $0 FILES CLOSED FOR INCOMPLETENESS 1 $85,000 1 $75,000 0 $0
Aggregated Statistics For Year 1999(Based on 12 full tracts) A) Conventional B) Refinancings C) Non-occupant Loans on Number Average Value Number Average Value Number Average Value
LOANS ORIGINATED 136 $66,742 40 $61,822 27 $46,517 APPLICATIONS APPROVED, NOT ACCEPTED 6 $89,780 6 $61,850 2 $48,610 APPLICATIONS DENIED 5 $64,324 1 $56,000 2 $41,325 APPLICATIONS WITHDRAWN 2 $60,800 0 $0 0 $0 FILES CLOSED FOR INCOMPLETENESS 0 $0 2 $50,190 0 $0
Fire-safe hotels and motels in Jackson, Michigan:
Fairfield Inn By Marriott Jackson, 2395 Shirley Dr, Jackson, Michigan 49202 Phone: (517) 784-7877, Fax: (517) 784-7877
Baymont Inn & Suites, 2035 Bondsteel Dr, Jackson, Michigan 49202 Phone: (517) 789-6000, Fax: (517) 782-6836
Holiday Inn Express, 3506 O""neill Dr, Jackson, Michigan 49202 Phone: (517) 788-6400, Fax: (517) 788-6200
Hampton Inn Jackson, 2225 Shirley Dr, Jackson, Michigan 49202 Phone: (517) 789-5151, Fax: (517) 789-8696
Holiday Inn Jackson NW - Airport Rd, 2696 Bob Mcclain Dr, Jackson, Michigan 49202 Phone: (517) 789-9600, Fax: (517) 789-9601
Americas Best Value Inn - Jackson, Mi, 830 Royal Dr, Jackson, Michigan 49202 Phone: (517) 783-1900
Home2 Suites by Hilton, 2704 Bob McClain Dr, Jackson, Michigan 49202 Phone: (517) 998-7000, Fax: (517) 998-7100
Try by Hilton, 2401 Shirley Dr, Jackson, Michigan 49202 Phone: (517) 867-5000, Fax: (517) 867-5005
TownePlace Suites by Marriott, 2002 Bondsteel Dr, Jackson, Michigan 49202 Phone: (517) 780-0065, Fax: (517) 780-0067
All 9 fire-safe hotels and motels in Jackson, Michigan
Most common first names in Jackson, MI among deceased individuals Name Count Lived (average)
Mary 763 79.9 years John 714 73.6 years William 628 74.1 years Robert 607 69.9 years James 453 70.1 years Charles 450 73.0 years Helen 410 81.2 years George 400 76.4 years Margaret 353 80.0 years Dorothy 329 77.8 years
Most common last names in Jackson, MI among deceased individuals Last name Count Lived (average)
Smith 399 75.5 years Miller 223 74.6 years Johnson 199 73.2 years Williams 174 74.4 years Brown 173 74.2 years Taylor 155 75.0 years Jones 120 74.2 years Davis 111 75.5 years Wilson 103 74.5 years Clark 99 77.5 years
Jackson compared to Michigan state average:
Median household income below state average. Median house value significantly below state average. Unemployed percentage below state average. Median age significantly below state average. Foreign-born population percentage significantly below state average. Renting percentage above state average. Length of stay since moving in significantly above state average. House age above state average.
#74 on the list of "Top 100 cities with old houses but young residents (pop. 5,000+)"
#77 on the list of "Top 101 cities with the highest number of rapes per 100,000 residents, excludes tourist destinations and others with a lot of outsiders visiting based on city industries data (population 5,000+)"
#99 on the list of "Top 101 cities with the largest city-data.com crime index per police officer (population 5,000+)"
#100 on the list of "Top 101 cities with the lowest cost per building permit(population 5,000+)"
#83 on the list of "Top 101 counties with the lowest percentage of residents relocating to foreign countries in 2011"
#86 on the list of "Top 101 counties with the lowest percentage of residents relocating from other counties between 2010 and 2011 (pop. 50,000+)"
Top Patent Applicants
Frederick C. Beuerle (22)
G. David Lisch (20)
George David Lisch (17)
Michael Olen Nevins (9)
Keith Olivier (9)
Roy Glenn Kaywood (8)
Keith G. Olivier (8)
Patrick J. Mccleer (8)
Salah Huwais (8)
Anthony Beckman Hays (7)
Total of 318 patent applications in 2008-2024.
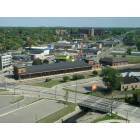
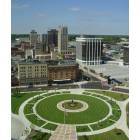
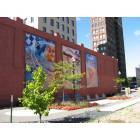
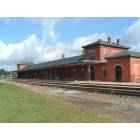
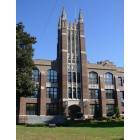
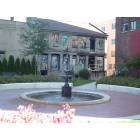
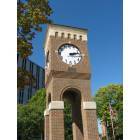
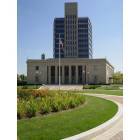
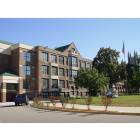


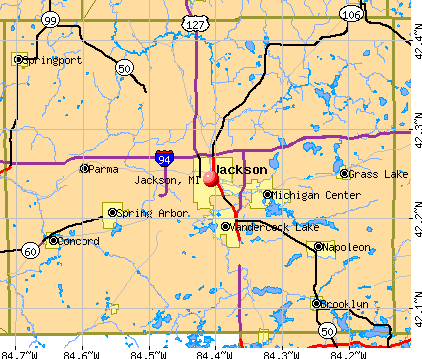


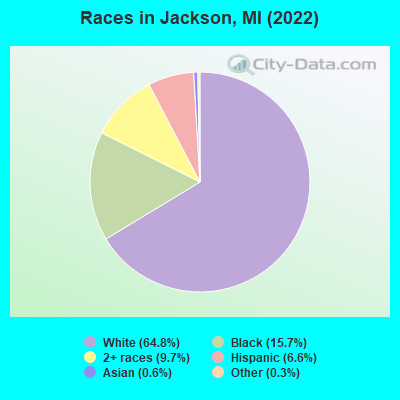
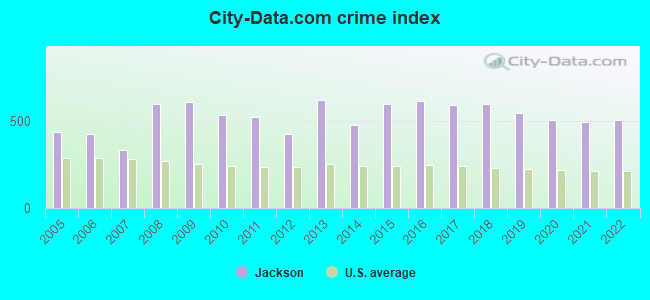
 Recent articles from our blog. Our writers, many of them Ph.D. graduates or candidates, create easy-to-read articles on a wide variety of topics.

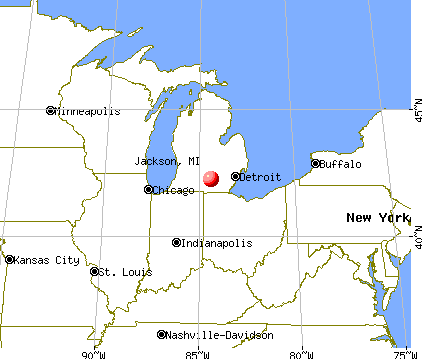
 (33.6 miles
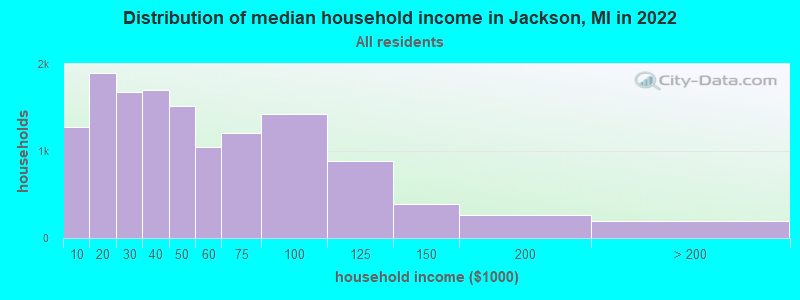
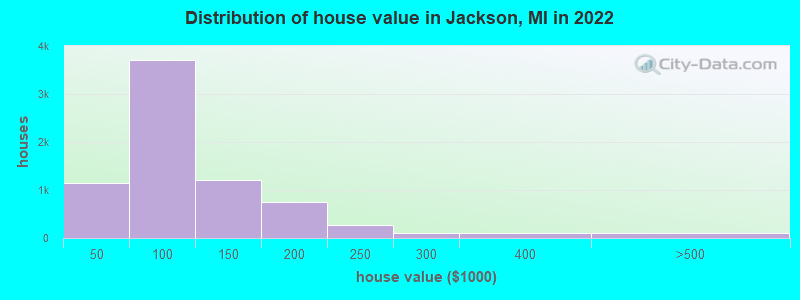
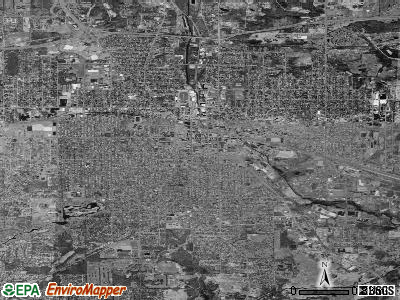
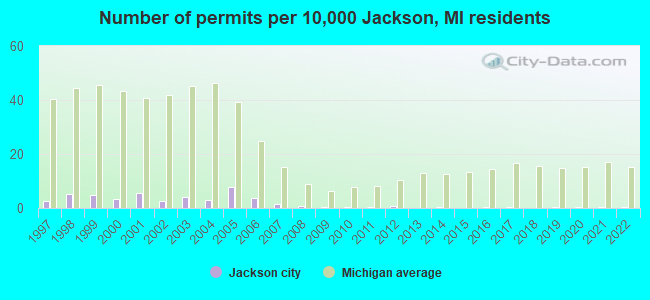
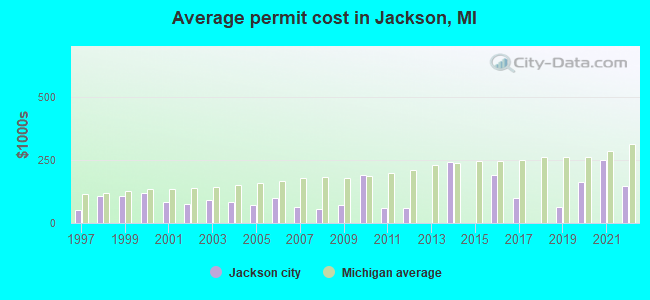
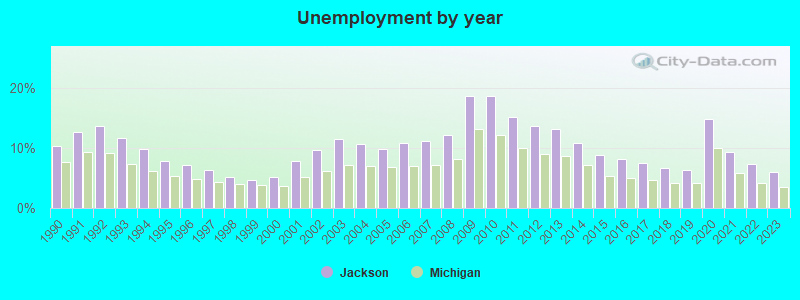
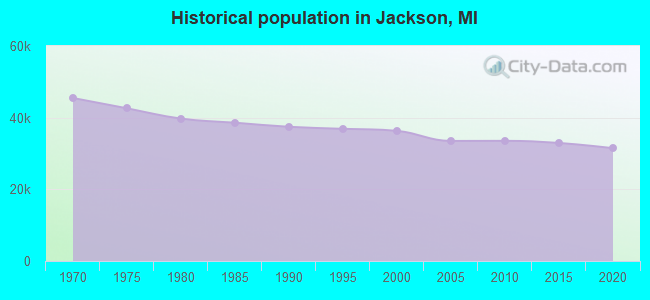
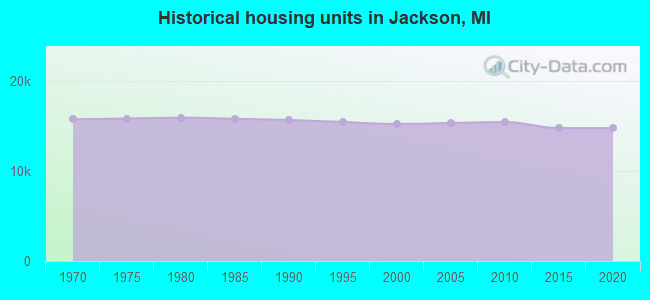
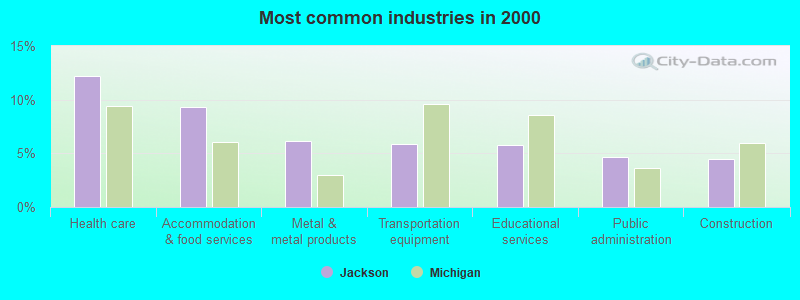
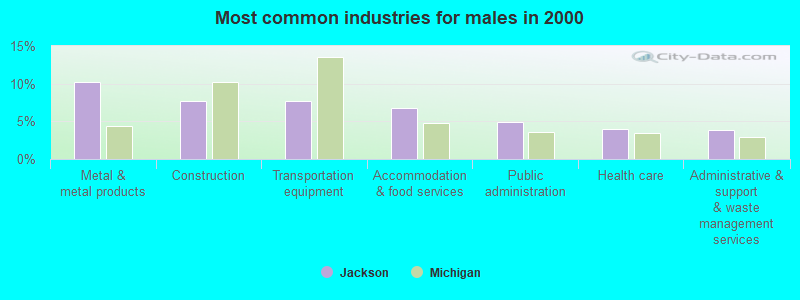
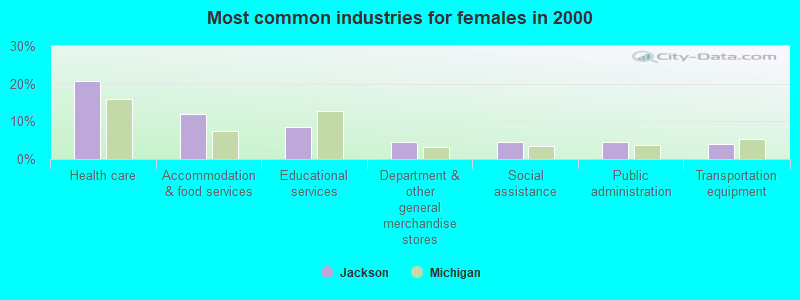
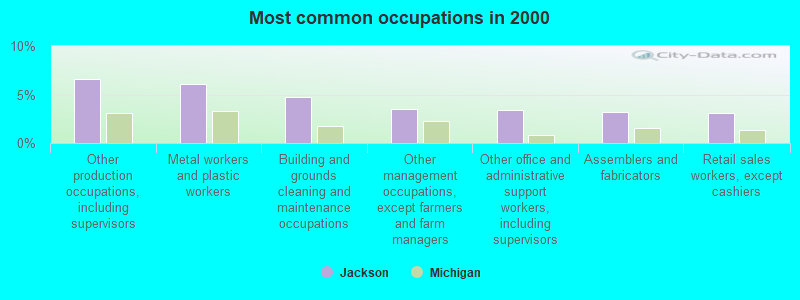
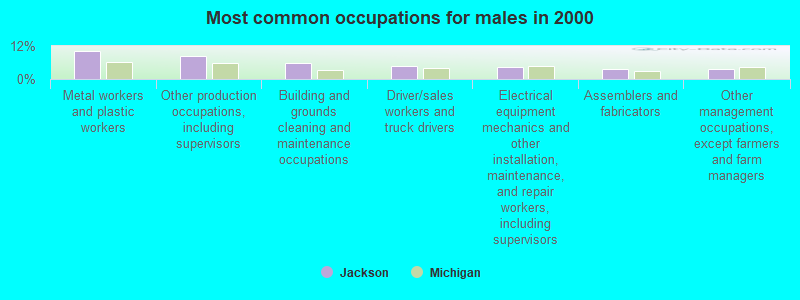
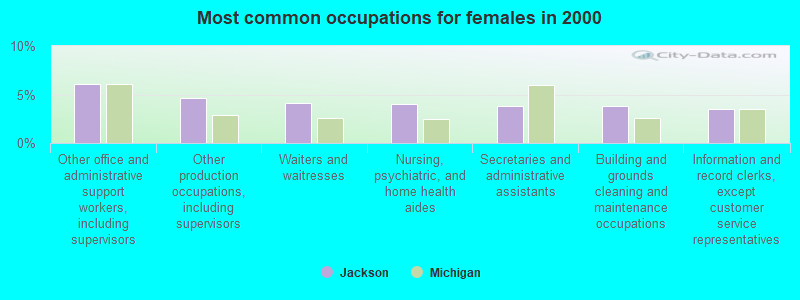
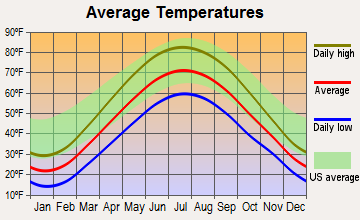
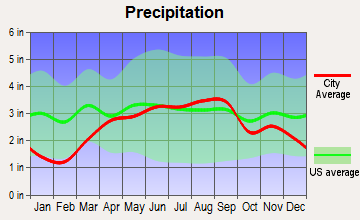
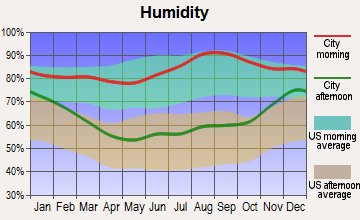
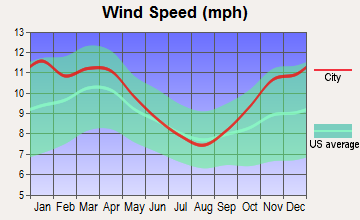
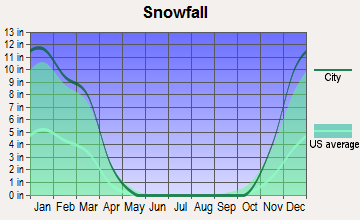
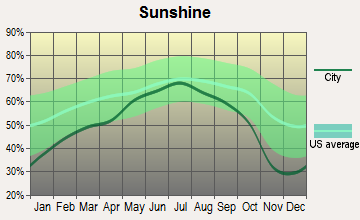
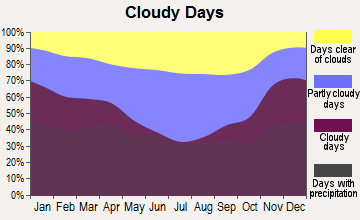
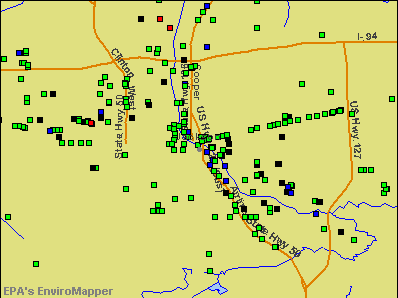

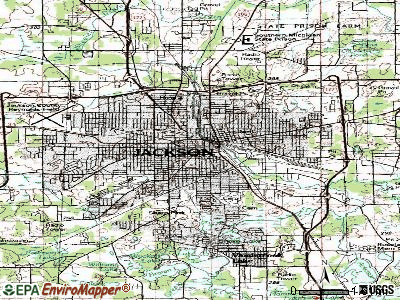
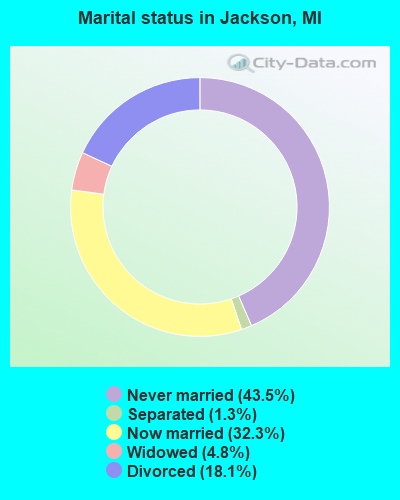

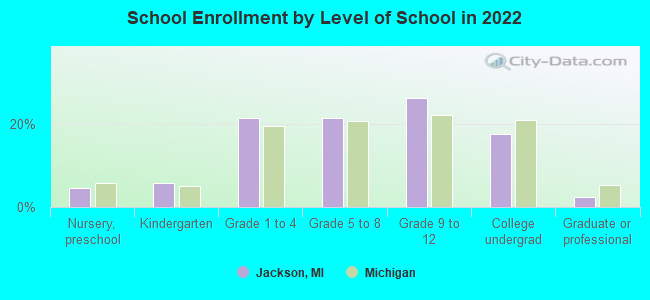
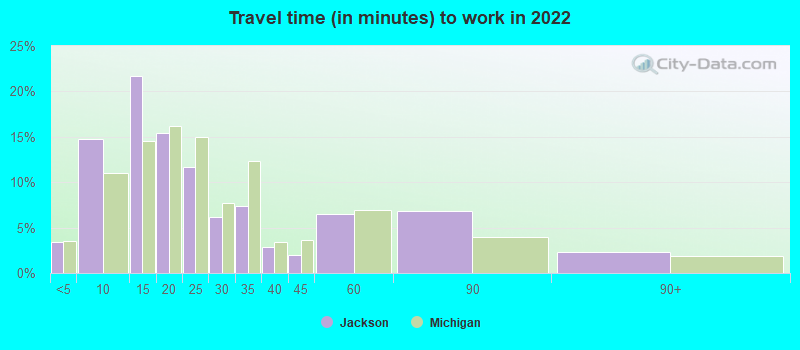
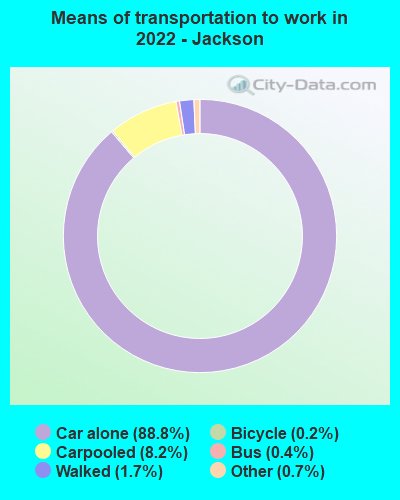
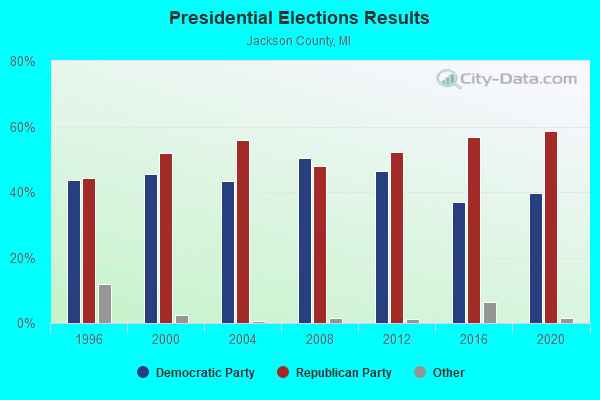
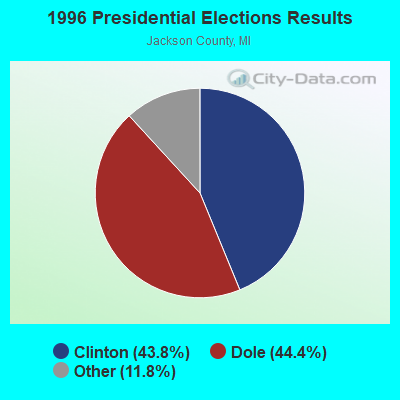
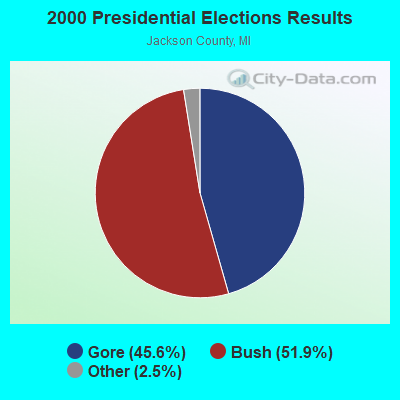
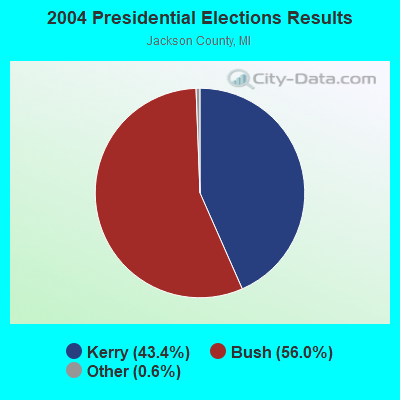
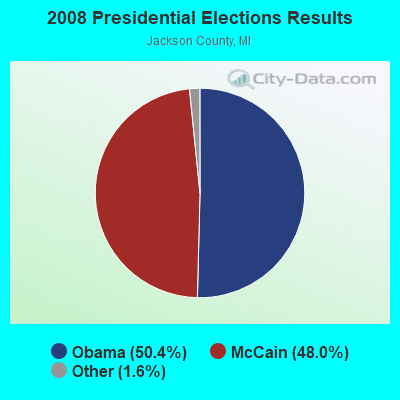
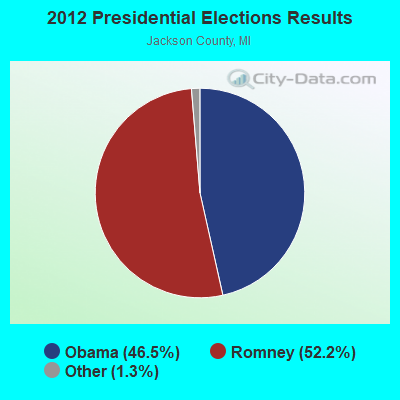
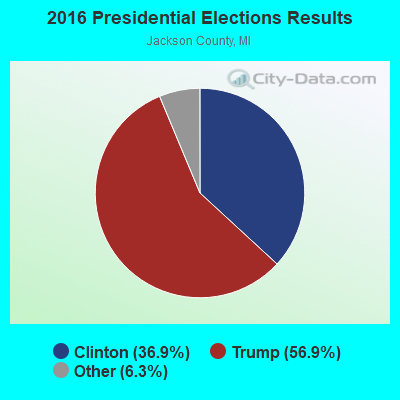
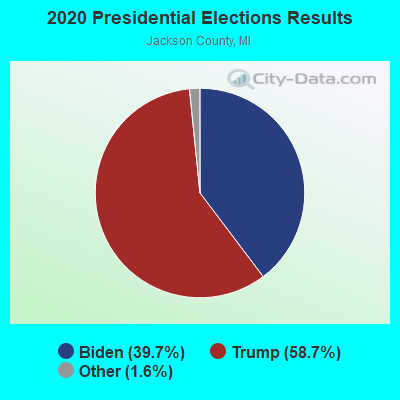
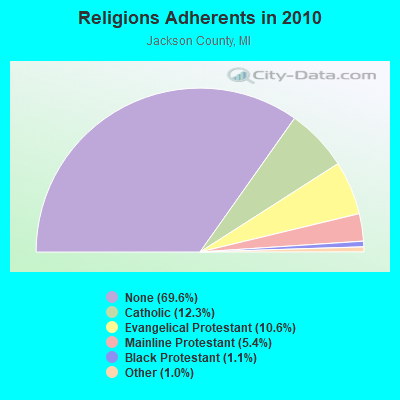
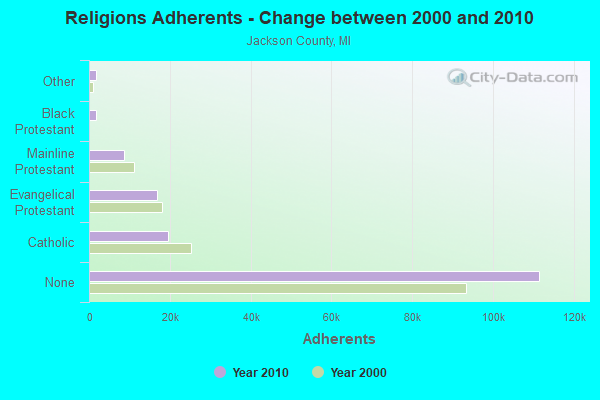
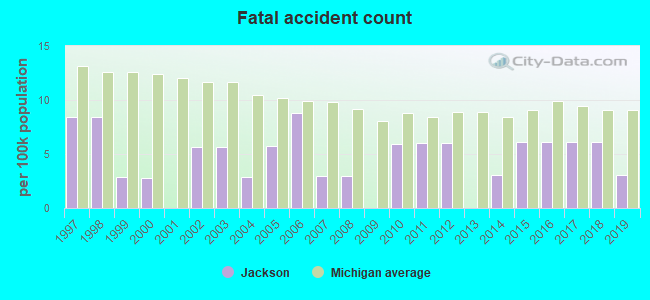
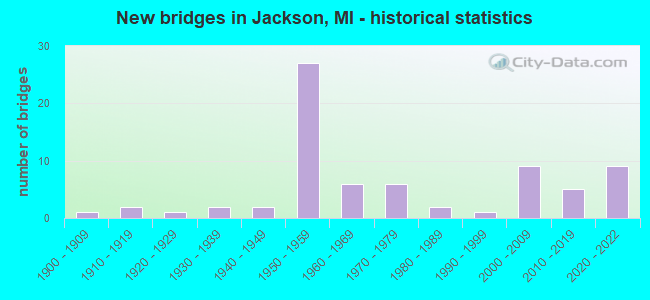
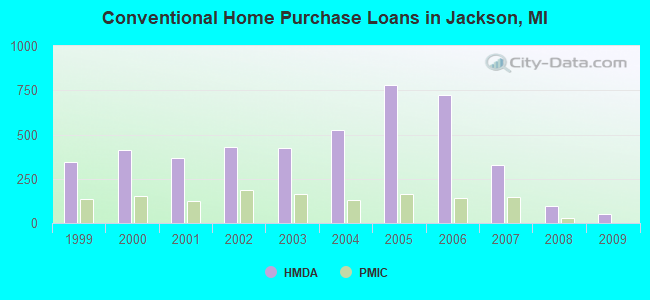
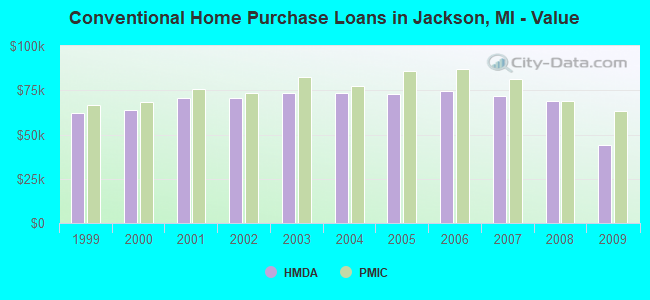
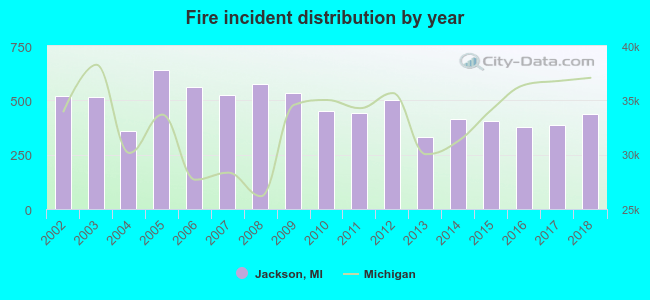 According to the data from the years 2002 - 2018 the average number of fires per year is 469. The highest number of reported fires - 641 took place in 2005, and the least - 331 in 2013. The data has a dropping trend.
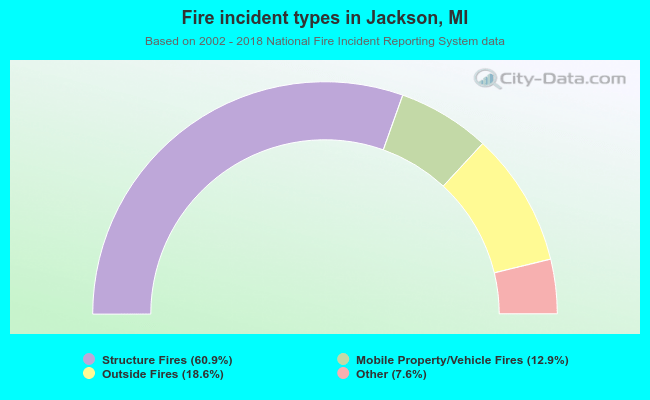 When looking into fire subcategories, the most incidents belonged to: Structure Fires (60.9%), and Outside Fires (18.6%).