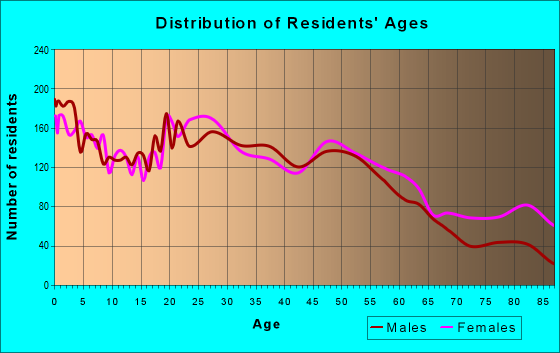
Estimated zip code population in 2022: 18,190 Zip code population in 2010: 20,661 Zip code population in 2000: 21,455
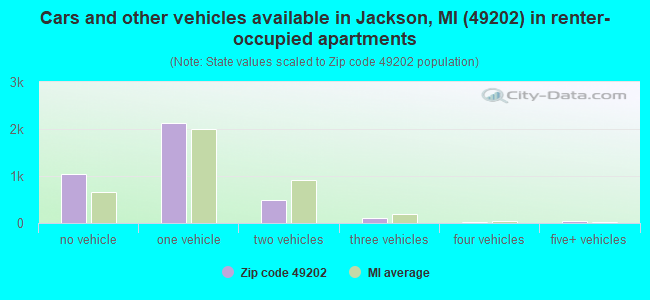
Houses and condos: 9,641 Renter-occupied apartments: 3,816
% of renters here:
44%
State:
27%
March 2022 cost of living index in zip code 49202: 82.3 (low, U.S. average is 100)
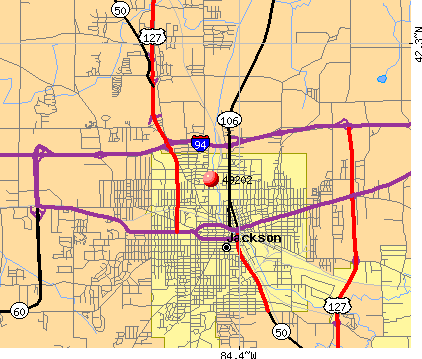
Land area: 13.9 sq. mi. Water area: 0.0 sq. mi.
Population density: 1,305 people per square mile
(low).
OSM Map
General Map
Google Map
MSN Map
OSM Map
General Map
Google Map
MSN Map
OSM Map
General Map
Google Map
MSN Map
OSM Map
General Map
Google Map
MSN Map
Please wait while loading the map...
Real estate property taxes paid for housing units in 2022:
This zip code:
1.5% ($1,581)
Michigan:
1.2% ($2,746)
Median real estate property taxes paid for housing units with mortgages in 2022: $1,675 (1.6%) Median real estate property taxes paid for housing units with no mortgage in 2022: $1,468 (1.4%)
Averages for the 2020 tax year for zip code 49202, filed in 2021:
Average Adjusted Gross Income (AGI) in 2020: $37,045 (Individual Income Tax Returns)
Here:
$37,045
State:
$68,945
Salary/wage: $34,109 (reported on 79.5% of returns)
Here:
$34,109
State:
$57,142
(% of AGI for various income ranges: 1009.0% for AGIs below $25k, 3322.9% for AGIs $25k-50k, 6112.6% for AGIs $50k-75k, 9089.5% for AGIs $75k-100k, 13772.0% for AGIs $100k-200k)
Taxable interest for individuals: $697 (reported on 19.4% of returns)
This zip code:
$697
Michigan:
$1,630
(% of AGI for various income ranges: 9.4% for AGIs below $25k, 9.5% for AGIs $25k-50k, 18.9% for AGIs $50k-75k, 45.9% for AGIs $75k-100k, 146.0% for AGIs $100k-200k)
Ordinary dividends: $3,856 (reported on 7.9% of returns)
Here:
$3,856
State:
$6,972
(% of AGI for various income ranges: 11.8% for AGIs below $25k, 19.1% for AGIs $25k-50k, 33.2% for AGIs $50k-75k, 137.3% for AGIs $75k-100k, 436.8% for AGIs $100k-200k)
Net capital gain/loss in AGI: +$5,544 (reported on 6.8% of returns)
Here:
+$5,544
State:
+$20,064
(% of AGI for various income ranges: 4.9% for AGIs below $25k, 11.0% for AGIs $25k-50k, 26.6% for AGIs $50k-75k, 123.0% for AGIs $75k-100k, 900.8% for AGIs $100k-200k)
Profit/loss from business: +$6,438 (reported on 8.7% of returns)
Here:
+$6,438
State:
+$11,172
(% of AGI for various income ranges: 70.3% for AGIs below $25k, 65.5% for AGIs $25k-50k, 65.0% for AGIs $50k-75k, 126.8% for AGIs $75k-100k, 125.2% for AGIs $100k-200k)
Taxable individual retirement arrangement distribution: $12,188 (reported on 7.2% of returns)
49202:
$12,188
Michigan:
$19,803
(% of AGI for various income ranges: 53.1% for AGIs below $25k, 64.2% for AGIs $25k-50k, 151.3% for AGIs $50k-75k, 384.6% for AGIs $75k-100k, 768.0% for AGIs $100k-200k)
Total itemized deductions: $28,472 (reported on 2.0% of returns)
Here:
$28,472
State:
$34,117
(% of AGI for various income ranges: 30.7% for AGIs below $25k, 32.0% for AGIs $25k-50k, 84.9% for AGIs $50k-75k, 260.8% for AGIs $75k-100k, 667.2% for AGIs $100k-200k)
Charity contributions: $8,608 (reported on 1.3% of returns)
Here:
$8,608
State:
$13,548
(% of AGI for various income ranges: 6.4% for AGIs $25k-50k, 21.0% for AGIs $50k-75k, 48.4% for AGIs $75k-100k, 194.0% for AGIs $100k-200k)
Taxes paid: $4,224 (reported on 1.9% of returns)
49202:
$4,224
State:
$7,972
(% of AGI for various income ranges: 1.8% for AGIs below $25k, 3.6% for AGIs $25k-50k, 14.6% for AGIs $50k-75k, 50.0% for AGIs $75k-100k, 99.2% for AGIs $100k-200k)
Earned income credit: $2,332 (reported on 23.4% of returns)
Here:
$2,332
State:
$2,251
(% of AGI for various income ranges: 102.8% for AGIs below $25k, 81.3% for AGIs $25k-50k, 1.8% for AGIs $50k-75k)
Percentage of individuals using paid preparers for their 2020 taxes: 93.6%
Here:
94%
State:
93%
(% for various income ranges: 92.9% for AGIs below $25k, 95.0% for AGIs $25k-50k, 93.7% for AGIs $50k-75k, 90.4% for AGIs $75k-100k, 92.1% for AGIs $100k-200k, 100.0% for AGIs over 200k)
Averages for the 2012 tax year for zip code 49202, filed in 2013:
Average Adjusted Gross Income (AGI) in 2012: $31,155 (Individual Income Tax Returns)
Here:
$31,155
State:
$55,609
Salary/wage: $29,319 (reported on 81.5% of returns)
Here:
$29,319
State:
$46,782
(% of AGI for various income ranges: 73.6% for AGIs below $25k, 82.7% for AGIs $25k-50k, 80.4% for AGIs $50k-75k, 77.8% for AGIs $75k-100k, 81.5% for AGIs $100k-200k)
Taxable interest for individuals: $1,041 (reported on 22.0% of returns)
This zip code:
$1,041
Michigan:
$1,491
(% of AGI for various income ranges: 1.1% for AGIs below $25k, 0.4% for AGIs $25k-50k, 0.7% for AGIs $50k-75k, 1.1% for AGIs $75k-100k, 0.7% for AGIs $100k-200k)
Ordinary dividends: $3,778 (reported on 10.0% of returns)
Here:
$3,778
State:
$6,225
(% of AGI for various income ranges: 0.9% for AGIs below $25k, 0.6% for AGIs $25k-50k, 1.1% for AGIs $50k-75k, 1.7% for AGIs $75k-100k, 3.8% for AGIs $100k-200k)
Net capital gain/loss in AGI: +$3,484 (reported on 7.0% of returns)
Here:
+$3,484
State:
+$9,326
(% of AGI for various income ranges: 0.3% for AGIs $25k-50k, 0.3% for AGIs $50k-75k, 0.3% for AGIs $75k-100k, 6.2% for AGIs $100k-200k)
Profit/loss from business: +$5,766 (reported on 9.5% of returns)
Here:
+$5,766
State:
+$11,523
(% of AGI for various income ranges: 5.0% for AGIs below $25k, 1.4% for AGIs $25k-50k, 0.7% for AGIs $50k-75k, 0.9% for AGIs $75k-100k, 0.2% for AGIs $100k-200k)
Taxable individual retirement arrangement distribution: $10,445 (reported on 9.0% of returns)
49202:
$10,445
Michigan:
$15,298
(% of AGI for various income ranges: 3.2% for AGIs below $25k, 2.7% for AGIs $25k-50k, 2.9% for AGIs $50k-75k, 3.0% for AGIs $75k-100k, 4.9% for AGIs $100k-200k)
Total itemized deductions: $15,338 (25% of AGI, reported on 13.6% of returns)
Here:
$15,338
State:
$21,628
Here:
24.5% of AGI
State:
18.4% of AGI
(% of AGI for various income ranges: 5.4% for AGIs below $25k, 5.0% for AGIs $25k-50k, 7.5% for AGIs $50k-75k, 6.8% for AGIs $75k-100k, 15.1% for AGIs $100k-200k)
Charity contributions: $3,031 (reported on 9.2% of returns)
Here:
$3,031
State:
$4,225
(% of AGI for various income ranges: 0.4% for AGIs below $25k, 0.5% for AGIs $25k-50k, 1.0% for AGIs $50k-75k, 0.9% for AGIs $75k-100k, 3.0% for AGIs $100k-200k)
Taxes paid: $4,213 (reported on 13.6% of returns)
49202:
$4,213
State:
$8,327
(% of AGI for various income ranges: 0.9% for AGIs below $25k, 1.3% for AGIs $25k-50k, 2.1% for AGIs $50k-75k, 2.1% for AGIs $75k-100k, 5.2% for AGIs $100k-200k)
Earned income credit: $2,374 (reported on 28.8% of returns)
Here:
$2,374
State:
$2,306
(% of AGI for various income ranges: 8.6% for AGIs below $25k, 1.2% for AGIs $25k-50k)
Percentage of individuals using paid preparers for their 2012 taxes: 49.1%
Here:
49%
State:
57%
(% for various income ranges: 46.6% for AGIs below $25k, 50.4% for AGIs $25k-50k, 54.5% for AGIs $50k-75k, 52.4% for AGIs $75k-100k, 63.6% for AGIs $100k-200k)
Averages for the 2004 tax year for zip code 49202, filed in 2005:
Average Adjusted Gross Income (AGI) in 2004: $29,122 (Individual Income Tax Returns)
Here:
$29,122
State:
$48,204
Salary/wage: $28,600 (reported on 83.8% of returns)
Here:
$28,600
State:
$42,791
(% of AGI for various income ranges: 73.5% for AGIs below $10k, 75.7% for AGIs $10k-25k, 86.5% for AGIs $25k-50k, 85.8% for AGIs $50k-75k, 87.9% for AGIs $75k-100k, 60.0% for AGIs over 100k)
Taxable interest for individuals: $1,692 (reported on 33.2% of returns)
This zip code:
$1,692
Michigan:
$1,725
(% of AGI for various income ranges: 4.9% for AGIs below $10k, 2.9% for AGIs $10k-25k, 1.2% for AGIs $25k-50k, 1.1% for AGIs $50k-75k, 1.2% for AGIs $75k-100k, 6.1% for AGIs over 100k)
Taxable dividends: $2,768 (reported on 13.0% of returns)
Here:
$2,768
State:
$3,420
(% of AGI for various income ranges: 2.0% for AGIs below $10k, 1.5% for AGIs $10k-25k, 0.7% for AGIs $25k-50k, 1.0% for AGIs $50k-75k, 0.6% for AGIs $75k-100k, 4.7% for AGIs over 100k)
Net capital gain/loss: +$5,661 (reported on 9.2% of returns)
Here:
+$5,661
State:
+$8,532
(% of AGI for various income ranges: -0.8% for AGIs below $10k, 0.4% for AGIs $10k-25k, 0.3% for AGIs $25k-50k, 0.7% for AGIs $50k-75k, 1.1% for AGIs $75k-100k, 19.9% for AGIs over 100k)
Profit/loss from business: +$4,643 (reported on 8.8% of returns)
Here:
+$4,643
State:
+$9,547
(% of AGI for various income ranges: 5.7% for AGIs below $10k, 2.8% for AGIs $10k-25k, 1.0% for AGIs $25k-50k, 0.9% for AGIs $50k-75k, 0.8% for AGIs $75k-100k, 0.2% for AGIs over 100k)
IRA payment deduction: $2,552 (reported on 1.5% of returns)
49202:
$2,552
Michigan:
$2,875
(% of AGI for various income ranges: 0.2% for AGIs $10k-25k, 0.1% for AGIs $25k-50k, 0.1% for AGIs $50k-75k, 0.2% for AGIs $75k-100k)
Total itemized deductions: $12,631 (25% of AGI, reported on 20.1% of returns)
Here:
$12,631
State:
$18,509
Here:
25.0% of AGI
State:
20.7% of AGI
(% of AGI for various income ranges: 6.5% for AGIs below $10k, 6.9% for AGIs $10k-25k, 8.5% for AGIs $25k-50k, 8.6% for AGIs $50k-75k, 11.3% for AGIs $75k-100k, 12.4% for AGIs over 100k)
Charity contributions deductions: $2,090 (4% of AGI, reported on 15.0% of returns)
Here:
$2,090
State:
$3,365
Here:
3.9% of AGI
State:
3.6% of AGI
(% of AGI for various income ranges: 0.4% for AGIs below $10k, 0.6% for AGIs $10k-25k, 0.8% for AGIs $25k-50k, 1.1% for AGIs $50k-75k, 1.7% for AGIs $75k-100k, 3.1% for AGIs over 100k)
Total tax: $3,270 (reported on 67.5% of returns)
49202:
$3,270
State:
$7,691
(% of AGI for various income ranges: 1.7% for AGIs below $10k, 3.6% for AGIs $10k-25k, 7.0% for AGIs $25k-50k, 8.8% for AGIs $50k-75k, 10.6% for AGIs $75k-100k, 15.1% for AGIs over 100k)
Earned income credit: $1,709 (reported on 22.2% of returns)
Here:
$1,709
State:
$1,737
Percentage of individuals using paid preparers for their 2004 taxes: 56.3%
Here:
56%
State:
60%
(% for various income ranges: 54.5% for AGIs below $10k, 57.1% for AGIs $10k-25k, 55.5% for AGIs $25k-50k, 58.7% for AGIs $50k-75k, 56.0% for AGIs $75k-100k, 62.4% for AGIs over 100k)
Likely homosexual households (counted as self-reported same-sex unmarried-partner households)
Lesbian couples: 0.3% of all households
Gay men: 0.0% of all households
Household received Food Stamps/SNAP in the past 12 months: 1,673 Household did not receive Food Stamps/SNAP in the past 12 months: 7,081
Women who had a birth in the past 12 months: 261 (119 now married, 138 unmarried) Women who did not have a birth in the past 12 months: 4,500 (1,261 now married, 3,250 unmarried)
Housing units in zip code 49202 with a mortgage: 2,885 (160 second mortgage, 134 both second mortgage and home equity loan) Houses without a mortgage: 62
Median monthly owner costs for units with a mortgage: $915 Median monthly owner costs for units without a mortgage: $411
Residents with income below the poverty level in 2022:
This zip code:
20.6%
Whole state:
13.4%
Residents with income below 50% of the poverty level in 2022:
This zip code:
9.9%
Whole state:
6.9%
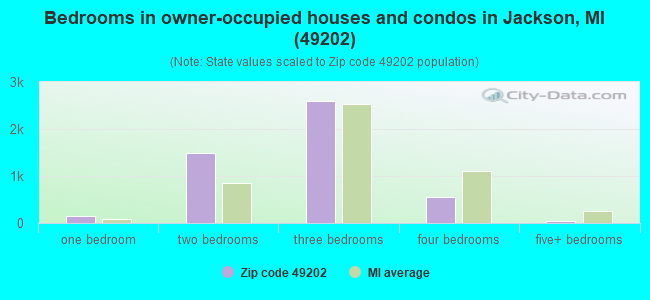
Median number of rooms in houses and condos:
Here:
6.0
State:
6.5
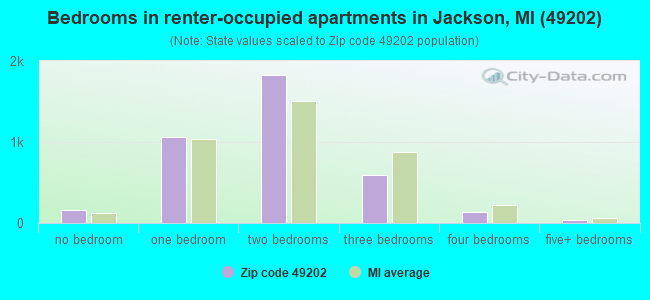
Median number of rooms in apartments:
Here:
4.0
State:
4.3
Notable locations in this zip code not listed on our city pages
Notable locations in zip code 49202: Jackson District Library-Meijer Branch (A), Blackman Township Department of Public Safety Station 2 (B). Display/hide their locations on the map
Churches in zip code 49202 include: Faith Bible Church (A), Sycamore Church (B), Bethel Church (C), Central Wesleyan Church (D), Pentecostal Church of God (E), Corinthian Spiritualist Church (F), Stream in the Desert Ministries (G), Redemption Church of Our Lord (H), Saint Joseph Catholic Church (I). Display/hide their locations on the map
Cemeteries: Cradit Cemetery (1), Hillcrest Memorial Park Cemetery (2), Fifield Cemetery (3), McArthur Cemetery (4), Odd Fellows Cemetery (5). Display/hide their locations on the map
Parks in zip code 49202 include: First State Prison Historical Marker (1), Kiawanis Playground (2), William J Nixon Memorial Park (3), Lions Park (4), Optimist Park (5). Display/hide their locations on the map
1,709 married couples with children.
2,083 single-parent households (242 men, 1,841 women).
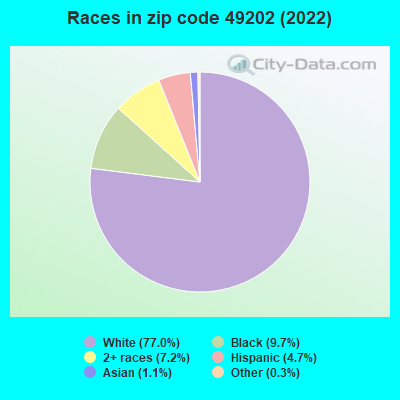
94.4% of residents of 49202 zip code speak English at home.
2.5% of residents speak Spanish at home (51% very well, 40% well, 9% not well).
0.8% of residents speak other Indo-European language at home (95% very well, 5% well).
1.2% of residents speak Asian or Pacific Island language at home (98% very well, 2% well).
0.9% of residents speak other language at home (100% very well).
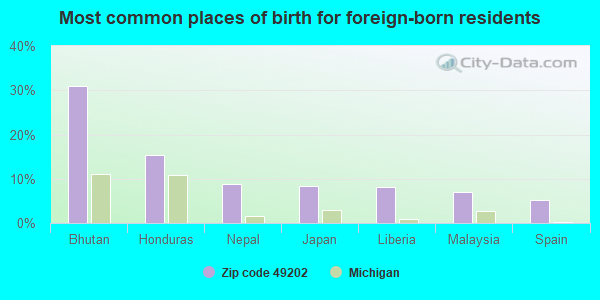
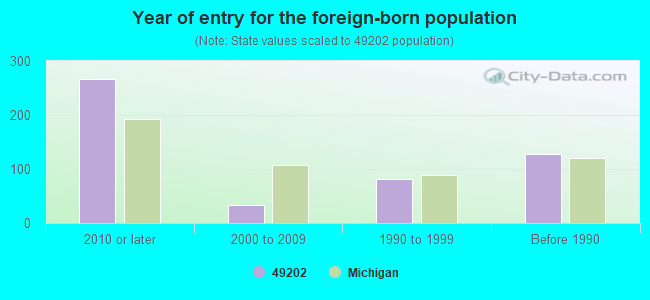
Foreign born population: 427 (2.4%) (27.7% of them are naturalized citizens)
Major facilities with environmental interests located in this zip code:
MECHANICAL PRODUCTS (1824 RIVER ST in JACKSON, MI)
AIR MINOR (AIRS/AFS) COMPLIANCE ACTIVITY (Tracking inspections of insecticide, fungicide, and rodenticide, and toxic substances) CRITERIA AND HAZARDOUS AIR POLLUTANT INVENTORY (Inventory of air pollution sources) National Pollutant Discharge Elimination System NON-MAJOR (Tracking pollutant discharge elimination systems) - permit Conditionally Exempt Small Quantity Generators, less than 100 kg/month of hazardous waste (Resource Conservation and Recovery Act (tracking hazardous waste)) Business SIC classification: SWITCHGEAR AND SWITCHBOARD APPARATUS; NONCLASSIFIABLE ESTABLISHMENTS Business NAICS classification: SWITCHGEAR AND SWITCHBOARD APPARATUS MANUFACTURING. Organizations: MECHANICAL PRODUCTS LLC (CONTACT/OPERATOR)
, YALE INTERNATIONAL (CONTACT/OWNER)
EAST JACKSON HIGH SCHOOL (1566 N. SUTTON ROAD in JACKSON, MI)
(Geographic Names Information System) (National Center for Education Statistics) - STATE ID-01017 Organizations: EAST JACKSON COMMUNITY SCHOOLS (SCHOOL DISTRICT)
BENNETT SCHOOL (820 BENNETT STREET in JACKSON, MI)
(Geographic Names Information System) (National Center for Education Statistics) - STATE ID-00278 Organizations: JACKSON PUBLIC SCHOOLS (SCHOOL DISTRICT)
EATON AEROSPACE CORP (2500 WEST ARGYLE STREET in JACKSON, MI)
HAZARDOUS WASTE BIENNIAL REPORTER (Resource Conservation and Recovery Act (tracking hazardous waste)) Large Quantity Generators, more that 1000 kg of hazardous waste/month (Resource Conservation and Recovery Act (tracking hazardous waste)) TRI REPORTER (Tracking of toxic chemicals releasing facilities) Business SIC classification: FLUID POWER VALVES AND HOSE FITTINGS Organizations: EATON AEROQUIP, INC. (CONTACT/OPERATOR)
, EATON CORPORATION (CONTACT/OWNER)
, TRINOVA CORP MASTER TRUST (CONTACT/OWNER)
Alternative names: AEROQUIP CORP, AEROQUIP CORPORATION COUPLING PRODUCTS DIVISION, EATON AEROQUIP CORP
MEMORIAL SCHOOL (345 N. DETTMAN ROAD in JACKSON, MI)
(National Center for Education Statistics) - STATE ID-00989 Organizations: EAST JACKSON COMMUNITY SCHOOLS (SCHOOL DISTRICT)
AMY FIRTH MIDDLE SCHOOL (205 SEYMOUR STREET in JACKSON, MI)
(National Center for Education Statistics) - STATE ID-06417 Organizations: JACKSON PUBLIC SCHOOLS (SCHOOL DISTRICT)
ALLIED CHUCKER & ENG (3529 SCHEELE DR in JACKSON, MI)
AIR MAJOR (AIRS/AFS) CRITERIA AND HAZARDOUS AIR POLLUTANT INVENTORY (Inventory of air pollution sources) (Resource Conservation and Recovery Act (tracking hazardous waste)) Business SIC classification: INDUSTRIAL AND COMMERCIAL MACHINERY AND EQUIPMENT Organizations: ALLIED CHUCKER & ENGINEERING COMPANY (CONTACT/OPERATOR)
Alternative names: ALLIED CHUCKER & ENGINEERING CO
AMOCO OIL CO 0004 (2500 AIRPORT RD in JACKSON, MI)
(Resource Conservation and Recovery Act (tracking hazardous waste)) Organizations: AMOCO OIL COMPANY (CONTACT/OWNER)
, BP PRODUCTS NORTH AMERICA INC (CONTACT/OWNER)
AMOCO OIL CO (3318 E MICHIGAN in JACKSON, MI)
(Resource Conservation and Recovery Act (tracking hazardous waste)) Organizations: AMOCO OIL COMPANY (CONTACT/OWNER)
, BP PRODUCTS NORTH AMERICA INC (CONTACT/OWNER)
Alternative names: AMOCO OIL CO 5367
FOURWAY MACHINE SALES CO (3215 GREGORY RD in JACKSON, MI)
HAZARDOUS WASTE BIENNIAL REPORTER (Resource Conservation and Recovery Act (tracking hazardous waste)) Large Quantity Generators, more that 1000 kg of hazardous waste/month (Resource Conservation and Recovery Act (tracking hazardous waste)) - notification Business NAICS classification: MACHINE TOOL (METAL CUTTING TYPES) MANUFACTURING. Organizations: HINKLEY LYNN (CONTACT/OPERATOR)
EATON CORP (2425 W MICHIGAN AVE in JACKSON, MI)
AIR SYNTHETIC MINOR (AIRS/AFS) CRITERIA AND HAZARDOUS AIR POLLUTANT INVENTORY (Inventory of air pollution sources) Small Quantity Generators, between 100 kg and 1000 kg of hazardous waste/month (Resource Conservation and Recovery Act (tracking hazardous waste)) - notification Business SIC classification: FLUID POWER CYLINDERS AND ACTUATORS Business NAICS classification: FLUID POWER CYLINDER AND ACTUATOR MANUFACTURING. Organizations: EATON CORPORATION (CONTACT/OPERATOR)
Alternative names: EATON HYDRAULICS INC, VICKERS INC
B & R GEAR CO (2102 RIVER ST in JACKSON, MI)
(Resource Conservation and Recovery Act (tracking hazardous waste)) Business NAICS classification: MACHINE TOOL (METAL CUTTING TYPES) MANUFACTURING. Organizations: MIKE NULL (CONTACT/OPERATOR)
Housing units lacking complete plumbing facilities: 3.3% Housing units lacking complete kitchen facilities: 3.9%
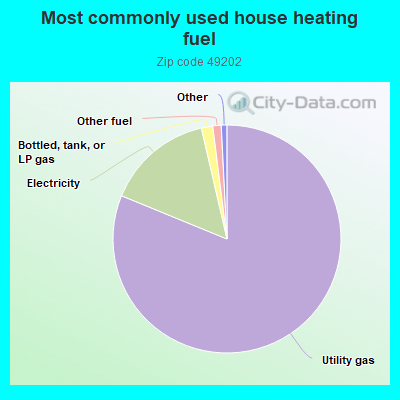
81.2%Utility gas
15.2%Electricity
1.6%Bottled, tank, or LP gas
1.2%Other fuel
Population in 1990: 20,387. Population change in the 1990s: +1,068 (+5.2%).
Place of birth for U.S.-born residents:
This state: 15,416
Northeast: 108
Midwest: 812
South: 1,139
West: 174
53% of the 49202 zip code residents lived in the same house 5 years ago. Out of people who lived in different houses, 72% lived in this county. Out of people who lived in different counties, 50% lived in Michigan.
91% of the 49202 zip code residents lived in the same house 1 year ago. Out of people who lived in different houses, 51% moved from this county. Out of people who lived in different houses, 32% moved from different county within same state. Out of people who lived in different houses, 14% moved from different state. Out of people who lived in different houses, 3% moved from abroad.
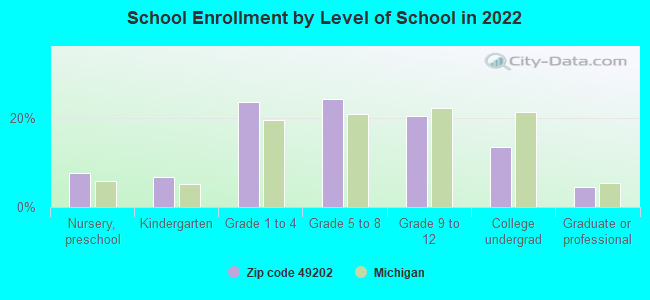
Private vs. public school enrollment:
Students in private schools in grades 1 to 8 (elementary and middle school): 283
Here:
15.3%
Michigan:
12.4%
Students in private schools in grades 9 to 12 (high school): 13
Here:
1.7%
Michigan:
9.8%
Students in private undergraduate colleges: 23
Here:
4.4%
Michigan:
14.9%
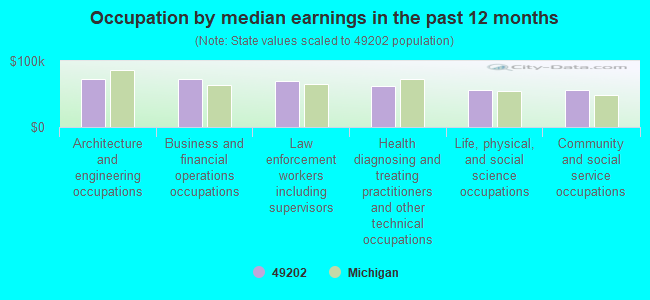
Occupation by median earnings in the past 12 months ($)
73,483Architecture and engineering occupations
72,894Business and financial operations occupations
69,308Law enforcement workers including supervisors
61,617Health diagnosing and treating practitioners and other technical occupations
56,695Life, physical, and social science occupations
56,171Community and social service occupations
Companies with federal contracts located in this zip code (JACKSON, MI):
MECHANICAL PRODUCTS INC (1824 RIVER ST) : $2,357,677 in 40 contractsfrom 1999 to 2005
Contracts for Circuit Breakers by Defense Logistics Agency, Navy Signed by year:2000: $275,594; 2001: $1,031,497; 2002: $0; 2003: $0; 2004: $89,368; 2005: $916,127; 2006: $0.
Biggest contracts:
$321,355 with Defense Logistics Agency for Circuit Breakers. Signed on 2001-04-18. Completion date: 2001-09-15.
$319,703 with Defense Logistics Agency for Circuit Breakers. Taking place in FL. Signed on 2005-12-22. Completion date: 2006-03-22.
$284,037 with Defense Logistics Agency for Circuit Breakers. Signed on 2005-06-20. Completion date: 2005-09-18.
$246,458, same as above.Signed on 2000-09-26. Completion date: 2001-01-24.
SEALANDAIRE TECHNOLOGIES INC (1510 SPRINGPORT RD STE C; small business) : $1,970,133 in 8 contractsfrom 2001 to 2006
Contracts for Communications Studies, Defense Electronics and Communication Equipment -- Basic Research (R&D), Combination and Miscellaneous Instruments by Navy Signed by year:2000: $0; 2001: $49,320; 2002: $0; 2003: $0; 2004: $74,396; 2005: $1,816,703; 2006: $29,714.
Biggest contracts:
$1,595,934 with Navy for Communications Studies. Signed on 2005-05-02. Completion date: 2007-05-01.
$79,997 with Navy for Defense Electronics and Communication Equipment -- Basic Research (R&D). Signed on 2005-05-12. Completion date: 2005-11-12.
$74,396, same as above.Signed on 2004-12-13. Completion date: 2005-06-13.
$68,514, same as above.Signed on 2005-06-28. Completion date: 2006-04-01.
NORTHWEST HOTELS INC (2000 HOLIDAY INN DR; small business) : $38,521 in 2 contractsin 2006
$34,145 with Army for Lodging - Hotel/Motel. Signed on 2006-05-25. Completion date: 2006-06-02.
$4,376, same as above.Signed on 2006-05-12. Completion date: 2006-05-24.
EATON CORPORATION (2425 W MICHIGAN AVE) : $35,272 in 3 contractsfrom 2004 to 2005
$21,000 with Navy for Valves, Nonpowered. Signed on 2005-07-18. Completion date: 2006-05-13.
$10,272 with Navy for Valves, Powered. Signed on 2005-04-06. Completion date: 2005-12-11.
$4,000 with Navy for Valves, Nonpowered. Signed on 2004-12-06. Completion date: 2005-06-23.
BUCKHEAD AMERICA CORPORATION (1111 BOARDMAN RD; small business) : $28,047 in 2 contractsfrom 2002 to 2003
$27,602 with Army for Lodging - Hotel/Motel. Signed on 2002-10-07. Completion date: 2002-10-23.
$445, same as above.Signed on 2003-02-03. Completion date: 2002-10-23.
WHITAKER & ASSOCIATES, INC (3018 WILDWOOD AVENUE; small business) : $13,030 in 2 contractsfrom 2003 to 2004
$10,184 with Army for ADP Software. Signed on 2003-12-15. Completion date: 2004-01-15.
$2,846 with Army for ADP Components. Signed on 2004-01-05. Completion date: 2004-02-02.
FREDON HANDLING INC (3590 SCHEELE DR; small business)
$9,066 with Army for Cabinets, Lockers, Bins, and Shelving. Signed on 2005-05-17. Completion date: 2005-06-17.
LARRY E JENNINGS MD PC (3235 E MICHIGAN AVE; small business)
$6,175 with Army for Evaluation and Screening. Signed on 2002-10-01. Completion date: 2003-09-30.
BAKER COLLEGE (2800 SPRINGPORT RD)
$980 with Army for Educational Services. Taking place in MS. Signed on 2003-06-05. Completion date: 2003-06-05.
Top industries in this zip code by the number of employees in 2005:
Administrative and Support and Waste Management and Remediation Services: Temporary Help Services (100-249: 1, 50-99: 1, 20-49: 1, 10-19: 1, 5-9: 1, 1-4: 1)
People in group quarters in 2010:
231 people in local jails and other municipal confinement facilities
133 people in nursing facilities/skilled-nursing facilities
30 people in group homes intended for adults
27 people in correctional facilities intended for juveniles
People in group quarters in 2000:
569 people in nursing homes
78 people in other noninstitutional group quarters
42 people in unknown juvenile institutions
5 people in homes for the mentally retarded
4 people in other nonhousehold living situations
2 people in other group homes
Fatal accident statistics in 2014:
Fatal accident count: 2
Vehicles involved in fatal accidents: 2
Fatal accidents caused by drunken drivers: 0
Fatalities: 2
Persons involved in fatal accidents: 4
Pedestrians involved in fatal accidents: 1
Fatal accident statistics in 2012:
Fatal accident count: 4
Vehicles involved in fatal accidents: 4
Fatal accidents caused by drunken drivers: 3
Fatalities: 4
Persons involved in fatal accidents: 5
Pedestrians involved in fatal accidents: 0
Home Mortgage Disclosure Act Aggregated Statistics For Year 2009 (Based on 3 full and 14 partial tracts)
A) FHA, FSA/RHS & VA Home Purchase Loans
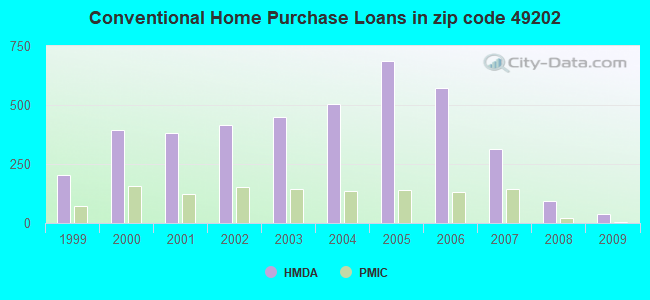
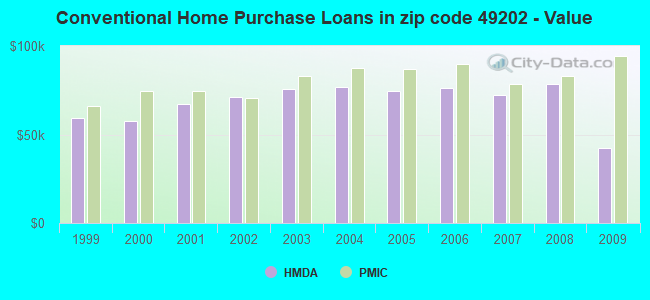
B) Conventional Home Purchase Loans
C) Refinancings
D) Home Improvement Loans
E) Loans on Dwellings For 5+ Families
F) Non-occupant Loans on < 5 Family Dwellings (A B C & D)
G) Loans On Manufactured Home Dwelling (A B C & D)
Number
Average Value
Number
Average Value
Number
Average Value
Number
Average Value
Number
Average Value
Number
Average Value
Number
Average Value
LOANS ORIGINATED
122
$66,872
39
$42,547
248
$85,828
63
$20,841
2
$294,630
34
$37,834
14
$36,757
APPLICATIONS APPROVED, NOT ACCEPTED
9
$47,941
6
$44,930
47
$81,820
6
$15,808
0
$0
10
$64,014
4
$54,045
APPLICATIONS DENIED
26
$71,587
22
$49,211
159
$85,027
50
$28,120
3
$3,639,067
18
$57,815
4
$88,742
APPLICATIONS WITHDRAWN
6
$71,708
1
$27,690
70
$88,408
33
$16,506
0
$0
3
$11,790
0
$0
FILES CLOSED FOR INCOMPLETENESS
2
$19,195
0
$0
20
$79,570
4
$27,778
0
$0
1
$87,700
0
$0
Aggregated Statistics For Year 2008 (Based on 3 full and 14 partial tracts)
A) FHA, FSA/RHS & VA Home Purchase Loans
B) Conventional Home Purchase Loans
C) Refinancings
D) Home Improvement Loans
E) Loans on Dwellings For 5+ Families
F) Non-occupant Loans on < 5 Family Dwellings (A B C & D)
G) Loans On Manufactured Home Dwelling (A B C & D)
Number
Average Value
Number
Average Value
Number
Average Value
Number
Average Value
Number
Average Value
Number
Average Value
Number
Average Value
LOANS ORIGINATED
152
$76,764
94
$78,615
273
$76,043
66
$18,278
4
$1,002,590
73
$62,428
15
$45,569
APPLICATIONS APPROVED, NOT ACCEPTED
18
$67,022
8
$50,936
63
$84,073
7
$109,010
0
$0
7
$50,840
2
$35,480
APPLICATIONS DENIED
21
$71,889
42
$52,184
341
$92,499
81
$31,497
3
$132,637
44
$58,485
11
$81,558
APPLICATIONS WITHDRAWN
12
$68,931
9
$78,788
141
$99,862
27
$26,280
0
$0
4
$71,248
0
$0
FILES CLOSED FOR INCOMPLETENESS
2
$71,870
7
$63,176
23
$79,793
0
$0
0
$0
4
$31,918
1
$38,360
Aggregated Statistics For Year 2007 (Based on 3 full and 14 partial tracts)
A) FHA, FSA/RHS & VA Home Purchase Loans
B) Conventional Home Purchase Loans
C) Refinancings
D) Home Improvement Loans
E) Loans on Dwellings For 5+ Families
F) Non-occupant Loans on < 5 Family Dwellings (A B C & D)
G) Loans On Manufactured Home Dwelling (A B C & D)
Number
Average Value
Number
Average Value
Number
Average Value
Number
Average Value
Number
Average Value
Number
Average Value
Number
Average Value
LOANS ORIGINATED
72
$86,201
314
$72,075
524
$74,678
147
$28,440
0
$0
146
$59,521
18
$74,459
APPLICATIONS APPROVED, NOT ACCEPTED
3
$152,370
34
$72,477
128
$83,730
24
$30,723
0
$0
16
$58,327
6
$76,597
APPLICATIONS DENIED
29
$86,151
91
$70,596
609
$87,686
120
$29,529
1
$260,400
52
$56,576
17
$48,461
APPLICATIONS WITHDRAWN
9
$80,290
34
$65,492
233
$92,652
56
$41,862
0
$0
24
$69,620
3
$74,213
FILES CLOSED FOR INCOMPLETENESS
0
$0
2
$120,955
63
$84,082
4
$60,690
0
$0
4
$60,590
0
$0
Aggregated Statistics For Year 2006 (Based on 3 full and 14 partial tracts)
A) FHA, FSA/RHS & VA Home Purchase Loans
B) Conventional Home Purchase Loans
C) Refinancings
D) Home Improvement Loans
E) Loans on Dwellings For 5+ Families
F) Non-occupant Loans on < 5 Family Dwellings (A B C & D)
G) Loans On Manufactured Home Dwelling (A B C & D)
Number
Average Value
Number
Average Value
Number
Average Value
Number
Average Value
Number
Average Value
Number
Average Value
Number
Average Value
LOANS ORIGINATED
98
$91,079
571
$76,047
732
$73,906
138
$35,746
2
$935,760
209
$75,769
16
$81,318
APPLICATIONS APPROVED, NOT ACCEPTED
7
$68,710
110
$74,382
167
$80,806
19
$46,810
0
$0
30
$71,843
9
$50,076
APPLICATIONS DENIED
21
$80,655
258
$73,487
745
$86,373
136
$43,928
0
$0
106
$81,768
30
$47,559
APPLICATIONS WITHDRAWN
9
$97,356
66
$74,483
308
$93,386
50
$58,254
0
$0
23
$76,793
4
$115,612
FILES CLOSED FOR INCOMPLETENESS
0
$0
32
$86,739
166
$96,502
9
$55,484
0
$0
12
$82,886
0
$0
Aggregated Statistics For Year 2005 (Based on 3 full and 14 partial tracts)
A) FHA, FSA/RHS & VA Home Purchase Loans
B) Conventional Home Purchase Loans
C) Refinancings
D) Home Improvement Loans
E) Loans on Dwellings For 5+ Families
F) Non-occupant Loans on < 5 Family Dwellings (A B C & D)
G) Loans On Manufactured Home Dwelling (A B C & D)
Number
Average Value
Number
Average Value
Number
Average Value
Number
Average Value
Number
Average Value
Number
Average Value
Number
Average Value
LOANS ORIGINATED
93
$95,148
688
$74,788
906
$76,629
180
$35,077
0
$0
216
$70,217
32
$73,287
APPLICATIONS APPROVED, NOT ACCEPTED
44
$105,814
142
$77,476
174
$78,976
33
$25,664
0
$0
40
$79,800
18
$43,974
APPLICATIONS DENIED
27
$94,729
283
$67,765
902
$89,083
144
$40,337
1
$134,920
90
$66,182
34
$55,599
APPLICATIONS WITHDRAWN
10
$92,734
149
$76,581
417
$91,209
62
$83,571
0
$0
32
$65,055
12
$56,048
FILES CLOSED FOR INCOMPLETENESS
3
$82,900
53
$72,844
221
$90,147
8
$50,464
0
$0
6
$77,907
0
$0
Aggregated Statistics For Year 2004 (Based on 3 full and 14 partial tracts)
A) FHA, FSA/RHS & VA Home Purchase Loans
B) Conventional Home Purchase Loans
C) Refinancings
D) Home Improvement Loans
E) Loans on Dwellings For 5+ Families
F) Non-occupant Loans on < 5 Family Dwellings (A B C & D)
G) Loans On Manufactured Home Dwelling (A B C & D)
Number
Average Value
Number
Average Value
Number
Average Value
Number
Average Value
Number
Average Value
Number
Average Value
Number
Average Value
LOANS ORIGINATED
133
$89,797
504
$76,781
966
$79,446
178
$32,327
3
$186,270
147
$69,927
29
$73,723
APPLICATIONS APPROVED, NOT ACCEPTED
40
$98,747
113
$90,033
233
$86,619
25
$35,911
0
$0
13
$66,636
19
$77,144
APPLICATIONS DENIED
45
$88,033
167
$70,348
813
$82,341
129
$33,654
0
$0
58
$67,927
35
$59,655
APPLICATIONS WITHDRAWN
7
$84,586
55
$85,351
319
$88,013
35
$45,852
0
$0
23
$71,339
3
$77,523
FILES CLOSED FOR INCOMPLETENESS
4
$73,730
16
$83,736
223
$83,293
7
$39,487
0
$0
7
$48,661
1
$79,350
Aggregated Statistics For Year 2003 (Based on 3 full and 14 partial tracts)
A) FHA, FSA/RHS & VA Home Purchase Loans
B) Conventional Home Purchase Loans
C) Refinancings
D) Home Improvement Loans
E) Loans on Dwellings For 5+ Families
F) Non-occupant Loans on < 5 Family Dwellings (A B C & D)
Number
Average Value
Number
Average Value
Number
Average Value
Number
Average Value
Number
Average Value
Number
Average Value
LOANS ORIGINATED
154
$90,039
449
$75,472
1,530
$75,177
183
$27,999
3
$536,387
191
$62,505
APPLICATIONS APPROVED, NOT ACCEPTED
6
$110,132
64
$65,747
181
$75,277
30
$19,555
0
$0
24
$59,272
APPLICATIONS DENIED
16
$93,874
158
$62,340
892
$93,343
139
$14,783
2
$124,755
42
$59,811
APPLICATIONS WITHDRAWN
9
$78,924
45
$76,835
299
$80,329
12
$41,239
0
$0
26
$74,523
FILES CLOSED FOR INCOMPLETENESS
17
$74,484
15
$69,542
118
$97,404
3
$44,013
0
$0
4
$45,712
Aggregated Statistics For Year 2002 (Based on 3 full and 14 partial tracts)
A) FHA, FSA/RHS & VA Home Purchase Loans
B) Conventional Home Purchase Loans
C) Refinancings
D) Home Improvement Loans
E) Loans on Dwellings For 5+ Families
F) Non-occupant Loans on < 5 Family Dwellings (A B C & D)
Number
Average Value
Number
Average Value
Number
Average Value
Number
Average Value
Number
Average Value
Number
Average Value
LOANS ORIGINATED
153
$81,240
417
$70,975
1,130
$74,518
146
$19,475
12
$188,011
138
$62,776
APPLICATIONS APPROVED, NOT ACCEPTED
4
$51,602
53
$57,912
177
$67,901
22
$16,564
0
$0
9
$45,433
APPLICATIONS DENIED
22
$79,518
169
$51,111
602
$71,320
103
$17,548
0
$0
35
$46,718
APPLICATIONS WITHDRAWN
9
$79,947
44
$68,471
221
$72,844
12
$37,454
0
$0
12
$57,482
FILES CLOSED FOR INCOMPLETENESS
11
$85,373
11
$57,343
139
$77,634
2
$10,285
0
$0
4
$50,212
Aggregated Statistics For Year 2001 (Based on 3 full and 14 partial tracts)
A) FHA, FSA/RHS & VA Home Purchase Loans
B) Conventional Home Purchase Loans
C) Refinancings
D) Home Improvement Loans
E) Loans on Dwellings For 5+ Families
F) Non-occupant Loans on < 5 Family Dwellings (A B C & D)
Number
Average Value
Number
Average Value
Number
Average Value
Number
Average Value
Number
Average Value
Number
Average Value
LOANS ORIGINATED
161
$75,693
383
$67,358
1,134
$67,043
186
$18,655
1
$125,610
133
$55,028
APPLICATIONS APPROVED, NOT ACCEPTED
6
$57,378
77
$50,786
123
$66,146
48
$30,207
0
$0
12
$50,926
APPLICATIONS DENIED
10
$77,742
290
$52,164
549
$64,026
131
$13,174
0
$0
24
$43,097
APPLICATIONS WITHDRAWN
15
$70,380
22
$49,943
258
$70,464
20
$24,146
0
$0
8
$42,449
FILES CLOSED FOR INCOMPLETENESS
3
$95,413
7
$71,779
82
$64,887
5
$37,482
0
$0
5
$102,524
Aggregated Statistics For Year 2000 (Based on 3 full and 14 partial tracts)
A) FHA, FSA/RHS & VA Home Purchase Loans
B) Conventional Home Purchase Loans
C) Refinancings
D) Home Improvement Loans
E) Loans on Dwellings For 5+ Families
F) Non-occupant Loans on < 5 Family Dwellings (A B C & D)
Number
Average Value
Number
Average Value
Number
Average Value
Number
Average Value
Number
Average Value
Number
Average Value
LOANS ORIGINATED
219
$69,795
395
$57,495
404
$58,126
141
$18,363
4
$261,767
77
$47,561
APPLICATIONS APPROVED, NOT ACCEPTED
10
$56,833
90
$57,467
145
$62,341
61
$15,934
0
$0
13
$41,159
APPLICATIONS DENIED
17
$67,624
476
$44,461
385
$54,543
208
$15,909
0
$0
29
$44,408
APPLICATIONS WITHDRAWN
9
$63,088
34
$70,859
201
$50,617
26
$43,684
0
$0
8
$34,070
FILES CLOSED FOR INCOMPLETENESS
0
$0
15
$52,933
45
$61,307
1
$51,640
0
$0
3
$35,167
Aggregated Statistics For Year 1999 (Based on 2 full and 7 partial tracts)
A) FHA, FSA/RHS & VA Home Purchase Loans
B) Conventional Home Purchase Loans
C) Refinancings
D) Home Improvement Loans
E) Loans on Dwellings For 5+ Families
F) Non-occupant Loans on < 5 Family Dwellings (A B C & D)
2002 - 2018 National Fire Incident Reporting System (NFIRS) incidents
According to the data from the years 2002 - 2018 the average number of fire incidents per year is 70. The highest number of reported fire incidents - 106 took place in 2007, and the least - 34 in 2014. The data has an increasing trend.
When looking into fire subcategories, the most reports belonged to: Structure Fires (61.3%), and Mobile Property/Vehicle Fires (17.8%).
Fire incident types reported to NFIRS in Zip Code 49202


 Nearest zip codes: 49203, 49254, 49277, 49201, 49272, 49234.
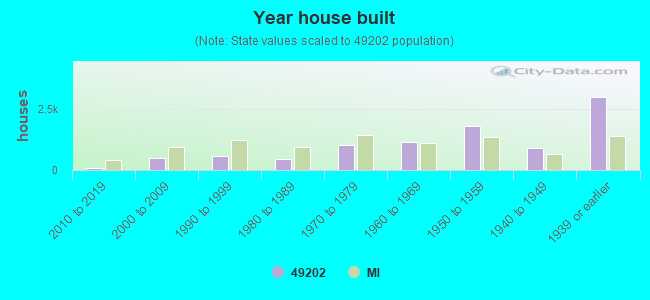


 According to the data from the years 2002 - 2018 the average number of fire incidents per year is 70. The highest number of reported fire incidents - 106 took place in 2007, and the least - 34 in 2014. The data has an increasing trend.
 When looking into fire subcategories, the most reports belonged to: Structure Fires (61.3%), and Mobile Property/Vehicle Fires (17.8%).