Estimated zip code population in 2022: 1,548
Zip code population in 2010: 1,843
Zip code population in 2000: 1,869
Houses and condos: 2,051
Renter-occupied apartments: 77
% of renters here:
10%State:
27%
March 2022 cost of living index in zip code 49309: 81.6
(low, U.S. average is 100)
Land area: 114.0
sq. mi.
Water area: 11.2
sq. mi.
Population density: 14 people per square mile (very low).
OSM Map
General Map
Google Map
MSN Map
OSM Map
General Map
Google Map
MSN Map
OSM Map
General Map
Google Map
MSN Map
OSM Map
General Map
Google Map
MSN Map
Please wait while loading the map...
Real estate property taxes paid for housing units in 2022:
This zip code:
1.0% ($1,220)Michigan:
1.2% ($2,746)
Median real estate property taxes paid for housing units with mortgages in 2022: $1,309 (0.9%)
Median real estate property taxes paid for housing units with no mortgage in 2022: $1,154 (1.0%)
Business Search - 14 Million verified businesses
Males: 816 Females: 731
For population 25 years and over in 49309:
High school or higher: 87.7%Bachelor's degree or higher: 13.2%Graduate or professional degree: 5.1%Unemployed: 4.4%Mean travel time to work (commute): 30.9 minutes
For population 15 years and over in 49309:
Never married: 24.1%Now married: 48.4%Separated: 1.7%Widowed: 9.7%Divorced: 16.1%
Zip code 49309 compared to state average:
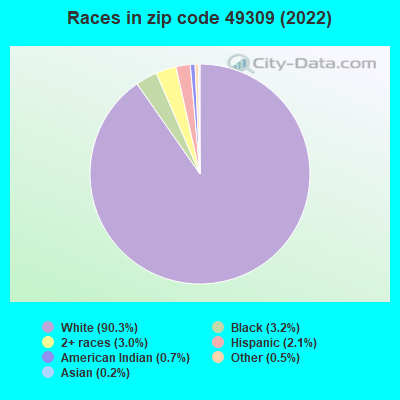
Median household income below state average. Median house value below state average. Black race population percentage significantly below state average. Hispanic race population percentage below state average. Median age significantly above state average. Foreign-born population percentage significantly below state average. Renting percentage significantly below state average. Length of stay since moving in above state average. Number of rooms per house below state average. Number of college students below state average. Percentage of population with a bachelor's degree or higher below state average. 1,393 90.3% White 49 3.2% Black 46 3.0% Two or more races 33 2.1% Hispanic or Latino 11 0.7% American Indian 7 0.5% Some other race 3 0.2% Asian
Data:
Median household income ($)
Median household income (% change since 2000)
Household income diversity
Ratio of average income to average house value (%)
Ratio of average income to average rent
Median household income ($) - White
Median household income ($) - Black or African American
Median household income ($) - Asian
Median household income ($) - Hispanic or Latino
Median household income ($) - American Indian and Alaska Native
Median household income ($) - Multirace
Median household income ($) - Other Race
Median household income for houses/condos with a mortgage ($)
Median household income for apartments without a mortgage ($)
Races - White alone (%)
Races - White alone (% change since 2000)
Races - Black alone (%)
Races - Black alone (% change since 2000)
Races - American Indian alone (%)
Races - American Indian alone (% change since 2000)
Races - Asian alone (%)
Races - Asian alone (% change since 2000)
Races - Hispanic (%)
Races - Hispanic (% change since 2000)
Races - Native Hawaiian and Other Pacific Islander alone (%)
Races - Native Hawaiian and Other Pacific Islander alone (% change since 2000)
Races - Two or more races (%)
Races - Two or more races (% change since 2000)
Races - Other race alone (%)
Races - Other race alone (% change since 2000)
Racial diversity
Unemployment (%)
Unemployment (% change since 2000)
Unemployment (%) - White
Unemployment (%) - Black or African American
Unemployment (%) - Asian
Unemployment (%) - Hispanic or Latino
Unemployment (%) - American Indian and Alaska Native
Unemployment (%) - Multirace
Unemployment (%) - Other Race
Population density (people per square mile)
Population - Males (%)
Population - Females (%)
Population - Males (%) - White
Population - Males (%) - Black or African American
Population - Males (%) - Asian
Population - Males (%) - Hispanic or Latino
Population - Males (%) - American Indian and Alaska Native
Population - Males (%) - Multirace
Population - Males (%) - Other Race
Population - Females (%) - White
Population - Females (%) - Black or African American
Population - Females (%) - Asian
Population - Females (%) - Hispanic or Latino
Population - Females (%) - American Indian and Alaska Native
Population - Females (%) - Multirace
Population - Females (%) - Other Race
Coronavirus confirmed cases (Apr 27, 2024)
Deaths caused by coronavirus (Apr 27, 2024)
Coronavirus confirmed cases (per 100k population) (Apr 27, 2024)
Deaths caused by coronavirus (per 100k population) (Apr 27, 2024)
Daily increase in number of cases (Apr 27, 2024)
Weekly increase in number of cases (Apr 27, 2024)
Cases doubled (in days) (Apr 27, 2024)
Hospitalized patients (Apr 18, 2022)
Negative test results (Apr 18, 2022)
Total test results (Apr 18, 2022)
COVID Vaccine doses distributed (per 100k population) (Sep 19, 2023)
COVID Vaccine doses administered (per 100k population) (Sep 19, 2023)
COVID Vaccine doses distributed (Sep 19, 2023)
COVID Vaccine doses administered (Sep 19, 2023)
Likely homosexual households (%)
Likely homosexual households (% change since 2000)
Likely homosexual households - Lesbian couples (%)
Likely homosexual households - Lesbian couples (% change since 2000)
Likely homosexual households - Gay men (%)
Likely homosexual households - Gay men (% change since 2000)
Cost of living index
Median gross rent ($)
Median contract rent ($)
Median monthly housing costs ($)
Median house or condo value ($)
Median house or condo value ($ change since 2000)
Mean house or condo value by units in structure - 1, detached ($)
Mean house or condo value by units in structure - 1, attached ($)
Mean house or condo value by units in structure - 2 ($)
Mean house or condo value by units in structure by units in structure - 3 or 4 ($)
Mean house or condo value by units in structure - 5 or more ($)
Mean house or condo value by units in structure - Boat, RV, van, etc. ($)
Mean house or condo value by units in structure - Mobile home ($)
Median house or condo value ($) - White
Median house or condo value ($) - Black or African American
Median house or condo value ($) - Asian
Median house or condo value ($) - Hispanic or Latino
Median house or condo value ($) - American Indian and Alaska Native
Median house or condo value ($) - Multirace
Median house or condo value ($) - Other Race
Median resident age
Resident age diversity
Median resident age - Males
Median resident age - Females
Median resident age - White
Median resident age - Black or African American
Median resident age - Asian
Median resident age - Hispanic or Latino
Median resident age - American Indian and Alaska Native
Median resident age - Multirace
Median resident age - Other Race
Median resident age - Males - White
Median resident age - Males - Black or African American
Median resident age - Males - Asian
Median resident age - Males - Hispanic or Latino
Median resident age - Males - American Indian and Alaska Native
Median resident age - Males - Multirace
Median resident age - Males - Other Race
Median resident age - Females - White
Median resident age - Females - Black or African American
Median resident age - Females - Asian
Median resident age - Females - Hispanic or Latino
Median resident age - Females - American Indian and Alaska Native
Median resident age - Females - Multirace
Median resident age - Females - Other Race
Commute - mean travel time to work (minutes)
Travel time to work - Less than 5 minutes (%)
Travel time to work - Less than 5 minutes (% change since 2000)
Travel time to work - 5 to 9 minutes (%)
Travel time to work - 5 to 9 minutes (% change since 2000)
Travel time to work - 10 to 19 minutes (%)
Travel time to work - 10 to 19 minutes (% change since 2000)
Travel time to work - 20 to 29 minutes (%)
Travel time to work - 20 to 29 minutes (% change since 2000)
Travel time to work - 30 to 39 minutes (%)
Travel time to work - 30 to 39 minutes (% change since 2000)
Travel time to work - 40 to 59 minutes (%)
Travel time to work - 40 to 59 minutes (% change since 2000)
Travel time to work - 60 to 89 minutes (%)
Travel time to work - 60 to 89 minutes (% change since 2000)
Travel time to work - 90 or more minutes (%)
Travel time to work - 90 or more minutes (% change since 2000)
Marital status - Never married (%)
Marital status - Now married (%)
Marital status - Separated (%)
Marital status - Widowed (%)
Marital status - Divorced (%)
Median family income ($)
Median family income (% change since 2000)
Median non-family income ($)
Median non-family income (% change since 2000)
Median per capita income ($)
Median per capita income (% change since 2000)
Median family income ($) - White
Median family income ($) - Black or African American
Median family income ($) - Asian
Median family income ($) - Hispanic or Latino
Median family income ($) - American Indian and Alaska Native
Median family income ($) - Multirace
Median family income ($) - Other Race
Median year house/condo built
Median year apartment built
Year house built - Built 2005 or later (%)
Year house built - Built 2000 to 2004 (%)
Year house built - Built 1990 to 1999 (%)
Year house built - Built 1980 to 1989 (%)
Year house built - Built 1970 to 1979 (%)
Year house built - Built 1960 to 1969 (%)
Year house built - Built 1950 to 1959 (%)
Year house built - Built 1940 to 1949 (%)
Year house built - Built 1939 or earlier (%)
Average household size
Household density (households per square mile)
Average household size - White
Average household size - Black or African American
Average household size - Asian
Average household size - Hispanic or Latino
Average household size - American Indian and Alaska Native
Average household size - Multirace
Average household size - Other Race
Occupied housing units (%)
Vacant housing units (%)
Owner occupied housing units (%)
Renter occupied housing units (%)
Vacancy status - For rent (%)
Vacancy status - For sale only (%)
Vacancy status - Rented or sold, not occupied (%)
Vacancy status - For seasonal, recreational, or occasional use (%)
Vacancy status - For migrant workers (%)
Vacancy status - Other vacant (%)
Residents with income below the poverty level (%)
Residents with income below 50% of the poverty level (%)
Children below poverty level (%)
Poor families by family type - Married-couple family (%)
Poor families by family type - Male, no wife present (%)
Poor families by family type - Female, no husband present (%)
Poverty status for native-born residents (%)
Poverty status for foreign-born residents (%)
Poverty among high school graduates not in families (%)
Poverty among people who did not graduate high school not in families (%)
Residents with income below the poverty level (%) - White
Residents with income below the poverty level (%) - Black or African American
Residents with income below the poverty level (%) - Asian
Residents with income below the poverty level (%) - Hispanic or Latino
Residents with income below the poverty level (%) - American Indian and Alaska Native
Residents with income below the poverty level (%) - Multirace
Residents with income below the poverty level (%) - Other Race
Air pollution - Air Quality Index (AQI)
Air pollution - CO
Air pollution - NO2
Air pollution - SO2
Air pollution - Ozone
Air pollution - PM10
Air pollution - PM25
Air pollution - Pb
Crime - Murders per 100,000 population
Crime - Rapes per 100,000 population
Crime - Robberies per 100,000 population
Crime - Assaults per 100,000 population
Crime - Burglaries per 100,000 population
Crime - Thefts per 100,000 population
Crime - Auto thefts per 100,000 population
Crime - Arson per 100,000 population
Crime - City-data.com crime index
Crime - Violent crime index
Crime - Property crime index
Crime - Murders per 100,000 population (5 year average)
Crime - Rapes per 100,000 population (5 year average)
Crime - Robberies per 100,000 population (5 year average)
Crime - Assaults per 100,000 population (5 year average)
Crime - Burglaries per 100,000 population (5 year average)
Crime - Thefts per 100,000 population (5 year average)
Crime - Auto thefts per 100,000 population (5 year average)
Crime - Arson per 100,000 population (5 year average)
Crime - City-data.com crime index (5 year average)
Crime - Violent crime index (5 year average)
Crime - Property crime index (5 year average)
1996 Presidential Elections Results (%) - Democratic Party (Clinton)
1996 Presidential Elections Results (%) - Republican Party (Dole)
1996 Presidential Elections Results (%) - Other
2000 Presidential Elections Results (%) - Democratic Party (Gore)
2000 Presidential Elections Results (%) - Republican Party (Bush)
2000 Presidential Elections Results (%) - Other
2004 Presidential Elections Results (%) - Democratic Party (Kerry)
2004 Presidential Elections Results (%) - Republican Party (Bush)
2004 Presidential Elections Results (%) - Other
2008 Presidential Elections Results (%) - Democratic Party (Obama)
2008 Presidential Elections Results (%) - Republican Party (McCain)
2008 Presidential Elections Results (%) - Other
2012 Presidential Elections Results (%) - Democratic Party (Obama)
2012 Presidential Elections Results (%) - Republican Party (Romney)
2012 Presidential Elections Results (%) - Other
2016 Presidential Elections Results (%) - Democratic Party (Clinton)
2016 Presidential Elections Results (%) - Republican Party (Trump)
2016 Presidential Elections Results (%) - Other
2020 Presidential Elections Results (%) - Democratic Party (Biden)
2020 Presidential Elections Results (%) - Republican Party (Trump)
2020 Presidential Elections Results (%) - Other
Ancestries Reported - Arab (%)
Ancestries Reported - Czech (%)
Ancestries Reported - Danish (%)
Ancestries Reported - Dutch (%)
Ancestries Reported - English (%)
Ancestries Reported - French (%)
Ancestries Reported - French Canadian (%)
Ancestries Reported - German (%)
Ancestries Reported - Greek (%)
Ancestries Reported - Hungarian (%)
Ancestries Reported - Irish (%)
Ancestries Reported - Italian (%)
Ancestries Reported - Lithuanian (%)
Ancestries Reported - Norwegian (%)
Ancestries Reported - Polish (%)
Ancestries Reported - Portuguese (%)
Ancestries Reported - Russian (%)
Ancestries Reported - Scotch-Irish (%)
Ancestries Reported - Scottish (%)
Ancestries Reported - Slovak (%)
Ancestries Reported - Subsaharan African (%)
Ancestries Reported - Swedish (%)
Ancestries Reported - Swiss (%)
Ancestries Reported - Ukrainian (%)
Ancestries Reported - United States (%)
Ancestries Reported - Welsh (%)
Ancestries Reported - West Indian (%)
Ancestries Reported - Other (%)
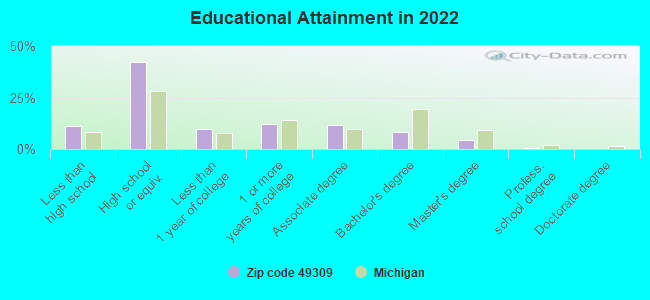
Educational Attainment - No schooling completed (%)
Educational Attainment - Less than high school (%)
Educational Attainment - High school or equivalent (%)
Educational Attainment - Less than 1 year of college (%)
Educational Attainment - 1 or more years of college (%)
Educational Attainment - Associate degree (%)
Educational Attainment - Bachelor's degree (%)
Educational Attainment - Master's degree (%)
Educational Attainment - Professional school degree (%)
Educational Attainment - Doctorate degree (%)
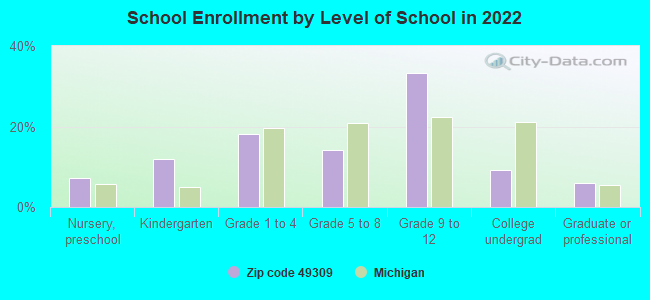
School Enrollment - Nursery, preschool (%)
School Enrollment - Kindergarten (%)
School Enrollment - Grade 1 to 4 (%)
School Enrollment - Grade 5 to 8 (%)
School Enrollment - Grade 9 to 12 (%)
School Enrollment - College undergrad (%)
School Enrollment - Graduate or professional (%)
School Enrollment - Not enrolled in school (%)
School enrollment - Public schools (%)
School enrollment - Private schools (%)
School enrollment - Not enrolled (%)
Median number of rooms in houses and condos
Median number of rooms in apartments
Housing units lacking complete plumbing facilities (%)
Housing units lacking complete kitchen facilities (%)
Density of houses
Urban houses (%)
Rural houses (%)
Households with people 60 years and over (%)
Households with people 65 years and over (%)
Households with people 75 years and over (%)
Households with one or more nonrelatives (%)
Households with no nonrelatives (%)
Population in households (%)
Family households (%)
Nonfamily households (%)
Population in families (%)
Family households with own children (%)
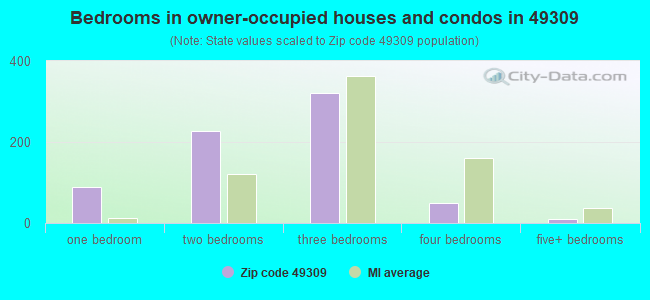
Median number of bedrooms in owner occupied houses
Mean number of bedrooms in owner occupied houses
Median number of bedrooms in renter occupied houses
Mean number of bedrooms in renter occupied houses
Median number of vehichles in owner occupied houses
Mean number of vehichles in owner occupied houses
Median number of vehichles in renter occupied houses
Mean number of vehichles in renter occupied houses
Mortgage status - with mortgage (%)
Mortgage status - with second mortgage (%)
Mortgage status - with home equity loan (%)
Mortgage status - with both second mortgage and home equity loan (%)
Mortgage status - without a mortgage (%)
Average family size
Average family size - White
Average family size - Black or African American
Average family size - Asian
Average family size - Hispanic or Latino
Average family size - American Indian and Alaska Native
Average family size - Multirace
Average family size - Other Race
Geographical mobility - Same house 1 year ago (%)
Geographical mobility - Moved within same county (%)
Geographical mobility - Moved from different county within same state (%)
Geographical mobility - Moved from different state (%)
Geographical mobility - Moved from abroad (%)
Place of birth - Born in state of residence (%)
Place of birth - Born in other state (%)
Place of birth - Native, outside of US (%)
Place of birth - Foreign born (%)
Housing units in structures - 1, detached (%)
Housing units in structures - 1, attached (%)
Housing units in structures - 2 (%)
Housing units in structures - 3 or 4 (%)
Housing units in structures - 5 to 9 (%)
Housing units in structures - 10 to 19 (%)
Housing units in structures - 20 to 49 (%)
Housing units in structures - 50 or more (%)
Housing units in structures - Mobile home (%)
Housing units in structures - Boat, RV, van, etc. (%)
House/condo owner moved in on average (years ago)
Renter moved in on average (years ago)
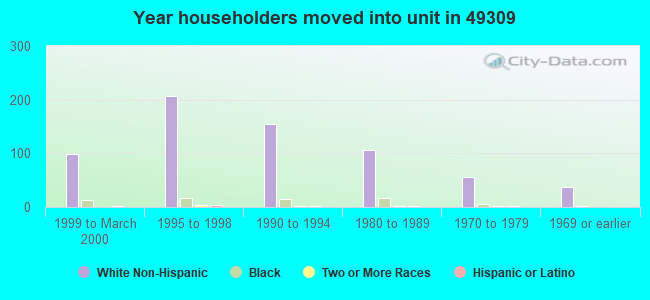
Year householder moved into unit - Moved in 1999 to March 2000 (%)
Year householder moved into unit - Moved in 1995 to 1998 (%)
Year householder moved into unit - Moved in 1990 to 1994 (%)
Year householder moved into unit - Moved in 1980 to 1989 (%)
Year householder moved into unit - Moved in 1970 to 1979 (%)
Year householder moved into unit - Moved in 1969 or earlier (%)
Means of transportation to work - Drove car alone (%)
Means of transportation to work - Carpooled (%)
Means of transportation to work - Public transportation (%)
Means of transportation to work - Bus or trolley bus (%)
Means of transportation to work - Streetcar or trolley car (%)
Means of transportation to work - Subway or elevated (%)
Means of transportation to work - Railroad (%)
Means of transportation to work - Ferryboat (%)
Means of transportation to work - Taxicab (%)
Means of transportation to work - Motorcycle (%)
Means of transportation to work - Bicycle (%)
Means of transportation to work - Walked (%)
Means of transportation to work - Other means (%)
Working at home (%)
Industry diversity
Most Common Industries - Agriculture, forestry, fishing and hunting, and mining (%)
Most Common Industries - Agriculture, forestry, fishing and hunting (%)
Most Common Industries - Mining, quarrying, and oil and gas extraction (%)
Most Common Industries - Construction (%)
Most Common Industries - Manufacturing (%)
Most Common Industries - Wholesale trade (%)
Most Common Industries - Retail trade (%)
Most Common Industries - Transportation and warehousing, and utilities (%)
Most Common Industries - Transportation and warehousing (%)
Most Common Industries - Utilities (%)
Most Common Industries - Information (%)
Most Common Industries - Finance and insurance, and real estate and rental and leasing (%)
Most Common Industries - Finance and insurance (%)
Most Common Industries - Real estate and rental and leasing (%)
Most Common Industries - Professional, scientific, and management, and administrative and waste management services (%)
Most Common Industries - Professional, scientific, and technical services (%)
Most Common Industries - Management of companies and enterprises (%)
Most Common Industries - Administrative and support and waste management services (%)
Most Common Industries - Educational services, and health care and social assistance (%)
Most Common Industries - Educational services (%)
Most Common Industries - Health care and social assistance (%)
Most Common Industries - Arts, entertainment, and recreation, and accommodation and food services (%)
Most Common Industries - Arts, entertainment, and recreation (%)
Most Common Industries - Accommodation and food services (%)
Most Common Industries - Other services, except public administration (%)
Most Common Industries - Public administration (%)
Occupation diversity
Most Common Occupations - Management, business, science, and arts occupations (%)
Most Common Occupations - Management, business, and financial occupations (%)
Most Common Occupations - Management occupations (%)
Most Common Occupations - Business and financial operations occupations (%)
Most Common Occupations - Computer, engineering, and science occupations (%)
Most Common Occupations - Computer and mathematical occupations (%)
Most Common Occupations - Architecture and engineering occupations (%)
Most Common Occupations - Life, physical, and social science occupations (%)
Most Common Occupations - Education, legal, community service, arts, and media occupations (%)
Most Common Occupations - Community and social service occupations (%)
Most Common Occupations - Legal occupations (%)
Most Common Occupations - Education, training, and library occupations (%)
Most Common Occupations - Arts, design, entertainment, sports, and media occupations (%)
Most Common Occupations - Healthcare practitioners and technical occupations (%)
Most Common Occupations - Health diagnosing and treating practitioners and other technical occupations (%)
Most Common Occupations - Health technologists and technicians (%)
Most Common Occupations - Service occupations (%)
Most Common Occupations - Healthcare support occupations (%)
Most Common Occupations - Protective service occupations (%)
Most Common Occupations - Fire fighting and prevention, and other protective service workers including supervisors (%)
Most Common Occupations - Law enforcement workers including supervisors (%)
Most Common Occupations - Food preparation and serving related occupations (%)
Most Common Occupations - Building and grounds cleaning and maintenance occupations (%)
Most Common Occupations - Personal care and service occupations (%)
Most Common Occupations - Sales and office occupations (%)
Most Common Occupations - Sales and related occupations (%)
Most Common Occupations - Office and administrative support occupations (%)
Most Common Occupations - Natural resources, construction, and maintenance occupations (%)
Most Common Occupations - Farming, fishing, and forestry occupations (%)
Most Common Occupations - Construction and extraction occupations (%)
Most Common Occupations - Installation, maintenance, and repair occupations (%)
Most Common Occupations - Production, transportation, and material moving occupations (%)
Most Common Occupations - Production occupations (%)
Most Common Occupations - Transportation occupations (%)
Most Common Occupations - Material moving occupations (%)
People in Group quarters - Institutionalized population (%)
People in Group quarters - Correctional institutions (%)
People in Group quarters - Federal prisons and detention centers (%)
People in Group quarters - Halfway houses (%)
People in Group quarters - Local jails and other confinement facilities (including police lockups) (%)
People in Group quarters - Military disciplinary barracks (%)
People in Group quarters - State prisons (%)
People in Group quarters - Other types of correctional institutions (%)
People in Group quarters - Nursing homes (%)
People in Group quarters - Hospitals/wards, hospices, and schools for the handicapped (%)
People in Group quarters - Hospitals/wards and hospices for chronically ill (%)
People in Group quarters - Hospices or homes for chronically ill (%)
People in Group quarters - Military hospitals or wards for chronically ill (%)
People in Group quarters - Other hospitals or wards for chronically ill (%)
People in Group quarters - Hospitals or wards for drug/alcohol abuse (%)
People in Group quarters - Mental (Psychiatric) hospitals or wards (%)
People in Group quarters - Schools, hospitals, or wards for the mentally retarded (%)
People in Group quarters - Schools, hospitals, or wards for the physically handicapped (%)
People in Group quarters - Institutions for the deaf (%)
People in Group quarters - Institutions for the blind (%)
People in Group quarters - Orthopedic wards and institutions for the physically handicapped (%)
People in Group quarters - Wards in general hospitals for patients who have no usual home elsewhere (%)
People in Group quarters - Wards in military hospitals for patients who have no usual home elsewhere (%)
People in Group quarters - Juvenile institutions (%)
People in Group quarters - Long-term care (%)
People in Group quarters - Homes for abused, dependent, and neglected children (%)
People in Group quarters - Residential treatment centers for emotionally disturbed children (%)
People in Group quarters - Training schools for juvenile delinquents (%)
People in Group quarters - Short-term care, detention or diagnostic centers for delinquent children (%)
People in Group quarters - Type of juvenile institution unknown (%)
People in Group quarters - Noninstitutionalized population (%)
People in Group quarters - College dormitories (includes college quarters off campus) (%)
People in Group quarters - Military quarters (%)
People in Group quarters - On base (%)
People in Group quarters - Barracks, unaccompanied personnel housing (UPH), (Enlisted/Officer), ;and similar group living quarters for military personnel (%)
People in Group quarters - Transient quarters for temporary residents (%)
People in Group quarters - Military ships (%)
People in Group quarters - Group homes (%)
People in Group quarters - Homes or halfway houses for drug/alcohol abuse (%)
People in Group quarters - Homes for the mentally ill (%)
People in Group quarters - Homes for the mentally retarded (%)
People in Group quarters - Homes for the physically handicapped (%)
People in Group quarters - Other group homes (%)
People in Group quarters - Religious group quarters (%)
People in Group quarters - Dormitories (%)
People in Group quarters - Agriculture workers' dormitories on farms (%)
People in Group quarters - Job Corps and vocational training facilities (%)
People in Group quarters - Other workers' dormitories (%)
People in Group quarters - Crews of maritime vessels (%)
People in Group quarters - Other nonhousehold living situations (%)
People in Group quarters - Other noninstitutional group quarters (%)
Residents speaking English at home (%)
Residents speaking English at home - Born in the United States (%)
Residents speaking English at home - Native, born elsewhere (%)
Residents speaking English at home - Foreign born (%)
Residents speaking Spanish at home (%)
Residents speaking Spanish at home - Born in the United States (%)
Residents speaking Spanish at home - Native, born elsewhere (%)
Residents speaking Spanish at home - Foreign born (%)
Residents speaking other language at home (%)
Residents speaking other language at home - Born in the United States (%)
Residents speaking other language at home - Native, born elsewhere (%)
Residents speaking other language at home - Foreign born (%)
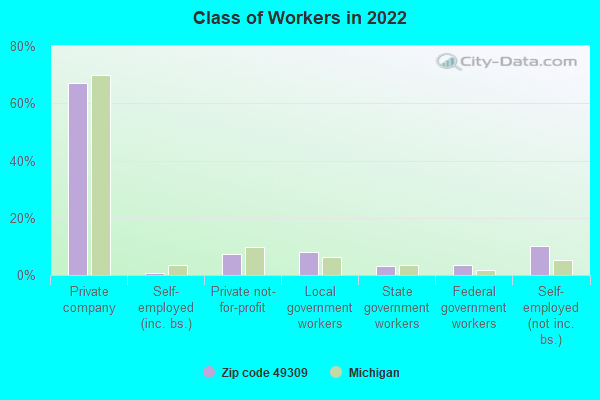
Class of Workers - Employee of private company (%)
Class of Workers - Self-employed in own incorporated business (%)
Class of Workers - Private not-for-profit wage and salary workers (%)
Class of Workers - Local government workers (%)
Class of Workers - State government workers (%)
Class of Workers - Federal government workers (%)
Class of Workers - Self-employed workers in own not incorporated business and Unpaid family workers (%)
House heating fuel used in houses and condos - Utility gas (%)
House heating fuel used in houses and condos - Bottled, tank, or LP gas (%)
House heating fuel used in houses and condos - Electricity (%)
House heating fuel used in houses and condos - Fuel oil, kerosene, etc. (%)
House heating fuel used in houses and condos - Coal or coke (%)
House heating fuel used in houses and condos - Wood (%)
House heating fuel used in houses and condos - Solar energy (%)
House heating fuel used in houses and condos - Other fuel (%)
House heating fuel used in houses and condos - No fuel used (%)
House heating fuel used in apartments - Utility gas (%)
House heating fuel used in apartments - Bottled, tank, or LP gas (%)
House heating fuel used in apartments - Electricity (%)
House heating fuel used in apartments - Fuel oil, kerosene, etc. (%)
House heating fuel used in apartments - Coal or coke (%)
House heating fuel used in apartments - Wood (%)
House heating fuel used in apartments - Solar energy (%)
House heating fuel used in apartments - Other fuel (%)
House heating fuel used in apartments - No fuel used (%)
Armed forces status - In Armed Forces (%)
Armed forces status - Civilian (%)
Armed forces status - Civilian - Veteran (%)
Armed forces status - Civilian - Nonveteran (%)
Fatal accidents locations in years 2005-2021
Fatal accidents locations in 2005
Fatal accidents locations in 2006
Fatal accidents locations in 2007
Fatal accidents locations in 2008
Fatal accidents locations in 2009
Fatal accidents locations in 2010
Fatal accidents locations in 2011
Fatal accidents locations in 2012
Fatal accidents locations in 2013
Fatal accidents locations in 2014
Fatal accidents locations in 2015
Fatal accidents locations in 2016
Fatal accidents locations in 2017
Fatal accidents locations in 2018
Fatal accidents locations in 2019
Fatal accidents locations in 2020
Fatal accidents locations in 2021
Alcohol use - People drinking some alcohol every month (%)
Alcohol use - People not drinking at all (%)
Alcohol use - Average days/month drinking alcohol
Alcohol use - Average drinks/week
Alcohol use - Average days/year people drink much
Audiometry - Average condition of hearing (%)
Audiometry - People that can hear a whisper from across a quiet room (%)
Audiometry - People that can hear normal voice from across a quiet room (%)
Audiometry - Ears ringing, roaring, buzzing (%)
Audiometry - Had a job exposure to loud noise (%)
Audiometry - Had off-work exposure to loud noise (%)
Blood Pressure & Cholesterol - Has high blood pressure (%)
Blood Pressure & Cholesterol - Checking blood pressure at home (%)
Blood Pressure & Cholesterol - Frequently checking blood cholesterol (%)
Blood Pressure & Cholesterol - Has high cholesterol level (%)
Consumer Behavior - Money monthly spent on food at supermarket/grocery store
Consumer Behavior - Money monthly spent on food at other stores
Consumer Behavior - Money monthly spent on eating out
Consumer Behavior - Money monthly spent on carryout/delivered foods
Consumer Behavior - Income spent on food at supermarket/grocery store (%)
Consumer Behavior - Income spent on food at other stores (%)
Consumer Behavior - Income spent on eating out (%)
Consumer Behavior - Income spent on carryout/delivered foods (%)
Current Health Status - General health condition (%)
Current Health Status - Blood donors (%)
Current Health Status - Has blood ever tested for HIV virus (%)
Current Health Status - Left-handed people (%)
Dermatology - People using sunscreen (%)
Diabetes - Diabetics (%)
Diabetes - Had a blood test for high blood sugar (%)
Diabetes - People taking insulin (%)
Diet Behavior & Nutrition - Diet health (%)
Diet Behavior & Nutrition - Milk product consumption (# of products/month)
Diet Behavior & Nutrition - Meals not home prepared (#/week)
Diet Behavior & Nutrition - Meals from fast food or pizza place (#/week)
Diet Behavior & Nutrition - Ready-to-eat foods (#/month)
Diet Behavior & Nutrition - Frozen meals/pizza (#/month)
Drug Use - People that ever used marijuana or hashish (%)
Drug Use - Ever used hard drugs (%)
Drug Use - Ever used any form of cocaine (%)
Drug Use - Ever used heroin (%)
Drug Use - Ever used methamphetamine (%)
Health Insurance - People covered by health insurance (%)
Kidney Conditions-Urology - Avg. # of times urinating at night
Medical Conditions - People with asthma (%)
Medical Conditions - People with anemia (%)
Medical Conditions - People with psoriasis (%)
Medical Conditions - People with overweight (%)
Medical Conditions - Elderly people having difficulties in thinking or remembering (%)
Medical Conditions - People who ever received blood transfusion (%)
Medical Conditions - People having trouble seeing even with glass/contacts (%)
Medical Conditions - People with arthritis (%)
Medical Conditions - People with gout (%)
Medical Conditions - People with congestive heart failure (%)
Medical Conditions - People with coronary heart disease (%)
Medical Conditions - People with angina pectoris (%)
Medical Conditions - People who ever had heart attack (%)
Medical Conditions - People who ever had stroke (%)
Medical Conditions - People with emphysema (%)
Medical Conditions - People with thyroid problem (%)
Medical Conditions - People with chronic bronchitis (%)
Medical Conditions - People with any liver condition (%)
Medical Conditions - People who ever had cancer or malignancy (%)
Mental Health - People who have little interest in doing things (%)
Mental Health - People feeling down, depressed, or hopeless (%)
Mental Health - People who have trouble sleeping or sleeping too much (%)
Mental Health - People feeling tired or having little energy (%)
Mental Health - People with poor appetite or overeating (%)
Mental Health - People feeling bad about themself (%)
Mental Health - People who have trouble concentrating on things (%)
Mental Health - People moving or speaking slowly or too fast (%)
Mental Health - People having thoughts they would be better off dead (%)
Oral Health - Average years since last visit a dentist
Oral Health - People embarrassed because of mouth (%)
Oral Health - People with gum disease (%)
Oral Health - General health of teeth and gums (%)
Oral Health - Average days a week using dental floss/device
Oral Health - Average days a week using mouthwash for dental problem
Oral Health - Average number of teeth
Pesticide Use - Households using pesticides to control insects (%)
Pesticide Use - Households using pesticides to kill weeds (%)
Physical Activity - People doing vigorous-intensity work activities (%)
Physical Activity - People doing moderate-intensity work activities (%)
Physical Activity - People walking or bicycling (%)
Physical Activity - People doing vigorous-intensity recreational activities (%)
Physical Activity - People doing moderate-intensity recreational activities (%)
Physical Activity - Average hours a day doing sedentary activities
Physical Activity - Average hours a day watching TV or videos
Physical Activity - Average hours a day using computer
Physical Functioning - People having limitations keeping them from working (%)
Physical Functioning - People limited in amount of work they can do (%)
Physical Functioning - People that need special equipment to walk (%)
Physical Functioning - People experiencing confusion/memory problems (%)
Physical Functioning - People requiring special healthcare equipment (%)
Prescription Medications - Average number of prescription medicines taking
Preventive Aspirin Use - Adults 40+ taking low-dose aspirin (%)
Reproductive Health - Vaginal deliveries (%)
Reproductive Health - Cesarean deliveries (%)
Reproductive Health - Deliveries resulted in a live birth (%)
Reproductive Health - Pregnancies resulted in a delivery (%)
Reproductive Health - Women breastfeeding newborns (%)
Reproductive Health - Women that had a hysterectomy (%)
Reproductive Health - Women that had both ovaries removed (%)
Reproductive Health - Women that have ever taken birth control pills (%)
Reproductive Health - Women taking birth control pills (%)
Reproductive Health - Women that have ever used Depo-Provera or injectables (%)
Reproductive Health - Women that have ever used female hormones (%)
Sexual Behavior - People 18+ that ever had sex (vaginal, anal, or oral) (%)
Sexual Behavior - Males 18+ that ever had vaginal sex with a woman (%)
Sexual Behavior - Males 18+ that ever performed oral sex on a woman (%)
Sexual Behavior - Males 18+ that ever had anal sex with a woman (%)
Sexual Behavior - Males 18+ that ever had any sex with a man (%)
Sexual Behavior - Females 18+ that ever had vaginal sex with a man (%)
Sexual Behavior - Females 18+ that ever performed oral sex on a man (%)
Sexual Behavior - Females 18+ that ever had anal sex with a man (%)
Sexual Behavior - Females 18+ that ever had any kind of sex with a woman (%)
Sexual Behavior - Average age people first had sex
Sexual Behavior - Average number of female sex partners in lifetime (males 18+)
Sexual Behavior - Average number of female vaginal sex partners in lifetime (males 18+)
Sexual Behavior - Average age people first performed oral sex on a woman (18+)
Sexual Behavior - Average number of woman performed oral sex on in lifetime (18+)
Sexual Behavior - Average number of male sex partners in lifetime (males 18+)
Sexual Behavior - Average number of male anal sex partners in lifetime (males 18+)
Sexual Behavior - Average age people first performed oral sex on a man (18+)
Sexual Behavior - Average number of male oral sex partners in lifetime (18+)
Sexual Behavior - People using protection when performing oral sex (%)
Sexual Behavior - Average number of times people have vaginal or anal sex a year
Sexual Behavior - People having sex without condom (%)
Sexual Behavior - Average number of male sex partners in lifetime (females 18+)
Sexual Behavior - Average number of male vaginal sex partners in lifetime (females 18+)
Sexual Behavior - Average number of female sex partners in lifetime (females 18+)
Sexual Behavior - Circumcised males 18+ (%)
Sleep Disorders - Average hours sleeping at night
Sleep Disorders - People that has trouble sleeping (%)
Smoking-Cigarette Use - People smoking cigarettes (%)
Taste & Smell - People 40+ having problems with smell (%)
Taste & Smell - People 40+ having problems with taste (%)
Taste & Smell - People 40+ that ever had wisdom teeth removed (%)
Taste & Smell - People 40+ that ever had tonsils teeth removed (%)
Taste & Smell - People 40+ that ever had a loss of consciousness because of a head injury (%)
Taste & Smell - People 40+ that ever had a broken nose or other serious injury to face or skull (%)
Taste & Smell - People 40+ that ever had two or more sinus infections (%)
Weight - Average height (inches)
Weight - Average weight (pounds)
Weight - Average BMI
Weight - People that are obese (%)
Weight - People that ever were obese (%)
Weight - People trying to lose weight (%)
100%
rural population.
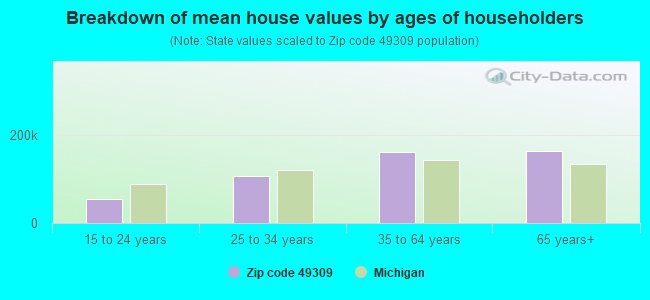
Estimated median house/condo value in 2022: $126,539
49309:
$126,539Michigan:
$224,400
Median resident age: This zip code:
54.8 yearsMichigan median age:
40.3 years
Average household size: This zip code:
2.0 peopleMichigan:
2.4 people
Averages for the 2020 tax year for zip code 49309, filed in 2021:
Average Adjusted Gross Income (AGI) in 2020: $41,884 (Individual Income Tax Returns) Here:
$41,884State:
$68,945
Salary/wage: $34,811 (reported on 67.1% of returns )Here:
$34,811State:
$57,142
(% of AGI for various income ranges: 770.0% for AGIs below $25k , 2776.7% for AGIs $25k-50k , 5146.2% for AGIs $50k-75k , 8752.5% for AGIs $75k-100k , 15093.3% for AGIs $100k-200k ) Taxable interest for individuals: $795 (reported on 25.6% of returns )This zip code:
$795Michigan:
$1,630
(% of AGI for various income ranges: 7.3% for AGIs below $25k , 27.2% for AGIs $25k-50k , 10.0% for AGIs $50k-75k , 117.5% for AGIs $75k-100k , 146.7% for AGIs $100k-200k ) Ordinary dividends: $3,238 (reported on 9.8% of returns )(% of AGI for various income ranges: 13.1% for AGIs below $25k , 10.6% for AGIs $25k-50k , 515.0% for AGIs $75k-100k ) Net capital gain/loss in AGI: +$10,978 (reported on 11.0% of returns )Here:
+$10,978State:
+$20,064
(% of AGI for various income ranges: 2.3% for AGIs below $25k , 46.7% for AGIs $25k-50k , 2245.0% for AGIs $75k-100k ) Profit/loss from business: +$6,789 (reported on 11.0% of returns )Here:
+$6,789State:
+$11,172
(% of AGI for various income ranges: 112.7% for AGIs below $25k , 89.4% for AGIs $25k-50k , 196.2% for AGIs $50k-75k ) Taxable individual retirement arrangement distribution: $15,718 (reported on 13.4% of returns )49309:
$15,718Michigan:
$19,803
(% of AGI for various income ranges: 96.9% for AGIs below $25k , 378.9% for AGIs $25k-50k , 1987.5% for AGIs $75k-100k ) Earned income credit: $2,388 (reported on 20.7% of returns )(% of AGI for various income ranges: 93.8% for AGIs below $25k , 90.0% for AGIs $25k-50k ) Percentage of individuals using paid preparers for their 2020 taxes: 91.5%(% for various income ranges: 88.9% for AGIs below $25k , 91.3% for AGIs $25k-50k , 100.0% for AGIs $50k-75k , 100.0% for AGIs $75k-100k , 83.3% for AGIs $100k-200k )
Averages for the 2012 tax year for zip code 49309, filed in 2013:
Average Adjusted Gross Income (AGI) in 2012: $33,291 (Individual Income Tax Returns) Here:
$33,291State:
$55,609
Salary/wage: $28,390 (reported on 72.7% of returns )Here:
$28,390State:
$46,782
(% of AGI for various income ranges: 55.7% for AGIs below $25k , 64.1% for AGIs $25k-50k , 67.9% for AGIs $50k-75k , 118.0% for AGIs $75k-100k ) Taxable interest for individuals: $741 (reported on 25.8% of returns )This zip code:
$741Michigan:
$1,491
(% of AGI for various income ranges: 1.4% for AGIs below $25k , 0.6% for AGIs $25k-50k , 0.3% for AGIs $50k-75k , 0.6% for AGIs $75k-100k ) Ordinary dividends: $2,143 (reported on 10.6% of returns )Net capital gain/loss in AGI: +$120 (reported on 7.6% of returns )Profit/loss from business: +$5,833 (reported on 13.6% of returns )Here:
+$5,833State:
+$11,523
Taxable individual retirement arrangement distribution: $10,300 (reported on 12.1% of returns )49309:
$10,300Michigan:
$15,298
(% of AGI for various income ranges: 3.3% for AGIs below $25k , 4.3% for AGIs $25k-50k , 8.4% for AGIs $50k-75k ) Total itemized deductions: $17,991 (28% of AGI, reported on 16.7% of returns )Here:
$17,991State:
$21,628
Here:
27.8% of AGIState:
18.4% of AGI
(% of AGI for various income ranges: 7.7% for AGIs below $25k , 7.6% for AGIs $25k-50k , 8.4% for AGIs $50k-75k , 23.1% for AGIs $75k-100k ) Charity contributions: $3,622 (reported on 13.6% of returns )(% of AGI for various income ranges: 1.5% for AGIs $25k-50k , 1.7% for AGIs $50k-75k , 4.3% for AGIs $75k-100k ) Taxes paid: $4,591 (reported on 16.7% of returns )(% of AGI for various income ranges: 2.2% for AGIs $25k-50k , 2.2% for AGIs $50k-75k , 7.6% for AGIs $75k-100k ) Earned income credit: $2,369 (reported on 24.2% of returns )(% of AGI for various income ranges: 8.2% for AGIs below $25k , 0.9% for AGIs $25k-50k ) Percentage of individuals using paid preparers for their 2012 taxes: 53.0%(% for various income ranges: 51.5% for AGIs below $25k , 52.6% for AGIs $25k-50k , 50.0% for AGIs $50k-75k , 100.0% for AGIs $75k-100k )
Averages for the 2004 tax year for zip code 49309, filed in 2005:
Average Adjusted Gross Income (AGI) in 2004: $27,639 (Individual Income Tax Returns) Here:
$27,639State:
$48,204
Salary/wage: $23,509 (reported on 77.5% of returns )Here:
$23,509State:
$42,791
(% of AGI for various income ranges: 79.2% for AGIs below $10k , 63.6% for AGIs $10k-25k , 71.7% for AGIs $25k-50k , 61.0% for AGIs $50k-75k , 74.5% for AGIs $75k-100k , 51.8% for AGIs over 100k ) Taxable interest for individuals: $1,139 (reported on 36.2% of returns )This zip code:
$1,139Michigan:
$1,725
(% of AGI for various income ranges: 4.3% for AGIs below $10k , 3.6% for AGIs $10k-25k , 1.3% for AGIs $25k-50k , 0.8% for AGIs $50k-75k , 0.1% for AGIs $75k-100k , 0.5% for AGIs over 100k ) Taxable dividends: $1,712 (reported on 15.8% of returns )(% of AGI for various income ranges: 1.9% for AGIs $10k-25k , 0.8% for AGIs $25k-50k , 1.2% for AGIs $50k-75k , 0.6% for AGIs $75k-100k ) Net capital gain/loss: +$589 (reported on 14.5% of returns )(% of AGI for various income ranges: -2.9% for AGIs below $10k , -0.3% for AGIs $10k-25k , 0.5% for AGIs $25k-50k , 1.4% for AGIs $50k-75k , -0.6% for AGIs $75k-100k ) Profit/loss from business: +$885 (reported on 11.9% of returns )(% of AGI for various income ranges: -13.0% for AGIs below $10k , 2.3% for AGIs $10k-25k , 0.6% for AGIs $25k-50k , 0.7% for AGIs $50k-75k ) Total itemized deductions: $14,477 (27% of AGI, reported on 19.5% of returns )Here:
$14,477State:
$18,509
Here:
26.8% of AGIState:
20.7% of AGI
(% of AGI for various income ranges: 9.8% for AGIs $10k-25k , 9.6% for AGIs $25k-50k , 11.1% for AGIs $50k-75k , 12.4% for AGIs $75k-100k , 11.9% for AGIs over 100k ) Charity contributions deductions: $2,747 (5% of AGI, reported on 13.9% of returns )Here:
4.8% of AGIState:
3.6% of AGI
(% of AGI for various income ranges: 0.9% for AGIs $10k-25k , 1.4% for AGIs $25k-50k , 2.0% for AGIs $50k-75k , 1.2% for AGIs $75k-100k , 1.3% for AGIs over 100k ) Total tax: $3,285 (reported on 64.1% of returns )(% of AGI for various income ranges: 3.7% for AGIs below $10k , 3.0% for AGIs $10k-25k , 6.1% for AGIs $25k-50k , 8.7% for AGIs $50k-75k , 12.1% for AGIs $75k-100k , 15.7% for AGIs over 100k ) Earned income credit: $1,664 (reported on 21.8% of returns )Percentage of individuals using paid preparers for their 2004 taxes: 57.2%(% for various income ranges: 53.0% for AGIs below $10k , 58.0% for AGIs $10k-25k , 52.3% for AGIs $25k-50k , 68.8% for AGIs $50k-75k , 66.7% for AGIs $75k-100k , 76.9% for AGIs over 100k )
Estimated median household income in 2022: This zip code:
$39,158Michigan:
$66,986
Nearest zip codes: 49312 ,
49304 ,
49642 ,
49349 ,
49402 ,
49459 .
Percentage of family households: This zip code:
29.8%Michigan:
43.3%
Percentage of households with unmarried partners: This zip code:
6.8%Michigan:
45.7%
Likely homosexual households (counted as self-reported same-sex unmarried-partner households)
Lesbian couples: 0.7% of all households Gay men: 0.0% of all households
Household received Food Stamps/SNAP in the past 12 months: 172Household did not receive Food Stamps/SNAP in the past 12 months: 598
Women who had a birth in the past 12 months: 9 (9 now married , 0 unmarried) Women who did not have a birth in the past 12 months: 251 (103 now married , 148 unmarried)
Housing units in zip code 49309 with a mortgage: 246 (12
second mortgage , 10
both second mortgage and home equity loan )
Median monthly owner costs for units with a mortgage: $917
Median monthly owner costs for units without a mortgage: $436
Residents with income below the poverty level in 2022:
This zip code:
20.5%Whole state:
13.4%
Residents with income below 50% of the poverty level in 2022:
This zip code:
11.5%Whole state:
6.9%
Median number of rooms in houses and condos: Median number of rooms in apartments: Notable locations in this zip code not listed on our city pages
Click to draw/clear zip code borders Notable locations in zip code 49309: (A) , Pickerel Lakeside Campground and Cottages (B) , Highbank Lake Recreation Area (C) , Pettibone Park Campground (D) , Lilley Station (E) , Walkers Corners (F) , Nichols Lake Recreation Site (G) , Lilley Township Fire Department (H) . Display/hide their locations on the map
Churches in zip code 49309 include: (A) , Bitely Community Church (B) , First Baptist Church of Woodland (C) . Display/hide their locations on the map
Cemeteries: (1) , Lilley Cemetery (2) , Volney Cemetery (3) . Display/hide their locations on the map
Lakes: (A) , Bass Lake (B) , Bitely Lake (C) , Black Lake (D) , Woodland Lake (E) , Bub Lake (F) , Dollar Lake (G) , East Lake (H) . Display/hide their locations on the map
Creeks: (A) , Triple Lakes Creek (B) , Allen Creek (C) , Pease Creek (D) , McDuffee Creek (E) , Whipple Creek (F) , Woody Creek (G) , Cedar Creek (H) , Freeman Creek (I) . Display/hide their locations on the map
Park in zip code 49309: (1) . Display/hide its location on the map
Year house built (houses)
7 2020 or later114 2010 to 2019189 2000 to 2009368 1990 to 1999236 1980 to 1989313 1970 to 1979298 1960 to 1969277 1950 to 195999 1940 to 1949128 1939 or earlier
Zip code 49309 household income distribution in 2022 76 Less than $10,00052 $10,000 to $14,99928 $15,000 to $19,99979 $20,000 to $24,99945 $25,000 to $29,99930 $30,000 to $34,99975 $35,000 to $39,99937 $40,000 to $44,99920 $45,000 to $49,99940 $50,000 to $59,999115 $60,000 to $74,99966 $75,000 to $99,99954 $100,000 to $124,99915 $125,000 to $149,99914 $150,000 to $199,99919 $200,000 or moreEstimate of home value of owner-occupied houses/condos in 2022 in zip code 49309 4 Less than $10,0008 $10,000 to $14,99913 $15,000 to $19,9998 $20,000 to $24,9992 $25,000 to $29,99925 $30,000 to $34,9994 $35,000 to $39,99920 $40,000 to $49,99918 $50,000 to $59,99946 $60,000 to $69,99950 $70,000 to $79,99937 $80,000 to $89,99927 $90,000 to $99,99979 $100,000 to $124,99927 $125,000 to $149,99968 $150,000 to $174,99928 $175,000 to $199,99970 $200,000 to $249,99946 $250,000 to $299,99939 $300,000 to $399,99912 $400,000 to $499,9991 $500,000 to $749,9993 $1,000,000 to $1,499,9995 $1,500,000 to $1,999,999Rent paid by renters in 2022 in zip code 49309 3 $200 to $2494 $300 to $3493 $500 to $5498 $550 to $5993 $600 to $6491 $750 to $7996 $800 to $89947 No cash rent
Median gross rent in 2022: $875.
Median price asked for vacant for-sale houses and condos in 2022: $406,567.
Estimated median house (or condo) value in 2022 for: White Non-Hispanic householders: $131,915Black or African American householders: $142,476Some other race householders: $216,018Two or more races householders: $200,081Hispanic or Latino householders: $129,611Estimated median house or condo value in 2022: $126,539
49309:
$126,539Michigan:
$224,400
Lower value quartile - upper value quartile: $78,284 - $218,017
Mean price in 2022: Detached houses: $148,990Here:
$148,990State:
$280,038
Mobile homes: $88,708Here:
$88,708State:
$72,868
Housing units in structures:
One, detached: 1,598One, attached: 15 to 9: 1Mobile homes: 447Unemployment : 4.4%
Means of transportation to work in zip code 49309 74.2% 427 Drove a car alone13.9% 80 Carpooled0.3% 2 Bicycle0.7% 4 Walked1.2% 7 Other means7.6% 44 Worked at homeTravel time to work (commute) in zip code 49309 10 Less than 5 minutes23 5 to 9 minutes43 10 to 14 minutes82 15 to 19 minutes79 20 to 24 minutes42 25 to 29 minutes80 30 to 34 minutes37 35 to 39 minutes25 40 to 44 minutes29 45 to 59 minutes41 60 to 89 minutes25 90 or more minutes
Percentage of zip code residents living and working in this county: 36.7%
Household type by relationship:
Households: 1,548
Male householders: 425 (191 living alone ), Female householders: 339 (109 living alone )308 spouses (308 opposite-sex spouses ), 36 unmarried partners , (32 opposite-sex unmarried partners ), 267 children (256 natural , 5 adopted , 7 stepchildren ), 73 grandchildren , 2 brothers or sisters , 2 parents , 0 foster children , 23 other relatives , 73 non-relatives In group quarters: 4 (-1 institutionalized population )
Size of family households: 272 2-persons , 63 3-persons , 34 4-persons , 19 5-persons , 6 6-persons , 4 7-or-more-persons
Size of nonfamily households: 299 1-person , 65 2-persons , 7 3-persons
94 married couples with children. single-parent households (26 men , 12 women ).
98.3% of residents of 49309 zip code speak English at home. of residents speak Spanish at home (100% very well ).of residents speak other Indo-European language at home (100% very well ).
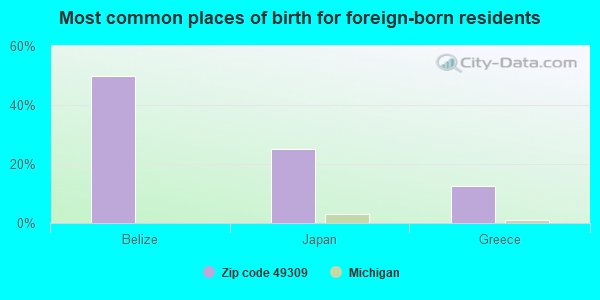
Foreign born population: 8 (0.5%)
(100.0%
of them are naturalized citizens )
This zip code:
0.5%Whole state:
6.9%
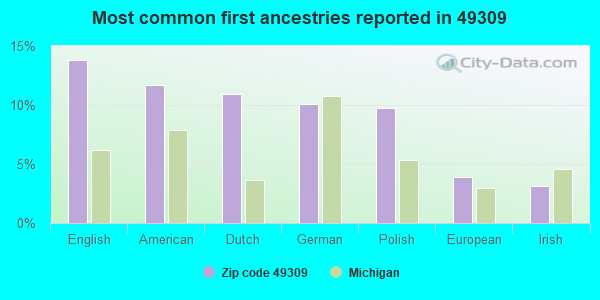
50% Belize 25% Japan 12% Greece 14% English 12% American 11% Dutch 10% German 10% Polish 4% European 3% Irish
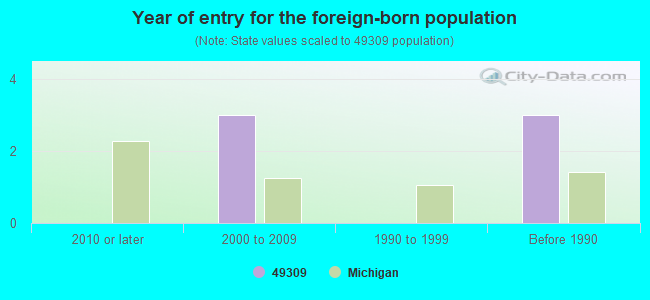
Year of entry for the foreign-born population
0 2010 or later 3 2000 to 2009 0 1990 to 1999 3 Before 1990
Facilities with environmental interests located in this zip code:
BIG STAR LAKE INN (1181 CHANNEL ROAD in BITELY, MI)
FORMAL ENFORCEMENT ACTION (Integrated Compliance Information System) - ICIS-05-2006-4831, ENFORCEMENT/COMPLIANCE ACTIVITY
MI DEPT/ENVIRONMENTAL QUALITY (10656 BINGHAM AVENUE in BITELY, MI)
(Resource Conservation and Recovery Act (tracking hazardous waste)) Organizations: MDEQ/JERRY GROFF (CONTACT/OPERATOR)
Alternative names: MI DEPT/ENVIRONMENTAL QUALITY RRD
MI DEPT/NATURAL RESOURCES (11841 N WOODBRIDGE in BITELY, MI)
(Resource Conservation and Recovery Act (tracking hazardous waste)) Alternative names: MIDNR NORTHLAND SPECIALTIES
Housing units lacking complete plumbing facilities: 2.4%
Housing units lacking complete kitchen facilities: 2.0%
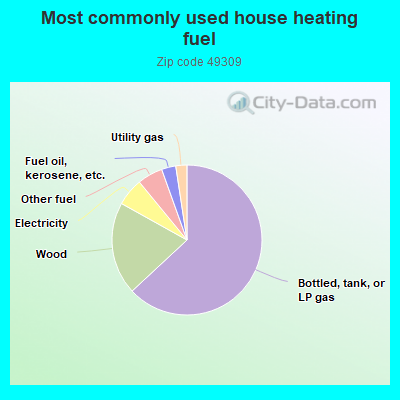
63.4% Bottled, tank, or LP gas 20.1% Wood 6.0% Electricity 5.5% Other fuel 3.1% Fuel oil, kerosene, etc. 2.4% Utility gas
Population in 1990: 1,828. Population change in the 1990s: +41 (+2.2%).
Place of birth for U.S.-born residents:
This state: 1,312Northeast: 8Midwest: 95South: 68West: 55
57% of the 49309 zip code residents lived in the same house 5 years ago.
Out of people who lived in different houses, 31% lived in this county.
Out of people who lived in different counties, 50% lived in Michigan.
91% of the 49309 zip code residents lived in the same house 1 year ago.
Out of people who lived in different houses, 10% moved from this county.
Out of people who lived in different houses, 84% moved from different county within same state.
Out of people who lived in different houses, 4% moved from different state.
Private vs. public school enrollment:
Students in private schools in grades 1 to 8 (elementary and middle school): 4
Students in private schools in grades 9 to 12 (high school): 5
Students in private undergraduate colleges: 2
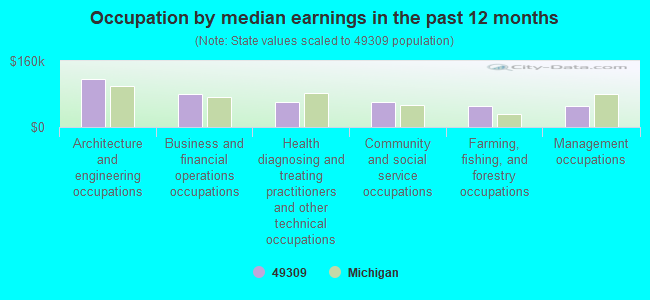
Occupation by median earnings in the past 12 months ($)
116,234 Architecture and engineering occupations 80,455 Business and financial operations occupations 60,294 Health diagnosing and treating practitioners and other technical occupations 59,910 Community and social service occupations 51,447 Farming, fishing, and forestry occupations 50,112 Management occupations
Top industries in this zip code by the number of employees in 2005:
Accommodation and Food Services: Full-Service Restaurants (5-9 employees: 1 establishment, 1-4 employees: 1 establishment)Health Care and Social Assistance: Child Day Care Services (5-9: 1)Accommodation and Food Services: Recreational and Vacation Camps (except Campgrounds) (5-9: 1)Administrative and Support and Waste Management and Remediation Services: Landscaping Services (5-9: 1)Other Services (except Public Administration): Labor Unions and Similar Labor Organizations (1-4: 1)
People in group quarters in 2010:
7 people in group homes intended for adults
People in group quarters in 2000:
23 people in agriculture workers' dormitories on farms
11 people in nursing homes
Fatal accident statistics in 2014:
Fatal accident count: 2Vehicles involved in fatal accidents: 2Fatal accidents caused by drunken drivers: 0Fatalities: 2Persons involved in fatal accidents: 2Pedestrians involved in fatal accidents: 1
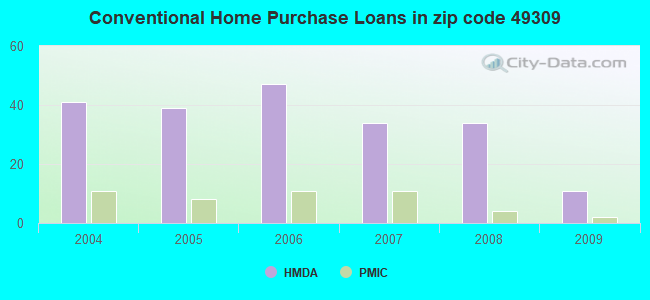
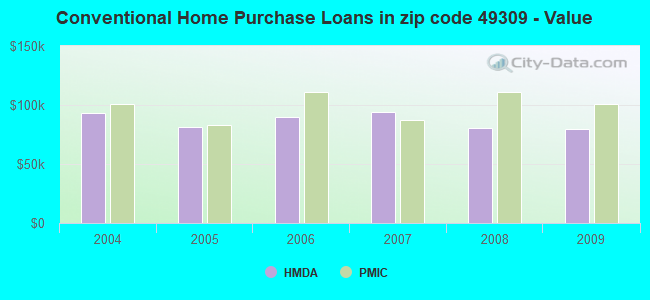
Home Mortgage Disclosure Act Aggregated Statistics For Year 2009(Based on 2 partial tracts) A) FHA, FSA/RHS & VA B) Conventional C) Refinancings D) Home Improvement Loans F) Non-occupant Loans on G) Loans On Manufactured Number Average Value Number Average Value Number Average Value Number Average Value Number Average Value Number Average Value
LOANS ORIGINATED 8 $89,469 11 $79,346 72 $116,667 11 $35,248 18 $176,870 10 $55,869 APPLICATIONS APPROVED, NOT ACCEPTED 1 $44,990 1 $96,520 4 $119,632 0 $0 1 $112,880 0 $0 APPLICATIONS DENIED 2 $44,170 3 $42,810 42 $109,476 9 $21,359 7 $93,019 9 $58,351 APPLICATIONS WITHDRAWN 1 $53,990 2 $42,945 13 $91,490 1 $8,180 3 $88,890 2 $38,445 FILES CLOSED FOR INCOMPLETENESS 1 $45,810 0 $0 8 $131,596 1 $81,800 1 $98,160 2 $59,305
Aggregated Statistics For Year 2008(Based on 2 partial tracts) A) FHA, FSA/RHS & VA B) Conventional C) Refinancings D) Home Improvement Loans F) Non-occupant Loans on G) Loans On Manufactured Number Average Value Number Average Value Number Average Value Number Average Value Number Average Value Number Average Value
LOANS ORIGINATED 2 $54,395 34 $80,549 52 $81,391 27 $31,963 25 $74,438 17 $62,649 APPLICATIONS APPROVED, NOT ACCEPTED 1 $96,520 3 $67,893 12 $132,652 0 $0 1 $122,700 3 $85,073 APPLICATIONS DENIED 0 $0 11 $52,947 33 $111,744 7 $36,343 6 $50,717 9 $53,624 APPLICATIONS WITHDRAWN 3 $77,710 2 $228,630 13 $116,030 1 $134,970 1 $110,430 2 $106,340 FILES CLOSED FOR INCOMPLETENESS 0 $0 0 $0 2 $139,470 1 $73,620 1 $70,350 0 $0
Aggregated Statistics For Year 2007(Based on 2 partial tracts) A) FHA, FSA/RHS & VA B) Conventional C) Refinancings D) Home Improvement Loans F) Non-occupant Loans on G) Loans On Manufactured Number Average Value Number Average Value Number Average Value Number Average Value Number Average Value Number Average Value
LOANS ORIGINATED 4 $108,590 34 $94,262 67 $116,901 20 $35,420 27 $134,697 21 $48,963 APPLICATIONS APPROVED, NOT ACCEPTED 0 $0 10 $77,301 13 $79,598 4 $47,852 7 $100,147 6 $75,528 APPLICATIONS DENIED 3 $82,890 15 $78,201 49 $95,856 21 $35,447 12 $62,645 19 $64,019 APPLICATIONS WITHDRAWN 1 $49,080 2 $92,025 20 $85,113 2 $67,075 7 $91,967 2 $85,890 FILES CLOSED FOR INCOMPLETENESS 0 $0 0 $0 5 $106,668 2 $38,855 1 $97,340 0 $0
Aggregated Statistics For Year 2006(Based on 2 partial tracts) A) FHA, FSA/RHS & VA B) Conventional C) Refinancings D) Home Improvement Loans F) Non-occupant Loans on G) Loans On Manufactured Number Average Value Number Average Value Number Average Value Number Average Value Number Average Value Number Average Value
LOANS ORIGINATED 6 $90,117 47 $89,632 90 $91,870 25 $38,348 30 $80,137 20 $58,242 APPLICATIONS APPROVED, NOT ACCEPTED 0 $0 5 $77,382 17 $141,755 3 $64,623 5 $91,780 5 $51,044 APPLICATIONS DENIED 0 $0 17 $76,122 70 $96,489 16 $29,499 15 $78,528 16 $52,096 APPLICATIONS WITHDRAWN 0 $0 6 $121,337 43 $95,250 3 $68,713 5 $71,002 3 $88,070 FILES CLOSED FOR INCOMPLETENESS 1 $87,530 0 $0 6 $81,937 1 $172,600 0 $0 0 $0
Aggregated Statistics For Year 2005(Based on 2 partial tracts) A) FHA, FSA/RHS & VA B) Conventional C) Refinancings D) Home Improvement Loans E) Loans on Dwellings For 5+ Families F) Non-occupant Loans on G) Loans On Manufactured Number Average Value Number Average Value Number Average Value Number Average Value Number Average Value Number Average Value Number Average Value
LOANS ORIGINATED 7 $81,917 39 $81,527 96 $84,459 25 $43,158 0 $0 24 $90,219 34 $59,546 APPLICATIONS APPROVED, NOT ACCEPTED 2 $92,435 8 $74,540 27 $103,856 2 $20,450 0 $0 3 $89,163 8 $92,230 APPLICATIONS DENIED 2 $58,080 15 $59,714 91 $100,470 15 $22,631 1 $61,350 11 $70,720 23 $60,674 APPLICATIONS WITHDRAWN 2 $55,215 2 $89,570 49 $103,786 5 $80,818 0 $0 1 $40,900 9 $72,166 FILES CLOSED FOR INCOMPLETENESS 0 $0 4 $88,752 11 $98,160 0 $0 0 $0 1 $40,900 2 $44,990
Aggregated Statistics For Year 2004(Based on 2 partial tracts) A) FHA, FSA/RHS & VA B) Conventional C) Refinancings D) Home Improvement Loans E) Loans on Dwellings For 5+ Families F) Non-occupant Loans on G) Loans On Manufactured Number Average Value Number Average Value Number Average Value Number Average Value Number Average Value Number Average Value Number Average Value
LOANS ORIGINATED 6 $87,662 41 $93,511 98 $79,338 30 $24,758 0 $0 34 $79,971 25 $56,704 APPLICATIONS APPROVED, NOT ACCEPTED 0 $0 4 $62,782 20 $89,326 2 $71,575 0 $0 3 $77,437 5 $45,154 APPLICATIONS DENIED 2 $153,375 20 $66,790 73 $91,739 16 $46,319 1 $65,440 10 $93,007 23 $59,607 APPLICATIONS WITHDRAWN 1 $124,340 3 $65,440 27 $96,887 3 $42,263 0 $0 2 $83,845 5 $88,998 FILES CLOSED FOR INCOMPLETENESS 0 $0 0 $0 18 $108,839 2 $108,385 0 $0 0 $0 2 $71,575
Detailed HMDA statistics for the following Tracts:
9701.00
Private Mortgage Insurance Companies Aggregated Statistics For Year 2009(Based on 2 partial tracts) A) Conventional B) Refinancings C) Non-occupant Loans on Number Average Value Number Average Value Number Average Value
LOANS ORIGINATED 2 $101,025 2 $78,935 1 $60,530 APPLICATIONS APPROVED, NOT ACCEPTED 2 $111,655 0 $0 0 $0 APPLICATIONS DENIED 0 $0 0 $0 0 $0 APPLICATIONS WITHDRAWN 0 $0 0 $0 0 $0 FILES CLOSED FOR INCOMPLETENESS 0 $0 0 $0 0 $0
Aggregated Statistics For Year 2008(Based on 2 partial tracts) A) Conventional B) Refinancings C) Non-occupant Loans on D) Loans On Manufactured Number Average Value Number Average Value Number Average Value Number Average Value
LOANS ORIGINATED 4 $111,248 4 $145,400 4 $87,525 1 $39,260 APPLICATIONS APPROVED, NOT ACCEPTED 1 $91,620 3 $164,417 2 $93,660 0 $0 APPLICATIONS DENIED 2 $53,170 2 $138,240 2 $105,115 0 $0 APPLICATIONS WITHDRAWN 0 $0 0 $0 0 $0 0 $0 FILES CLOSED FOR INCOMPLETENESS 0 $0 0 $0 0 $0 0 $0
Aggregated Statistics For Year 2007(Based on 2 partial tracts) A) Conventional B) Refinancings C) Non-occupant Loans on Number Average Value Number Average Value Number Average Value
LOANS ORIGINATED 11 $87,452 3 $165,510 2 $68,710 APPLICATIONS APPROVED, NOT ACCEPTED 5 $122,210 0 $0 2 $168,510 APPLICATIONS DENIED 1 $43,350 0 $0 0 $0 APPLICATIONS WITHDRAWN 0 $0 0 $0 0 $0 FILES CLOSED FOR INCOMPLETENESS 0 $0 0 $0 0 $0
Aggregated Statistics For Year 2006(Based on 2 partial tracts) A) Conventional B) Refinancings C) Non-occupant Loans on D) Loans On Manufactured Number Average Value Number Average Value Number Average Value Number Average Value
LOANS ORIGINATED 11 $111,174 5 $102,740 4 $74,030 2 $55,215 APPLICATIONS APPROVED, NOT ACCEPTED 2 $124,745 2 $115,340 1 $25,360 0 $0 APPLICATIONS DENIED 0 $0 0 $0 0 $0 0 $0 APPLICATIONS WITHDRAWN 0 $0 1 $76,890 0 $0 0 $0 FILES CLOSED FOR INCOMPLETENESS 1 $43,350 0 $0 0 $0 0 $0
Aggregated Statistics For Year 2005(Based on 2 partial tracts) A) Conventional B) Refinancings C) Non-occupant Loans on D) Loans On Manufactured Number Average Value Number Average Value Number Average Value Number Average Value
LOANS ORIGINATED 8 $82,822 6 $141,105 2 $45,810 1 $58,080 APPLICATIONS APPROVED, NOT ACCEPTED 2 $108,385 4 $173,212 0 $0 0 $0 APPLICATIONS DENIED 1 $85,070 1 $46,630 0 $0 2 $65,850 APPLICATIONS WITHDRAWN 0 $0 1 $89,980 0 $0 0 $0 FILES CLOSED FOR INCOMPLETENESS 1 $68,710 0 $0 0 $0 0 $0
Aggregated Statistics For Year 2004(Based on 2 partial tracts) A) Conventional B) Refinancings C) Non-occupant Loans on D) Loans On Manufactured Number Average Value Number Average Value Number Average Value Number Average Value
LOANS ORIGINATED 11 $100,985 4 $115,132 3 $78,527 1 $149,690 APPLICATIONS APPROVED, NOT ACCEPTED 1 $10,630 2 $81,390 0 $0 0 $0 APPLICATIONS DENIED 0 $0 0 $0 0 $0 0 $0 APPLICATIONS WITHDRAWN 0 $0 0 $0 0 $0 0 $0 FILES CLOSED FOR INCOMPLETENESS 0 $0 0 $0 0 $0 0 $0
Detailed PMIC statistics for the following Tracts:
9701.00
2002 - 2018 National Fire Incident Reporting System (NFIRS) incidents See full 2006 National Fire Incident Reporting System statistics for zip code 49309, Michigan
Most common first names in zip code 49309 among deceased individuals Name Count Lived (average)
William 20 74.5 years Mary 18 81.3 years James 17 73.2 years Robert 12 64.9 years John 11 68.2 years Charles 9 77.0 years Joseph 9 70.9 years Dorothy 9 75.8 years Frank 7 73.3 years George 6 71.8 years
Most common last names in zip code 49309 among deceased individuals Last name Count Lived (average)
Cousineau 10 77.4 years Smith 10 76.2 years Gleason 9 74.8 years Johnson 8 75.4 years Hornsby 7 75.6 years Taylor 7 72.9 years Anderson 6 79.7 years Hill 6 74.8 years Lamb 6 61.5 years Wilkinson 6 74.8 years

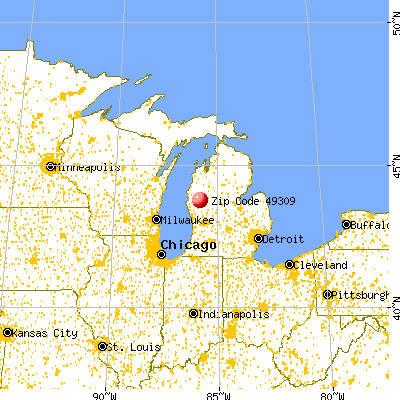


 Nearest zip codes: 49312, 49304, 49642, 49349, 49402, 49459.
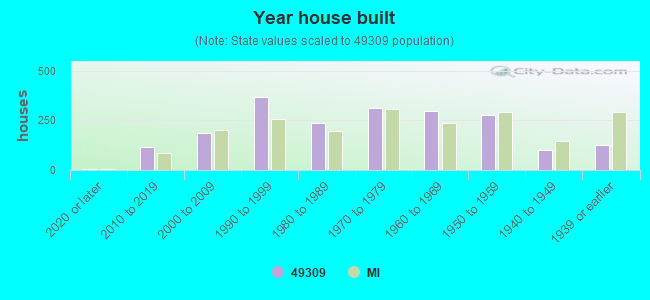


 According to the data from the years 2002 - 2018 the average number of fire incidents per year is 8. The highest number of fires - 22 took place in 2018, and the least - 0 in 2004. The data has an increasing trend.
 When looking into fire subcategories, the most reports belonged to: Structure Fires (48.5%), and Outside Fires (35.8%).