Estimated zip code population in 2022: 10,556 Zip code population in 2010: 9,091 Zip code population in 2000: 9,296
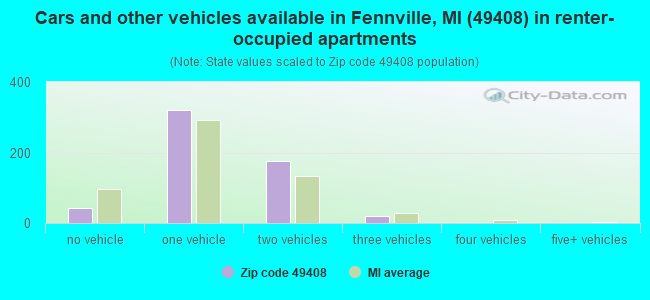
Houses and condos: 4,981 Renter-occupied apartments: 558
% of renters here:
14%
State:
27%
March 2022 cost of living index in zip code 49408: 81.4 (low, U.S. average is 100)
Land area: 105.4 sq. mi. Water area: 2.1 sq. mi.
Population density: 100 people per square mile
(very low).
OSM Map
General Map
Google Map
MSN Map
OSM Map
General Map
Google Map
MSN Map
OSM Map
General Map
Google Map
MSN Map
OSM Map
General Map
Google Map
MSN Map
Please wait while loading the map...
Real estate property taxes paid for housing units in 2022:
This zip code:
1.1% ($2,238)
Michigan:
1.2% ($2,746)
Median real estate property taxes paid for housing units with mortgages in 2022: $2,362 (1.0%) Median real estate property taxes paid for housing units with no mortgage in 2022: $2,073 (1.1%)
Business Search- 14 Million verified businesses
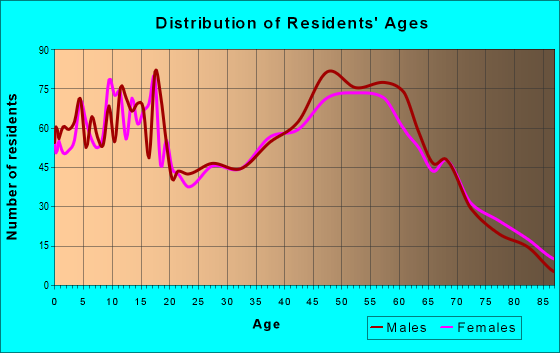
Males: 5,333
(50.5%)
Females: 5,223
(49.5%)
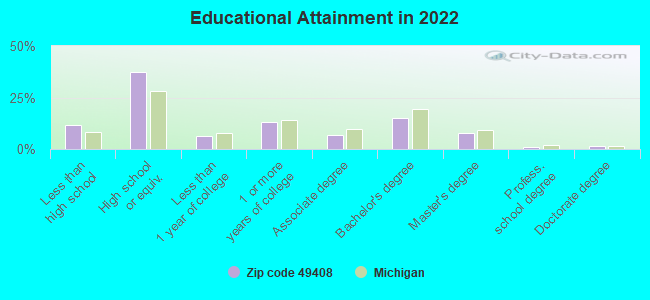
For population 25 years and over in 49408:
High school or higher: 87.8%
Bachelor's degree or higher: 24.8%
Graduate or professional degree: 9.9%
Unemployed: 3.1%
Mean travel time to work (commute): 25.4 minutes
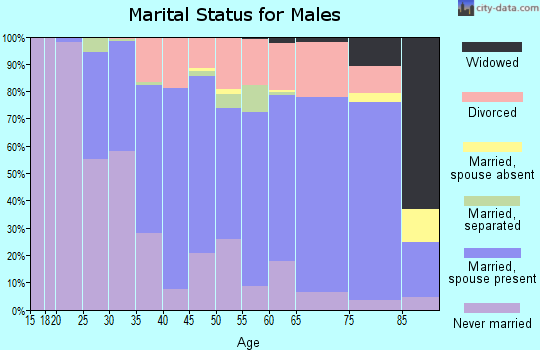
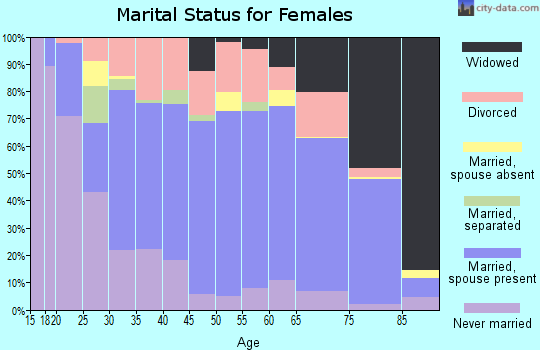
For population 15 years and over in 49408:
Never married: 28.3%
Now married: 53.5%
Separated: 1.0%
Widowed: 6.6%
Divorced: 10.7%
Zip code 49408 compared to state average:
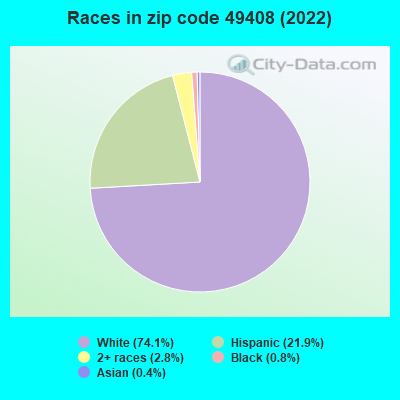
Black race population percentage significantly below state average.
Hispanic race population percentage significantly above state average.
Renting percentage below state average.
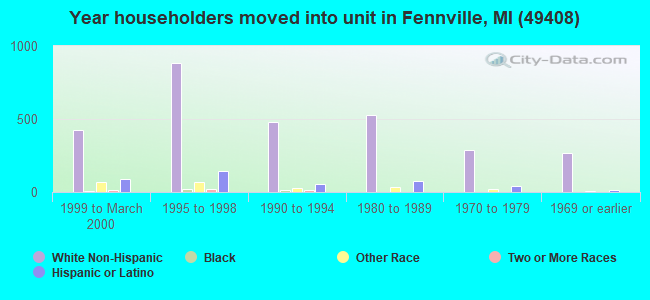
Length of stay since moving in significantly above state average.
Averages for the 2020 tax year for zip code 49408, filed in 2021:
Average Adjusted Gross Income (AGI) in 2020: $60,812 (Individual Income Tax Returns)
Here:
$60,812
State:
$68,945
Salary/wage: $48,632 (reported on 79.6% of returns)
Here:
$48,632
State:
$57,142
(% of AGI for various income ranges: 1030.6% for AGIs below $25k, 3308.6% for AGIs $25k-50k, 6327.6% for AGIs $50k-75k, 9193.0% for AGIs $75k-100k, 14674.4% for AGIs $100k-200k, 116500.0% for AGIs over 200k)
Taxable interest for individuals: $1,438 (reported on 24.9% of returns)
This zip code:
$1,438
Michigan:
$1,630
(% of AGI for various income ranges: 11.3% for AGIs below $25k, 22.5% for AGIs $25k-50k, 23.7% for AGIs $50k-75k, 30.0% for AGIs $75k-100k, 103.7% for AGIs $100k-200k, 2713.3% for AGIs over 200k)
Ordinary dividends: $10,668 (reported on 15.5% of returns)
Here:
$10,668
State:
$6,972
(% of AGI for various income ranges: 29.8% for AGIs below $25k, 42.3% for AGIs $25k-50k, 56.5% for AGIs $50k-75k, 151.9% for AGIs $75k-100k, 505.2% for AGIs $100k-200k, 16076.7% for AGIs over 200k)
Net capital gain/loss in AGI: +$19,070 (reported on 15.2% of returns)
Here:
+$19,070
State:
+$20,064
(% of AGI for various income ranges: 16.2% for AGIs below $25k, 31.6% for AGIs $25k-50k, 92.2% for AGIs $50k-75k, 205.9% for AGIs $75k-100k, 749.6% for AGIs $100k-200k, 33153.3% for AGIs over 200k)
Profit/loss from business: +$9,671 (reported on 14.8% of returns)
Here:
+$9,671
State:
+$11,172
(% of AGI for various income ranges: 108.4% for AGIs below $25k, 159.5% for AGIs $25k-50k, 230.7% for AGIs $50k-75k, 174.8% for AGIs $75k-100k, 682.6% for AGIs $100k-200k, 726.7% for AGIs over 200k)
Taxable individual retirement arrangement distribution: $23,200 (reported on 9.9% of returns)
49408:
$23,200
Michigan:
$19,803
(% of AGI for various income ranges: 78.2% for AGIs below $25k, 101.5% for AGIs $25k-50k, 180.9% for AGIs $50k-75k, 407.4% for AGIs $75k-100k, 1294.4% for AGIs $100k-200k, 10530.0% for AGIs over 200k)
Total itemized deductions: $40,846 (reported on 5.2% of returns)
Here:
$40,846
State:
$34,117
(% of AGI for various income ranges: 115.6% for AGIs $25k-50k, 135.6% for AGIs $50k-75k, 207.0% for AGIs $75k-100k, 755.2% for AGIs $100k-200k, 17413.3% for AGIs over 200k)
Charity contributions: $20,133 (reported on 3.9% of returns)
Here:
$20,133
State:
$13,548
(% of AGI for various income ranges: 6.2% for AGIs below $25k, 10.6% for AGIs $50k-75k, 29.6% for AGIs $75k-100k, 150.0% for AGIs $100k-200k, 10050.0% for AGIs over 200k)
Taxes paid: $7,817 (reported on 5.2% of returns)
49408:
$7,817
State:
$7,972
(% of AGI for various income ranges: 18.6% for AGIs $25k-50k, 36.5% for AGIs $50k-75k, 67.0% for AGIs $75k-100k, 198.5% for AGIs $100k-200k, 2536.7% for AGIs over 200k)
Earned income credit: $2,025 (reported on 14.8% of returns)
Here:
$2,025
State:
$2,251
(% of AGI for various income ranges: 70.4% for AGIs below $25k, 59.0% for AGIs $25k-50k)
Percentage of individuals using paid preparers for their 2020 taxes: 94.0%
Here:
94%
State:
93%
(% for various income ranges: 93.7% for AGIs below $25k, 93.2% for AGIs $25k-50k, 94.5% for AGIs $50k-75k, 94.9% for AGIs $75k-100k, 93.6% for AGIs $100k-200k, 100.0% for AGIs over 200k)
Averages for the 2012 tax year for zip code 49408, filed in 2013:
Average Adjusted Gross Income (AGI) in 2012: $45,243 (Individual Income Tax Returns)
Here:
$45,243
State:
$55,609
Salary/wage: $37,269 (reported on 82.8% of returns)
Here:
$37,269
State:
$46,782
(% of AGI for various income ranges: 71.2% for AGIs below $25k, 80.9% for AGIs $25k-50k, 78.0% for AGIs $50k-75k, 76.0% for AGIs $75k-100k, 67.5% for AGIs $100k-200k, 34.3% for AGIs over 200k)
Taxable interest for individuals: $1,339 (reported on 25.2% of returns)
This zip code:
$1,339
Michigan:
$1,491
(% of AGI for various income ranges: 1.3% for AGIs below $25k, 0.5% for AGIs $25k-50k, 0.5% for AGIs $50k-75k, 0.4% for AGIs $75k-100k, 0.8% for AGIs $100k-200k, 1.1% for AGIs over 200k)
Ordinary dividends: $5,693 (reported on 16.5% of returns)
Here:
$5,693
State:
$6,225
(% of AGI for various income ranges: 1.7% for AGIs below $25k, 0.8% for AGIs $25k-50k, 1.2% for AGIs $50k-75k, 1.2% for AGIs $75k-100k, 2.4% for AGIs $100k-200k, 5.1% for AGIs over 200k)
Net capital gain/loss in AGI: +$11,306 (reported on 12.8% of returns)
Here:
+$11,306
State:
+$9,326
(% of AGI for various income ranges: 0.2% for AGIs below $25k, 0.4% for AGIs $25k-50k, 0.5% for AGIs $50k-75k, 1.1% for AGIs $75k-100k, 2.4% for AGIs $100k-200k, 14.1% for AGIs over 200k)
Profit/loss from business: +$10,897 (reported on 14.3% of returns)
Here:
+$10,897
State:
+$11,523
(% of AGI for various income ranges: 6.9% for AGIs below $25k, 2.9% for AGIs $25k-50k, 3.0% for AGIs $50k-75k, 2.9% for AGIs $75k-100k, 6.2% for AGIs $100k-200k)
Taxable individual retirement arrangement distribution: $15,524 (reported on 11.1% of returns)
49408:
$15,524
Michigan:
$15,298
(% of AGI for various income ranges: 4.1% for AGIs below $25k, 3.2% for AGIs $25k-50k, 2.4% for AGIs $50k-75k, 4.1% for AGIs $75k-100k, 9.5% for AGIs $100k-200k)
Total itemized deductions: $20,584 (20% of AGI, reported on 21.3% of returns)
Here:
$20,584
State:
$21,628
Here:
20.2% of AGI
State:
18.4% of AGI
(% of AGI for various income ranges: 6.4% for AGIs below $25k, 7.3% for AGIs $25k-50k, 9.0% for AGIs $50k-75k, 10.9% for AGIs $75k-100k, 15.0% for AGIs $100k-200k, 9.4% for AGIs over 200k)
Charity contributions: $3,651 (reported on 16.5% of returns)
Here:
$3,651
State:
$4,225
(% of AGI for various income ranges: 0.5% for AGIs below $25k, 0.6% for AGIs $25k-50k, 1.0% for AGIs $50k-75k, 1.2% for AGIs $75k-100k, 2.4% for AGIs $100k-200k, 2.2% for AGIs over 200k)
Taxes paid: $7,275 (reported on 21.3% of returns)
49408:
$7,275
State:
$8,327
(% of AGI for various income ranges: 1.6% for AGIs below $25k, 1.9% for AGIs $25k-50k, 2.7% for AGIs $50k-75k, 3.4% for AGIs $75k-100k, 5.6% for AGIs $100k-200k, 5.1% for AGIs over 200k)
Earned income credit: $2,166 (reported on 19.9% of returns)
Here:
$2,166
State:
$2,306
(% of AGI for various income ranges: 5.8% for AGIs below $25k, 1.3% for AGIs $25k-50k)
Percentage of individuals using paid preparers for their 2012 taxes: 59.8%
Here:
60%
State:
57%
(% for various income ranges: 58.1% for AGIs below $25k, 59.8% for AGIs $25k-50k, 60.0% for AGIs $50k-75k, 58.6% for AGIs $75k-100k, 68.0% for AGIs $100k-200k, 83.3% for AGIs over 200k)
Averages for the 2004 tax year for zip code 49408, filed in 2005:
Average Adjusted Gross Income (AGI) in 2004: $39,555 (Individual Income Tax Returns)
Here:
$39,555
State:
$48,204
Salary/wage: $36,276 (reported on 85.3% of returns)
Here:
$36,276
State:
$42,791
(% of AGI for various income ranges: 128.8% for AGIs below $10k, 74.1% for AGIs $10k-25k, 84.0% for AGIs $25k-50k, 84.5% for AGIs $50k-75k, 83.5% for AGIs $75k-100k, 61.1% for AGIs over 100k)
Taxable interest for individuals: $1,466 (reported on 36.3% of returns)
This zip code:
$1,466
Michigan:
$1,725
(% of AGI for various income ranges: 9.0% for AGIs below $10k, 2.0% for AGIs $10k-25k, 1.2% for AGIs $25k-50k, 0.8% for AGIs $50k-75k, 0.8% for AGIs $75k-100k, 1.6% for AGIs over 100k)
Taxable dividends: $4,360 (reported on 19.8% of returns)
Here:
$4,360
State:
$3,420
(% of AGI for various income ranges: 5.1% for AGIs below $10k, 1.7% for AGIs $10k-25k, 1.0% for AGIs $25k-50k, 1.0% for AGIs $50k-75k, 0.9% for AGIs $75k-100k, 5.5% for AGIs over 100k)
Net capital gain/loss: +$7,627 (reported on 15.8% of returns)
Here:
+$7,627
State:
+$8,532
(% of AGI for various income ranges: -3.1% for AGIs below $10k, -0.0% for AGIs $10k-25k, 0.5% for AGIs $25k-50k, 1.1% for AGIs $50k-75k, 2.4% for AGIs $75k-100k, 9.8% for AGIs over 100k)
Profit/loss from business: +$6,926 (reported on 15.9% of returns)
Here:
+$6,926
State:
+$9,547
(% of AGI for various income ranges: 6.8% for AGIs below $10k, 6.0% for AGIs $10k-25k, 3.6% for AGIs $25k-50k, 2.0% for AGIs $50k-75k, 0.5% for AGIs $75k-100k, 2.3% for AGIs over 100k)
IRA payment deduction: $3,039 (reported on 2.0% of returns)
49408:
$3,039
Michigan:
$2,875
(% of AGI for various income ranges: 0.2% for AGIs $10k-25k, 0.2% for AGIs $25k-50k, 0.2% for AGIs $50k-75k, 0.3% for AGIs $75k-100k)
Self-employed pension: $12,300 (reported on 0.3% of returns)
Here:
$12,300
Michigan:
$13,826
Total itemized deductions: $15,935 (22% of AGI, reported on 31.1% of returns)
Here:
$15,935
State:
$18,509
Here:
22.1% of AGI
State:
20.7% of AGI
(% of AGI for various income ranges: 17.9% for AGIs below $10k, 10.9% for AGIs $10k-25k, 11.8% for AGIs $25k-50k, 13.6% for AGIs $50k-75k, 14.2% for AGIs $75k-100k, 11.6% for AGIs over 100k)
Charity contributions deductions: $2,593 (3% of AGI, reported on 25.2% of returns)
Here:
$2,593
State:
$3,365
Here:
3.3% of AGI
State:
3.6% of AGI
(% of AGI for various income ranges: 0.8% for AGIs below $10k, 1.0% for AGIs $10k-25k, 1.1% for AGIs $25k-50k, 1.7% for AGIs $50k-75k, 1.7% for AGIs $75k-100k, 2.5% for AGIs over 100k)
Total tax: $5,867 (reported on 70.0% of returns)
49408:
$5,867
State:
$7,691
(% of AGI for various income ranges: 4.1% for AGIs below $10k, 4.0% for AGIs $10k-25k, 6.3% for AGIs $25k-50k, 7.9% for AGIs $50k-75k, 10.3% for AGIs $75k-100k, 20.6% for AGIs over 100k)
Earned income credit: $1,718 (reported on 16.6% of returns)
Here:
$1,718
State:
$1,737
Percentage of individuals using paid preparers for their 2004 taxes: 61.8%
Here:
62%
State:
60%
(% for various income ranges: 53.0% for AGIs below $10k, 59.9% for AGIs $10k-25k, 64.0% for AGIs $25k-50k, 65.4% for AGIs $50k-75k, 69.3% for AGIs $75k-100k, 75.1% for AGIs over 100k)
Likely homosexual households (counted as self-reported same-sex unmarried-partner households)
Lesbian couples: 0.3% of all households
Gay men: 2.3% of all households
Household received Food Stamps/SNAP in the past 12 months: 360 Household did not receive Food Stamps/SNAP in the past 12 months: 3,663
Women who had a birth in the past 12 months: 67 (42 now married, 25 unmarried) Women who did not have a birth in the past 12 months: 1,971 (887 now married, 1,081 unmarried)
Housing units in zip code 49408 with a mortgage: 1,933 (168 second mortgage, 3 home equity loan, 102 both second mortgage and home equity loan) Houses without a mortgage: 28
Median monthly owner costs for units with a mortgage: $1,442 Median monthly owner costs for units without a mortgage: $545
Residents with income below the poverty level in 2022:
This zip code:
15.1%
Whole state:
13.4%
Residents with income below 50% of the poverty level in 2022:
This zip code:
6.0%
Whole state:
6.9%
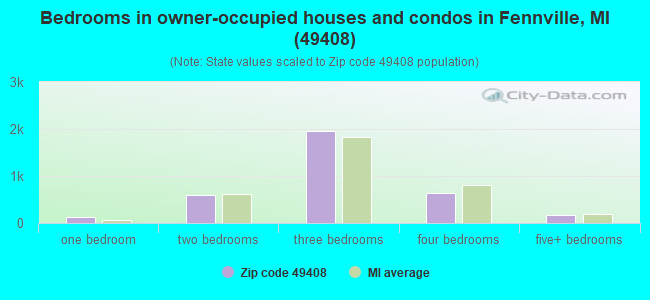
Median number of rooms in houses and condos:
Here:
6.2
State:
6.5
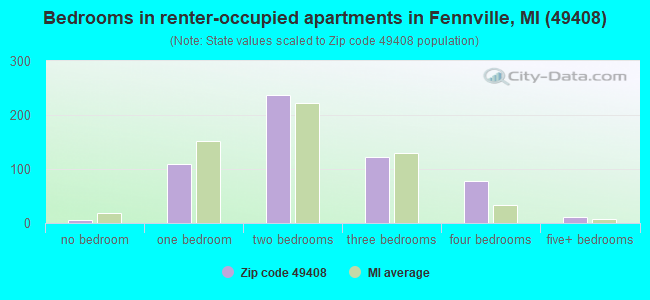
Median number of rooms in apartments:
Here:
4.3
State:
4.3
Notable locations in this zip code not listed on our city pages
Notable locations in zip code 49408: Ely Lake Campground (A), Horsemans Campground (B), Swan Creek Campground (C), Hemlock Point Gun Club (D), New Richmond Station (E), Pearl Station (F), Fennville Station (G), Campit Camp Ground (H), Lake Park Trailer Resort (I), Campania Farm (J), Ottawa Gun Club (K), Beverly Beach (L), Clyde Township Fire Department (M), Ganges Township Fire Department (N), Michigan Department of Natural Resources Allegan Field Office (O), Fennville City Hall (P), Fennville District Library (Q), Fennville Area Fire Department (R), American Medical Response Fennville (S). Display/hide their locations on the map
Churches in zip code 49408 include: Apostolica Church (A), Open Door Worship Center (B), General Church (C), Fennville United Methodist Church (D), Ganges Church (E), New Richmond Baptist Church (F), Immanuel Reformed Church (G), Fennville Assembly of God Church (H), Community Church of Douglas (I). Display/hide their locations on the map
Cemeteries: Manlius Cemetery (1), Pearl Cemetery (2), Oak Grove Cemetery (3), Hutchins Cemetery (4), Fennville Cemetery (5), Loomis Cemetery (6), Taylor Cemetery (7). Display/hide their locations on the map
Lakes and swamps: Little Tom Lake (A), Perch Lake (B), Hutchins Lake (C), Mud Lake (D), Big Goose Lake (E), Miner Lake (F), Ely Lake (G), Crooked Lake (H). Display/hide their locations on the map
Parks in zip code 49408 include: West Side County Park (1), Pier Cove Historical Marker (2), Allegan County Park (3). Display/hide their locations on the map
1,433 married couples with children.
577 single-parent households (227 men, 350 women).
83.8% of residents of 49408 zip code speak English at home.
15.8% of residents speak Spanish at home (62% very well, 25% well, 6% not well, 7% not at all).
0.8% of residents speak other Indo-European language at home (94% very well, 6% well).
0.2% of residents speak Asian or Pacific Island language at home (70% very well, 26% well, 4% not well).
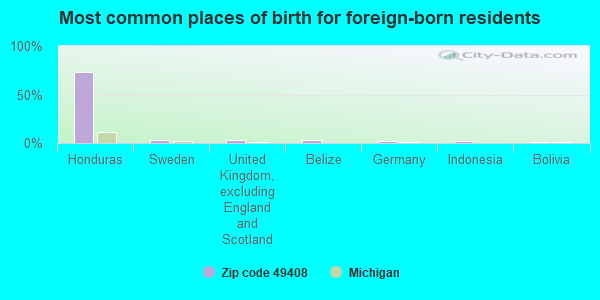
Foreign born population: 631 (6.0%) (43.9% of them are naturalized citizens)
This zip code:
6.0%
Whole state:
6.9%
73%Honduras
3%Sweden
3%United Kingdom, excluding England and Scotland
3%Belize
2%Germany
2%Indonesia
1%Bolivia
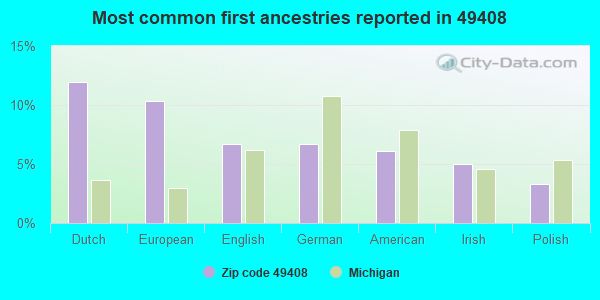
12%Dutch
10%European
7%English
7%German
6%American
5%Irish
3%Polish
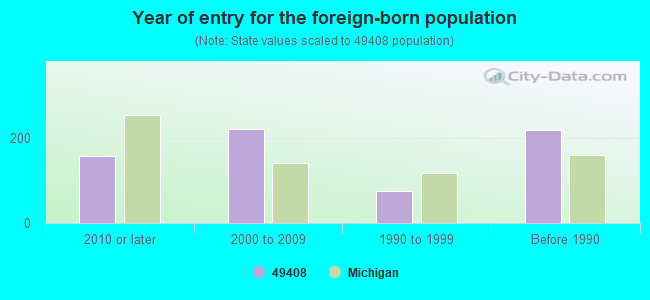
Year of entry for the foreign-born population
1572010 or later
2212000 to 2009
761990 to 1999
219Before 1990
Major facilities with environmental interests located in this zip code:
ANNA MICHEN LOWER ELEMENTARY SCHOOL (2 MEMORIAL DRIVE in FENNVILLE, MI)
(National Center for Education Statistics) - STATE ID-07494 Organizations: FENNVILLE PUBLIC SCHOOLS (SCHOOL DISTRICT)
ANNA MICHEN UPPER ELEM. SCHOOL (NORTH MAPLE in FENNVILLE, MI)
(National Center for Education Statistics) - STATE ID-00107 Organizations: FENNVILLE PUBLIC SCHOOLS (SCHOOL DISTRICT)
FENNVILLE MIDDLE SCHOOL (1 MEMORIAL DRIVE in FENNVILLE, MI)
(National Center for Education Statistics) - STATE ID-07311 Organizations: FENNVILLE PUBLIC SCHOOLS (SCHOOL DISTRICT)
FENNVILLE PUBLIC HIGH SCHOOL (4 MEMORIAL DRIVE in FENNVILLE, MI)
(National Center for Education Statistics) - STATE ID-01217 Organizations: FENNVILLE PUBLIC SCHOOLS (SCHOOL DISTRICT)
DISCOVERY ELEMENTARY SCHOOL (2611 56TH STREET in FENNVILLE, MI)
(National Center for Education Statistics) - STATE ID-08321
ACRO INCORPORATED (353 FIRST ST in FENNVILLE, MI)
National Pollutant Discharge Elimination System NON-MAJOR (Tracking pollutant discharge elimination systems) - permit National Pollutant Discharge Elimination System NON-MAJOR (Tracking pollutant discharge elimination systems) - permit Business SIC classification: PRINTING INK Organizations: ACRO INC-FENNVILLE (CONTACT/OWNER)
Alternative names: ACRO INC-FENNVILLE
BIRDSEYE FOODS (100 SHERMAN ST in FENNVILLE, MI)
AIR SYNTHETIC MINOR (AIRS/AFS) National Pollutant Discharge Elimination System NON-MAJOR (Tracking pollutant discharge elimination systems) - permit Business SIC classification: CANNED FRUITS, VEGETABLES, PRESERVES, JAMS, AND JELLIES; NONCLASSIFIABLE ESTABLISHMENTS Organizations: AGRILINK FOODS, INC (CONTACT/OWNER)
Alternative names: AGRI-LINK FOODS, AGRILINK FOODS INC-FENNVILLE
METALLURGICAL HIGH VACUUM CORP (6708 124TH AVE in FENNVILLE, MI)
Large Quantity Generators, more that 1000 kg of hazardous waste/month (Resource Conservation and Recovery Act (tracking hazardous waste)) Organizations: GEOFF HUMBERSTONE (CONTACT/OWNER)
MI DEPT/NATURAL RESOURCES (6013 118TH AVE in FENNVILLE, MI)
(Resource Conservation and Recovery Act (tracking hazardous waste)) Organizations: STATE OF MICHIGAN (CONTACT/OPERATOR)
MI DEPT/TRANSPORTATION BRIDGE B02-03021 (M-89 AT KALAMAZOO RIVER, EAST in FENNVILLE, MI)
(Resource Conservation and Recovery Act (tracking hazardous waste)) Organizations: MICH DEPT OF TRANSPORTATION (CONTACT/OPERATOR)
Alternative names: MIDOT BRIDGE M-89 OVER KALAMAZOO RIVER
FENNVILLE PUBLIC SCHOOLS (5 MEMORIAL DR in FENNVILLE, MI)
(Resource Conservation and Recovery Act (tracking hazardous waste))
FENNVILLE WWSL (SOUTHWEST OF 57TH ST AND M89 in FENNVILLE, MI)
National Pollutant Discharge Elimination System NON-MAJOR (Tracking pollutant discharge elimination systems) - permit Business SIC classification: SEWERAGE SYSTEMS Organizations: CITY OF FENNVILLE (CONTACT/OWNER)
FMC CORP ACG (RTE 1 in FENNVILLE, MI)
(Resource Conservation and Recovery Act (tracking hazardous waste))
Housing units lacking complete plumbing facilities: 1.0% Housing units lacking complete kitchen facilities: 0.8%
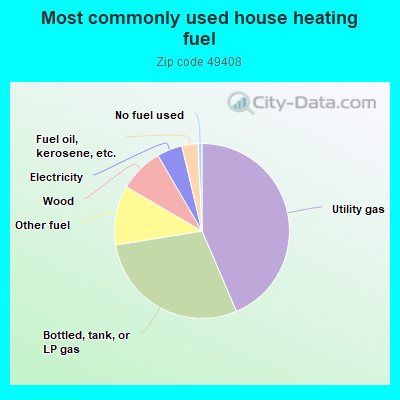
43.6%Utility gas
28.9%Bottled, tank, or LP gas
11.0%Other fuel
8.2%Wood
4.7%Electricity
3.0%Fuel oil, kerosene, etc.
0.7%No fuel used
Population in 1990: 6,486. Population change in the 1990s: +2,810 (+43.3%).
Place of birth for U.S.-born residents:
This state: 7,586
Northeast: 299
Midwest: 1,149
South: 678
West: 158
57% of the 49408 zip code residents lived in the same house 5 years ago. Out of people who lived in different houses, 53% lived in this county. Out of people who lived in different counties, 50% lived in Michigan.
92% of the 49408 zip code residents lived in the same house 1 year ago. Out of people who lived in different houses, 54% moved from this county. Out of people who lived in different houses, 26% moved from different county within same state. Out of people who lived in different houses, 11% moved from different state. Out of people who lived in different houses, 11% moved from abroad.
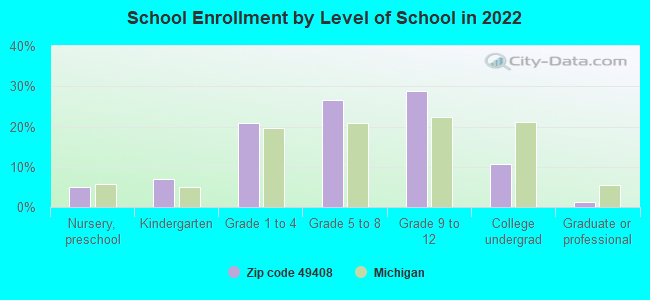
Private vs. public school enrollment:
Students in private schools in grades 1 to 8 (elementary and middle school): 27
Here:
2.5%
Michigan:
12.4%
Students in private schools in grades 9 to 12 (high school): 2
Here:
0.4%
Michigan:
9.8%
Students in private undergraduate colleges: 36
Here:
14.8%
Michigan:
14.9%
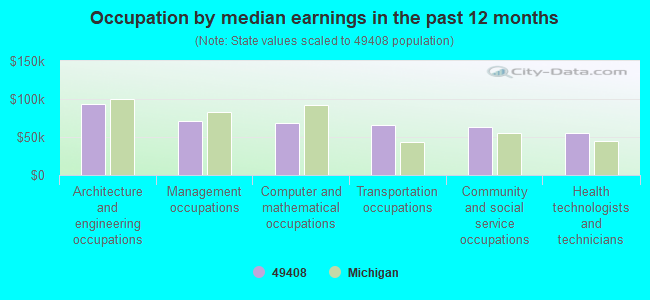
Occupation by median earnings in the past 12 months ($)
93,112Architecture and engineering occupations
71,043Management occupations
68,773Computer and mathematical occupations
65,953Transportation occupations
62,852Community and social service occupations
55,767Health technologists and technicians
Companies with federal contracts located in this zip code:
HARRINGTON CONSTRUCTION CO (6720 124TH AVE in FENNVILLE, MI)
$29,335 with U.S. Army Corps of Engineers - civil program financing only for Ship and Boat Propulsion Components. Signed on 2000-09-26. Completion date: 2000-11-30.
Top industries in this zip code by the number of employees in 2005:
Administrative and Support and Waste Management and Remediation Services: Employment Placement Agencies (50-99 employees: 1 establishment, 1-4 employees: 1 establishment)
2002 - 2018 National Fire Incident Reporting System (NFIRS) incidents
Based on the data from the years 2002 - 2018 the average number of fire incidents per year is 40. The highest number of reported fires - 72 took place in 2002, and the least - 17 in 2006. The data has a dropping trend.
When looking into fire subcategories, the most incidents belonged to: Structure Fires (57.5%), and Outside Fires (24.8%).
Fire incident types reported to NFIRS in Zip Code 49408


 Nearest zip codes: 49450, 49453, 49406, 49419, 49423, 49056.
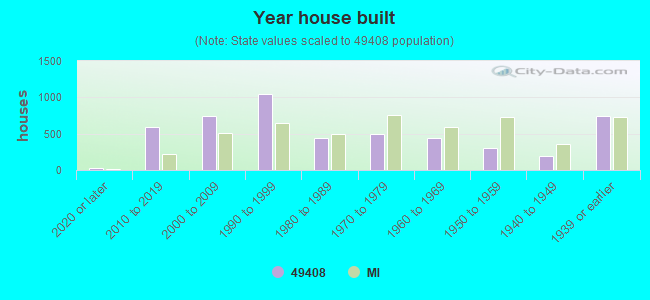


 Based on the data from the years 2002 - 2018 the average number of fire incidents per year is 40. The highest number of reported fires - 72 took place in 2002, and the least - 17 in 2006. The data has a dropping trend.
 When looking into fire subcategories, the most incidents belonged to: Structure Fires (57.5%), and Outside Fires (24.8%).