Estimated zip code population in 2022: 3,054 Zip code population in 2010: 3,302 Zip code population in 2000: 3,348
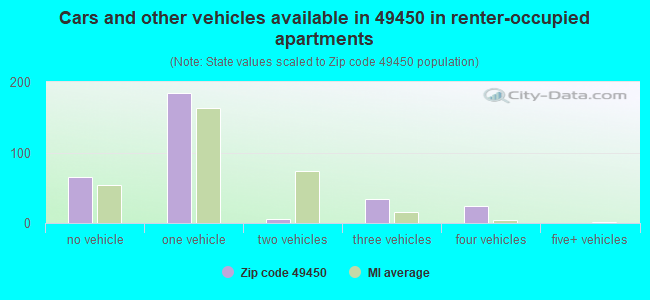
Houses and condos: 1,470 Renter-occupied apartments: 311
% of renters here:
32%
State:
27%
March 2022 cost of living index in zip code 49450: 82.4 (low, U.S. average is 100)
Land area: 29.5 sq. mi. Water area: 0.5 sq. mi.
Population density: 104 people per square mile
(very low).
OSM Map
General Map
Google Map
MSN Map
OSM Map
General Map
Google Map
MSN Map
OSM Map
General Map
Google Map
MSN Map
OSM Map
General Map
Google Map
MSN Map
Please wait while loading the map...
Real estate property taxes paid for housing units in 2022:
This zip code:
1.4% ($1,918)
Michigan:
1.2% ($2,746)
Median real estate property taxes paid for housing units with mortgages in 2022: $2,071 (2.2%) Median real estate property taxes paid for housing units with no mortgage in 2022: $1,879 (1.2%)
Business Search- 14 Million verified businesses
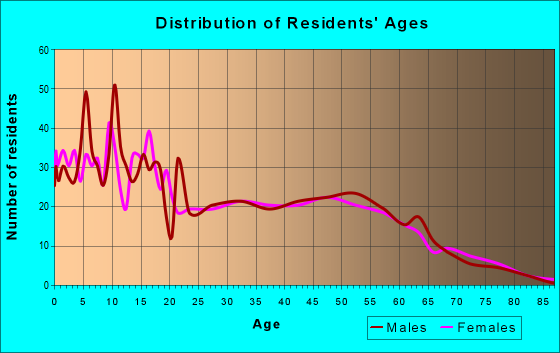
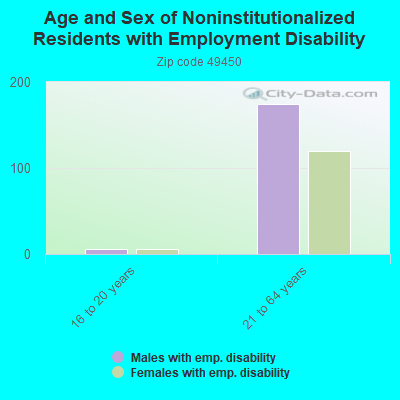
Males: 1,734
(56.8%)
Females: 1,319
(43.2%)
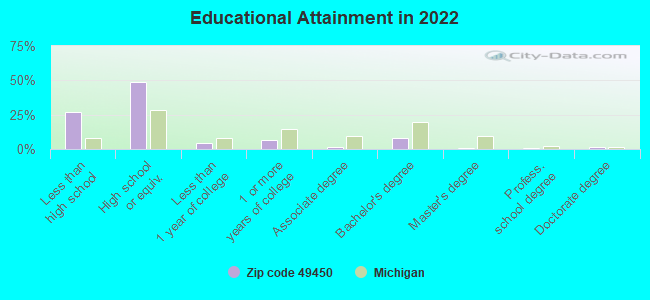
For population 25 years and over in 49450:
High school or higher: 72.0%
Bachelor's degree or higher: 11.6%
Graduate or professional degree: 3.4%
Unemployed: 3.5%
Mean travel time to work (commute): 29.8 minutes
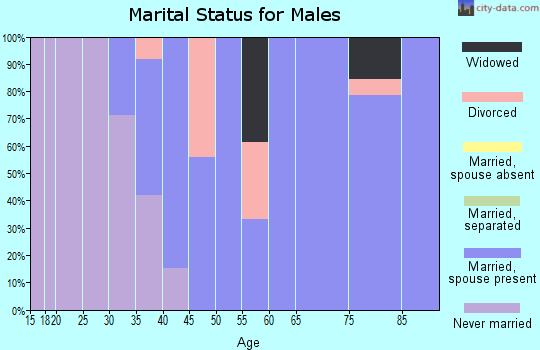
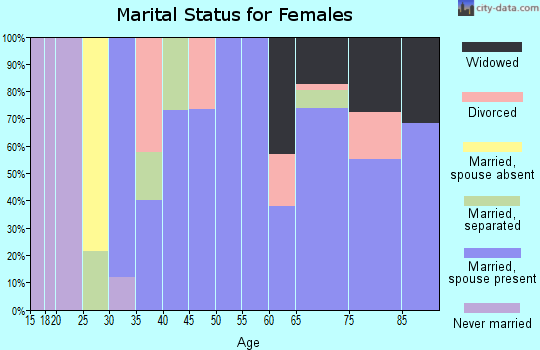
For population 15 years and over in 49450:
Never married: 32.4%
Now married: 45.3%
Separated: 9.3%
Widowed: 1.9%
Divorced: 11.0%
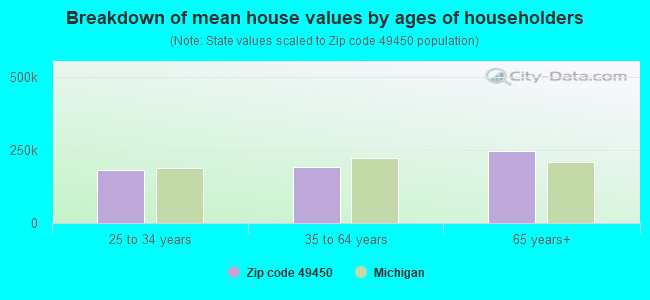
Zip code 49450 compared to state average:
Median house value below state average.
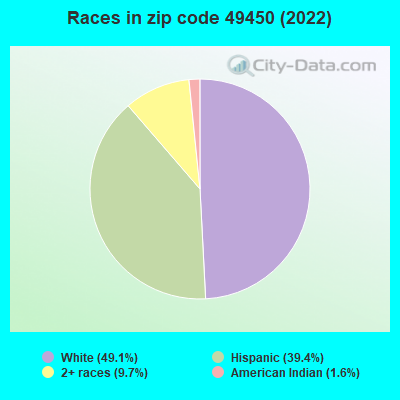
Black race population percentage significantly below state average.
Hispanic race population percentage significantly above state average.
Median age significantly below state average.
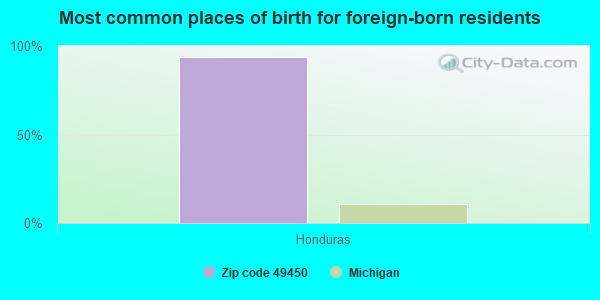
Foreign-born population percentage above state average.
Length of stay since moving in significantly above state average.
Percentage of population with a bachelor's degree or higher significantly below state average.
Averages for the 2020 tax year for zip code 49450, filed in 2021:
Average Adjusted Gross Income (AGI) in 2020: $38,844 (Individual Income Tax Returns)
Here:
$38,844
State:
$68,945
Salary/wage: $35,012 (reported on 84.0% of returns)
Here:
$35,012
State:
$57,142
(% of AGI for various income ranges: 1114.9% for AGIs below $25k, 3584.3% for AGIs $25k-50k, 6414.7% for AGIs $50k-75k, 9340.0% for AGIs $75k-100k, 18320.0% for AGIs $100k-200k)
Taxable interest for individuals: $353 (reported on 11.5% of returns)
This zip code:
$353
Michigan:
$1,630
(% of AGI for various income ranges: 1.8% for AGIs below $25k, 5.1% for AGIs $25k-50k, 6.7% for AGIs $50k-75k, 36.0% for AGIs $75k-100k)
Ordinary dividends: $786 (reported on 5.3% of returns)
Here:
$786
State:
$6,972
(% of AGI for various income ranges: 3.8% for AGIs below $25k, 26.7% for AGIs $50k-75k)
Net capital gain/loss in AGI: +$2,867 (reported on 4.6% of returns)
Here:
+$2,867
State:
+$20,064
(% of AGI for various income ranges: 14.9% for AGIs $25k-50k, 266.0% for AGIs $75k-100k)
Profit/loss from business: +$7,553 (reported on 13.0% of returns)
Here:
+$7,553
State:
+$11,172
(% of AGI for various income ranges: 70.8% for AGIs below $25k, 174.6% for AGIs $25k-50k, 264.7% for AGIs $50k-75k)
Taxable individual retirement arrangement distribution: $9,820 (reported on 3.8% of returns)
49450:
$9,820
Michigan:
$19,803
(% of AGI for various income ranges: 59.5% for AGIs below $25k, 172.7% for AGIs $50k-75k)
Earned income credit: $2,429 (reported on 26.0% of returns)
Here:
$2,429
State:
$2,251
(% of AGI for various income ranges: 119.2% for AGIs below $25k, 103.1% for AGIs $25k-50k)
Percentage of individuals using paid preparers for their 2020 taxes: 93.1%
Here:
93%
State:
93%
(% for various income ranges: 92.6% for AGIs below $25k, 90.9% for AGIs $25k-50k, 94.7% for AGIs $50k-75k, 100.0% for AGIs $75k-100k, 100.0% for AGIs $100k-200k)
Averages for the 2012 tax year for zip code 49450, filed in 2013:
Average Adjusted Gross Income (AGI) in 2012: $29,207 (Individual Income Tax Returns)
Here:
$29,207
State:
$55,609
Salary/wage: $27,250 (reported on 87.3% of returns)
Here:
$27,250
State:
$46,782
(% of AGI for various income ranges: 79.4% for AGIs below $25k, 85.2% for AGIs $25k-50k, 84.1% for AGIs $50k-75k, 83.8% for AGIs $75k-100k, 65.3% for AGIs $100k-200k)
Taxable interest for individuals: $538 (reported on 13.6% of returns)
This zip code:
$538
Michigan:
$1,491
(% of AGI for various income ranges: 0.3% for AGIs below $25k, 0.3% for AGIs $25k-50k, 0.5% for AGIs $50k-75k)
Ordinary dividends: $1,250 (reported on 5.1% of returns)
Here:
$1,250
State:
$6,225
(% of AGI for various income ranges: 0.3% for AGIs below $25k, 0.4% for AGIs $25k-50k)
Profit/loss from business: +$7,000 (reported on 12.7% of returns)
Here:
+$7,000
State:
+$11,523
(% of AGI for various income ranges: 7.7% for AGIs below $25k, 2.3% for AGIs $25k-50k, 2.5% for AGIs $50k-75k)
Taxable individual retirement arrangement distribution: $9,850 (reported on 5.1% of returns)
49450:
$9,850
Michigan:
$15,298
Total itemized deductions: $17,825 (27% of AGI, reported on 10.2% of returns)
Here:
$17,825
State:
$21,628
Here:
26.9% of AGI
State:
18.4% of AGI
(% of AGI for various income ranges: 5.6% for AGIs $25k-50k, 7.0% for AGIs $50k-75k, 25.3% for AGIs $75k-100k)
Charity contributions: $2,829 (reported on 5.9% of returns)
Here:
$2,829
State:
$4,225
(% of AGI for various income ranges: 0.3% for AGIs below $25k, 0.6% for AGIs $50k-75k, 3.4% for AGIs $75k-100k)
Taxes paid: $4,250 (reported on 10.2% of returns)
49450:
$4,250
State:
$8,327
(% of AGI for various income ranges: 1.1% for AGIs $25k-50k, 1.7% for AGIs $50k-75k, 6.6% for AGIs $75k-100k)
Earned income credit: $2,583 (reported on 34.7% of returns)
Here:
$2,583
State:
$2,306
(% of AGI for various income ranges: 10.8% for AGIs below $25k, 1.8% for AGIs $25k-50k)
Percentage of individuals using paid preparers for their 2012 taxes: 58.5%
Here:
58%
State:
57%
(% for various income ranges: 56.9% for AGIs below $25k, 58.8% for AGIs $25k-50k, 66.7% for AGIs $50k-75k, 100.0% for AGIs $75k-100k)
Averages for the 2004 tax year for zip code 49450, filed in 2005:
Average Adjusted Gross Income (AGI) in 2004: $27,655 (Individual Income Tax Returns)
Here:
$27,655
State:
$48,204
Salary/wage: $26,648 (reported on 89.2% of returns)
Here:
$26,648
State:
$42,791
(% of AGI for various income ranges: 88.8% for AGIs below $10k, 84.2% for AGIs $10k-25k, 90.5% for AGIs $25k-50k, 86.8% for AGIs $50k-75k, 80.8% for AGIs $75k-100k, 71.6% for AGIs over 100k)
Taxable interest for individuals: $550 (reported on 20.3% of returns)
This zip code:
$550
Michigan:
$1,725
(% of AGI for various income ranges: 2.3% for AGIs below $10k, 0.6% for AGIs $10k-25k, 0.4% for AGIs $25k-50k, 0.1% for AGIs $50k-75k, 0.2% for AGIs $75k-100k, 0.1% for AGIs over 100k)
Taxable dividends: $844 (reported on 7.6% of returns)
Here:
$844
State:
$3,420
(% of AGI for various income ranges: 0.9% for AGIs below $10k, 0.5% for AGIs $10k-25k, 0.1% for AGIs $25k-50k, 0.1% for AGIs $50k-75k, 0.3% for AGIs $75k-100k)
Net capital gain/loss: +$927 (reported on 6.9% of returns)
Here:
+$927
State:
+$8,532
(% of AGI for various income ranges: -1.5% for AGIs below $10k, 0.7% for AGIs $10k-25k, 0.0% for AGIs $25k-50k, -0.1% for AGIs $50k-75k, 1.6% for AGIs $75k-100k)
Profit/loss from business: +$4,316 (reported on 11.2% of returns)
Here:
+$4,316
State:
+$9,547
(% of AGI for various income ranges: 2.2% for AGIs below $10k, 4.9% for AGIs $10k-25k, 2.2% for AGIs $25k-50k, -0.4% for AGIs $50k-75k)
Total itemized deductions: $12,852 (24% of AGI, reported on 18.3% of returns)
Here:
$12,852
State:
$18,509
Here:
24.2% of AGI
State:
20.7% of AGI
(% of AGI for various income ranges: 5.3% for AGIs $10k-25k, 7.8% for AGIs $25k-50k, 11.4% for AGIs $50k-75k, 12.7% for AGIs $75k-100k, 9.8% for AGIs over 100k)
Charity contributions deductions: $2,078 (4% of AGI, reported on 13.0% of returns)
Here:
$2,078
State:
$3,365
Here:
3.9% of AGI
State:
3.6% of AGI
(% of AGI for various income ranges: 0.9% for AGIs $10k-25k, 1.0% for AGIs $25k-50k, 1.2% for AGIs $50k-75k, 1.6% for AGIs $75k-100k)
Total tax: $3,310 (reported on 56.7% of returns)
49450:
$3,310
State:
$7,691
(% of AGI for various income ranges: 2.3% for AGIs below $10k, 2.8% for AGIs $10k-25k, 5.6% for AGIs $25k-50k, 7.5% for AGIs $50k-75k, 10.0% for AGIs $75k-100k, 18.8% for AGIs over 100k)
Earned income credit: $1,982 (reported on 33.2% of returns)
Here:
$1,982
State:
$1,737
Percentage of individuals using paid preparers for their 2004 taxes: 57.2%
Here:
57%
State:
60%
(% for various income ranges: 58.4% for AGIs below $10k, 55.5% for AGIs $10k-25k, 55.7% for AGIs $25k-50k, 56.6% for AGIs $50k-75k, 70.3% for AGIs $75k-100k, 85.7% for AGIs over 100k)
Household received Food Stamps/SNAP in the past 12 months: 249 Household did not receive Food Stamps/SNAP in the past 12 months: 739
Women who had a birth in the past 12 months: 20 (20 now married, 0 unmarried) Women who did not have a birth in the past 12 months: 572 (254 now married, 317 unmarried)
Housing units in zip code 49450 with a mortgage: 240 (6 second mortgage, 3 both second mortgage and home equity loan) Median monthly owner costs for units with a mortgage: $1,044 Median monthly owner costs for units without a mortgage: $381
Residents with income below the poverty level in 2022:
This zip code:
27.3%
Whole state:
13.4%
Residents with income below 50% of the poverty level in 2022:
This zip code:
2.8%
Whole state:
6.9%
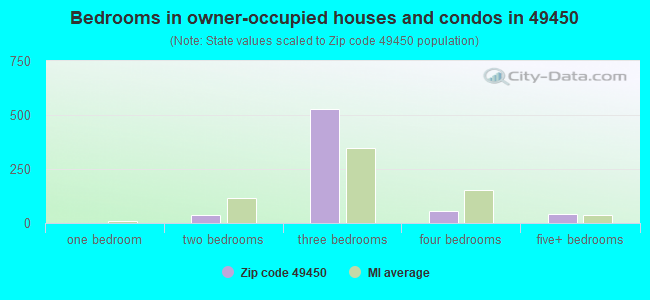
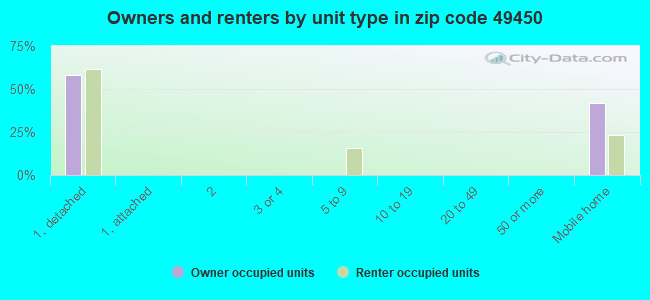
Median number of rooms in houses and condos:
Here:
6.1
State:
6.5
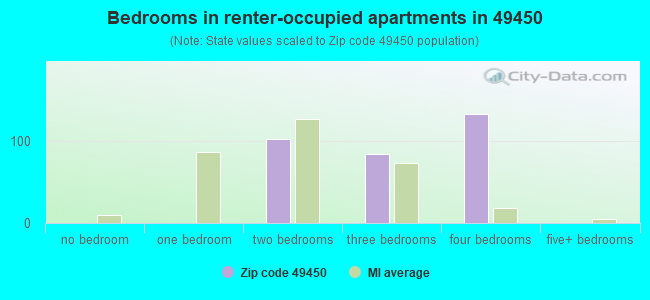
Median number of rooms in apartments:
Here:
5.5
State:
4.3
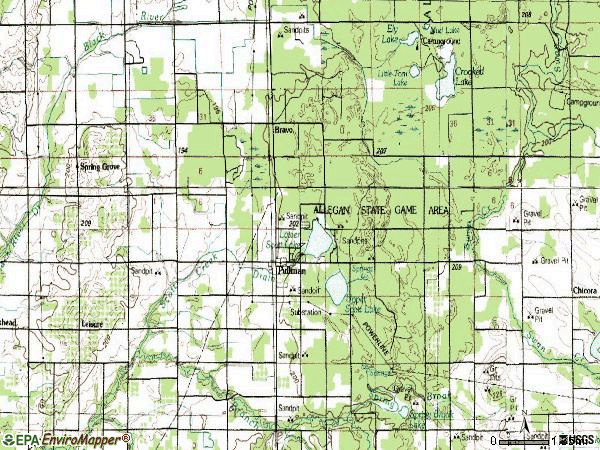
Notable locations in this zip code not listed on our city pages
Notable locations in zip code 49450: Camp Sears (A), Camp Channing (B), Pullman Station (C), Lee Township Fire Department (D), Pullman Library (E). Display/hide their locations on the map
Churches in zip code 49450 include: Mount Calvary Church (A), Country Chapel (B), Seventh Day Adventist Church (C), Christ Gospel Church (D), New Hope Missionary Baptist Church (E), Chicora Country Chapel (F), Pullman Bible Church (G). Display/hide their locations on the map
In group quarters: 96 (-1 institutionalized population)
Size of family households: 253 2-persons, 215 3-persons, 3 4-persons, 78 5-persons, 18 6-persons, 161 7-or-more-persons
Size of nonfamily households: 227 1-person, 20 2-persons
496 married couples with children.
616 single-parent households (144 men, 472 women).
70.7% of residents of 49450 zip code speak English at home.
27.0% of residents speak Spanish at home (79% very well, 9% well, 13% not well).
0.7% of residents speak other Indo-European language at home (94% very well, 6% well).
Foreign born population: 415 (13.6%) (4.9% of them are naturalized citizens)
This zip code:
13.6%
Whole state:
6.9%
94%Honduras
1%Australia
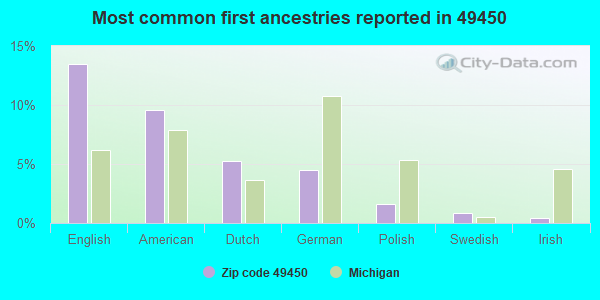
13%English
10%American
5%Dutch
4%German
2%Polish
1%Swedish
0%Irish
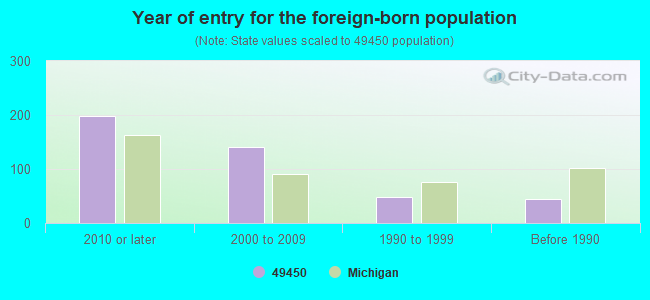
Year of entry for the foreign-born population
1982010 or later
1412000 to 2009
481990 to 1999
44Before 1990
Facilities with environmental interests located in this zip code:
MI DEPT/STATE POLICE (5205 110TH ST in PULLMAN, MI)
(Resource Conservation and Recovery Act (tracking hazardous waste)) Alternative names: MI DEPT/STATE POLICE (E)
ALS TOTAL (5625 109TH AVE in PULLMAN, MI)
Conditionally Exempt Small Quantity Generators, less than 100 kg/month of hazardous waste (Resource Conservation and Recovery Act (tracking hazardous waste)) Organizations: ALLAN BAUGUS (CONTACT/OPERATOR)
MI DEPT/ENVIRONMENTAL QUALITY (PULLMAN ROAD & 109TH STREET in PULLMAN, MI)
Conditionally Exempt Small Quantity Generators, less than 100 kg/month of hazardous waste (Resource Conservation and Recovery Act (tracking hazardous waste)) Organizations: MI DEPT/ENVIRONMENTAL QUALITY - RRD (CONTACT/OPERATOR)
Alternative names: MI DEPT/ENVIRONMENTAL QUALITY - RRD
Housing units lacking complete plumbing facilities: 3.5% Housing units lacking complete kitchen facilities: 3.5%
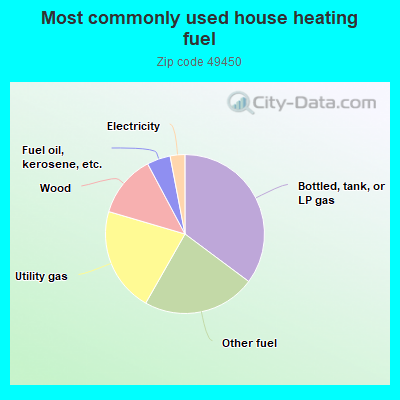
35.3%Bottled, tank, or LP gas
23.1%Other fuel
21.4%Utility gas
12.7%Wood
4.8%Fuel oil, kerosene, etc.
3.0%Electricity
Population in 1990: 2,672. Population change in the 1990s: +676 (+25.3%).
Place of birth for U.S.-born residents:
This state: 1,806
Northeast: 93
Midwest: 268
South: 293
West: 178
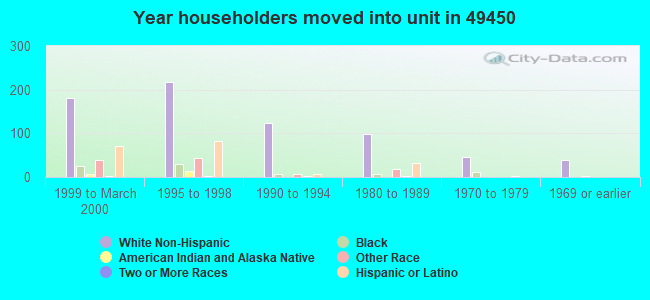
48% of the 49450 zip code residents lived in the same house 5 years ago. Out of people who lived in different houses, 42% lived in this county. Out of people who lived in different counties, 50% lived in Michigan.
97% of the 49450 zip code residents lived in the same house 1 year ago. Out of people who lived in different houses, 80% moved from this county. Out of people who lived in different houses, 27% moved from different county within same state.
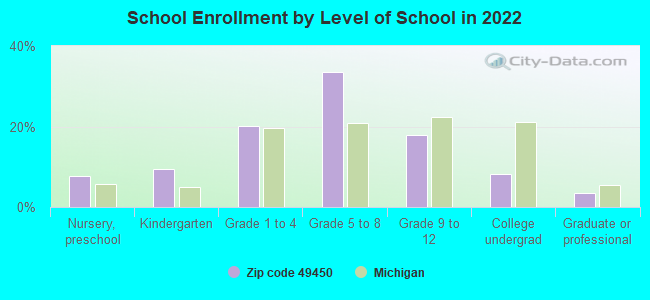
Private vs. public school enrollment:
Students in private schools in grades 1 to 8 (elementary and middle school): 4
Here:
0.8%
Michigan:
12.4%
Students in private schools in grades 9 to 12 (high school):
Here:
0.0%
Michigan:
9.8%
Students in private undergraduate colleges: 43
Here:
48.0%
Michigan:
14.9%
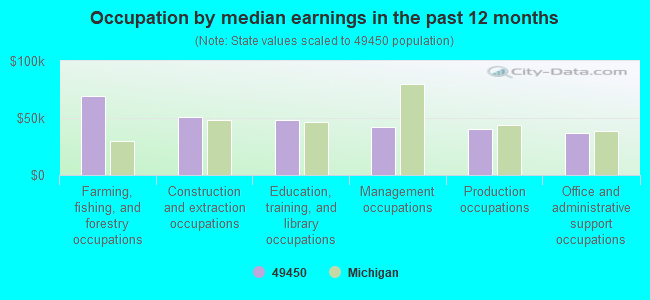
Occupation by median earnings in the past 12 months ($)
69,234Farming, fishing, and forestry occupations
50,741Construction and extraction occupations
47,956Education, training, and library occupations
41,719Management occupations
40,269Production occupations
37,123Office and administrative support occupations
Top industries in this zip code by the number of employees in 2005:
Other Services (except Public Administration): Religious Organizations (20-49 employees: 1 establishment)
Health Care and Social Assistance: All Other Outpatient Care Centers (20-49: 1)
Mining: Construction Sand and Gravel Mining (10-19: 1, 5-9: 1, 1-4: 1)
Construction: New Single-Family Housing Construction (except Operative Builders) (10-19: 1)
Accommodation and Food Services: Full-Service Restaurants (5-9: 1, 1-4: 1)
Other Services (except Public Administration): Other Personal and Household Goods Repair and Maintenance (1-4: 1)
Construction: Commercial and Institutional Building Construction (1-4: 1)
Professional, Scientific, and Technical Services: Engineering Services (1-4: 1)
People in group quarters in 2010:
8 people in group homes intended for adults
People in group quarters in 2000:
24 people in unknown juvenile institutions
24 people in other workers' dormitories
Fatal accident statistics in 2013:
Fatal accident count: 1
Vehicles involved in fatal accidents: 1
Fatal accidents caused by drunken drivers: 0
Fatalities: 1
Persons involved in fatal accidents: 1
Pedestrians involved in fatal accidents: 0
Fatal accident statistics in 2010:
Fatal accident count: 1
Vehicles involved in fatal accidents: 1
Fatal accidents caused by drunken drivers: 0
Fatalities: 1
Persons involved in fatal accidents: 1
Pedestrians involved in fatal accidents: 0
Home Mortgage Disclosure Act Aggregated Statistics For Year 2003 (Based on 2 partial tracts)
A) FHA, FSA/RHS & VA Home Purchase Loans
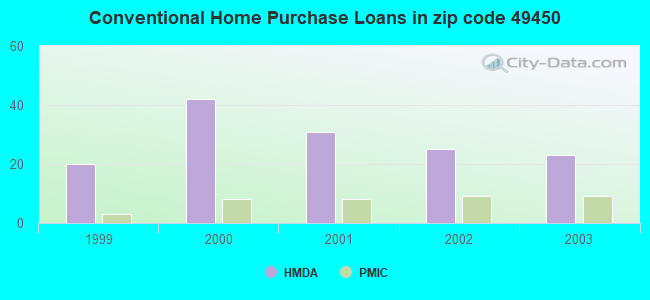
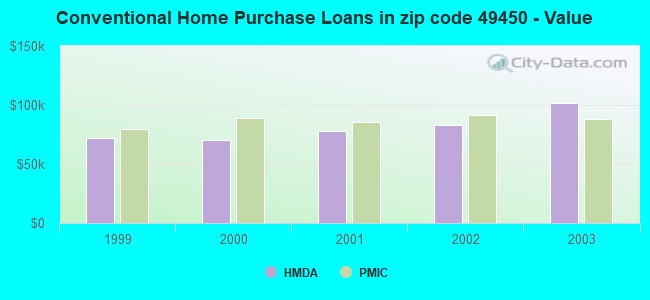
B) Conventional Home Purchase Loans
C) Refinancings
D) Home Improvement Loans
F) Non-occupant Loans on < 5 Family Dwellings (A B C & D)
Number
Average Value
Number
Average Value
Number
Average Value
Number
Average Value
Number
Average Value
LOANS ORIGINATED
7
$102,139
23
$101,438
145
$94,668
10
$31,546
16
$89,980
APPLICATIONS APPROVED, NOT ACCEPTED
1
$56,030
4
$88,152
31
$88,384
2
$18,880
3
$59,683
APPLICATIONS DENIED
4
$94,090
25
$58,756
109
$87,445
15
$19,041
4
$90,590
APPLICATIONS WITHDRAWN
0
$0
5
$75,150
36
$106,372
0
$0
2
$75,820
FILES CLOSED FOR INCOMPLETENESS
1
$50,550
2
$57,245
9
$86,276
1
$13,400
1
$56,640
Aggregated Statistics For Year 2002 (Based on 2 partial tracts)
A) FHA, FSA/RHS & VA Home Purchase Loans
B) Conventional Home Purchase Loans
C) Refinancings
D) Home Improvement Loans
E) Loans on Dwellings For 5+ Families
F) Non-occupant Loans on < 5 Family Dwellings (A B C & D)
Number
Average Value
Number
Average Value
Number
Average Value
Number
Average Value
Number
Average Value
Number
Average Value
LOANS ORIGINATED
6
$95,512
25
$82,629
125
$88,860
13
$20,425
0
$0
13
$70,175
APPLICATIONS APPROVED, NOT ACCEPTED
1
$88,910
8
$94,015
19
$84,555
3
$35,323
0
$0
0
$0
APPLICATIONS DENIED
2
$96,220
16
$57,322
83
$76,668
15
$18,107
1
$35,930
4
$45,828
APPLICATIONS WITHDRAWN
0
$0
5
$141,898
39
$79,935
0
$0
0
$0
1
$105,360
FILES CLOSED FOR INCOMPLETENESS
0
$0
1
$55,420
10
$111,995
0
$0
0
$0
0
$0
Aggregated Statistics For Year 2001 (Based on 2 partial tracts)
A) FHA, FSA/RHS & VA Home Purchase Loans
B) Conventional Home Purchase Loans
C) Refinancings
D) Home Improvement Loans
F) Non-occupant Loans on < 5 Family Dwellings (A B C & D)
Number
Average Value
Number
Average Value
Number
Average Value
Number
Average Value
Number
Average Value
LOANS ORIGINATED
5
$90,620
31
$77,893
105
$86,258
22
$30,312
10
$86,539
APPLICATIONS APPROVED, NOT ACCEPTED
1
$116,930
4
$52,375
16
$85,869
6
$19,893
2
$55,420
APPLICATIONS DENIED
1
$86,480
37
$46,646
91
$73,850
27
$22,510
5
$40,924
APPLICATIONS WITHDRAWN
0
$0
1
$74,300
34
$77,719
2
$45,370
1
$116,320
FILES CLOSED FOR INCOMPLETENESS
0
$0
0
$0
7
$92,569
1
$48,720
0
$0
Aggregated Statistics For Year 2000 (Based on 2 partial tracts)
A) FHA, FSA/RHS & VA Home Purchase Loans
B) Conventional Home Purchase Loans
C) Refinancings
D) Home Improvement Loans
F) Non-occupant Loans on < 5 Family Dwellings (A B C & D)
Number
Average Value
Number
Average Value
Number
Average Value
Number
Average Value
Number
Average Value
LOANS ORIGINATED
4
$114,035
42
$69,919
57
$61,904
24
$19,006
10
$62,971
APPLICATIONS APPROVED, NOT ACCEPTED
1
$72,470
9
$52,916
19
$61,188
10
$25,700
1
$18,270
APPLICATIONS DENIED
1
$43,850
59
$52,106
62
$53,523
44
$16,111
4
$31,060
APPLICATIONS WITHDRAWN
0
$0
3
$61,103
27
$62,885
1
$30,450
2
$91,960
FILES CLOSED FOR INCOMPLETENESS
1
$25,580
0
$0
7
$72,644
0
$0
0
$0
Aggregated Statistics For Year 1999 (Based on 1 partial tract)
A) FHA, FSA/RHS & VA Home Purchase Loans
B) Conventional Home Purchase Loans
C) Refinancings
D) Home Improvement Loans
E) Loans on Dwellings For 5+ Families
F) Non-occupant Loans on < 5 Family Dwellings (A B C & D)
Detailed PMIC statistics for the following Tracts:0310.00
2002 - 2018 National Fire Incident Reporting System (NFIRS) incidents
According to the data from the years 2002 - 2018 the average number of fire incidents per year is 39. The highest number of reported fire incidents - 57 took place in 2005, and the least - 13 in 2015. The data has a rising trend.
When looking into fire subcategories, the most incidents belonged to: Structure Fires (58.8%), and Outside Fires (32.0%).
Fire incident types reported to NFIRS in Zip Code 49450
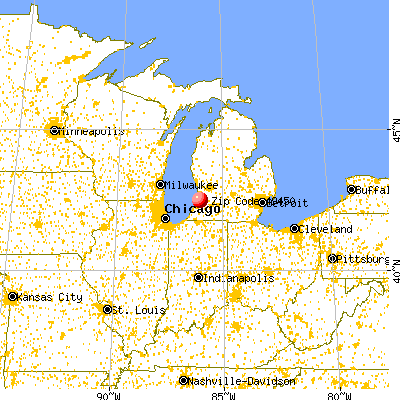


 Nearest zip codes: 49056, 49408, 49027, 49090, 49026, 49013.


 According to the data from the years 2002 - 2018 the average number of fire incidents per year is 39. The highest number of reported fire incidents - 57 took place in 2005, and the least - 13 in 2015. The data has a rising trend.
 When looking into fire subcategories, the most incidents belonged to: Structure Fires (58.8%), and Outside Fires (32.0%).