Estimated zip code population in 2022: 13,681
Zip code population in 2010: 13,810
Zip code population in 2000: 15,031
Houses and condos: 8,696
Renter-occupied apartments: 1,328
% of renters here:
23%State:
27%
March 2022 cost of living index in zip code 49090: 82.5
(low, U.S. average is 100)
Land area: 78.8
sq. mi.
Water area: 2.3
sq. mi.
Population density: 174 people per square mile (very low).
OSM Map
General Map
Google Map
MSN Map
OSM Map
General Map
Google Map
MSN Map
OSM Map
General Map
Google Map
MSN Map
OSM Map
General Map
Google Map
MSN Map
Please wait while loading the map...
Real estate property taxes paid for housing units in 2022:
This zip code:
1.1% ($2,791)Michigan:
1.2% ($2,746)
Median real estate property taxes paid for housing units with mortgages in 2022: $2,761 (1.0%)
Median real estate property taxes paid for housing units with no mortgage in 2022: $2,871 (1.2%)
Profiles of local businesses
Business Search - 14 Million verified businesses
Males: 6,615 Females: 7,066
For population 25 years and over in 49090:
High school or higher: 87.0%Bachelor's degree or higher: 29.0%Graduate or professional degree: 12.1%Unemployed: 2.7%Mean travel time to work (commute): 21.1 minutes
For population 15 years and over in 49090:
Never married: 19.8%Now married: 58.1%Separated: 1.6%Widowed: 8.7%Divorced: 11.7%
Zip code 49090 compared to state average:
Unemployed percentage below state average. Black race population percentage below state average. Hispanic race population percentage above state average. Median age significantly above state average. Length of stay since moving in significantly above state average. Number of college students below state average. 10,234 74.8% White 1,725 12.6% Hispanic or Latino 902 6.6% Black 474 3.5% Two or more races 259 1.9% Asian 83 0.6% American Indian
Data:
Median household income ($)
Median household income (% change since 2000)
Household income diversity
Ratio of average income to average house value (%)
Ratio of average income to average rent
Median household income ($) - White
Median household income ($) - Black or African American
Median household income ($) - Asian
Median household income ($) - Hispanic or Latino
Median household income ($) - American Indian and Alaska Native
Median household income ($) - Multirace
Median household income ($) - Other Race
Median household income for houses/condos with a mortgage ($)
Median household income for apartments without a mortgage ($)
Races - White alone (%)
Races - White alone (% change since 2000)
Races - Black alone (%)
Races - Black alone (% change since 2000)
Races - American Indian alone (%)
Races - American Indian alone (% change since 2000)
Races - Asian alone (%)
Races - Asian alone (% change since 2000)
Races - Hispanic (%)
Races - Hispanic (% change since 2000)
Races - Native Hawaiian and Other Pacific Islander alone (%)
Races - Native Hawaiian and Other Pacific Islander alone (% change since 2000)
Races - Two or more races (%)
Races - Two or more races (% change since 2000)
Races - Other race alone (%)
Races - Other race alone (% change since 2000)
Racial diversity
Unemployment (%)
Unemployment (% change since 2000)
Unemployment (%) - White
Unemployment (%) - Black or African American
Unemployment (%) - Asian
Unemployment (%) - Hispanic or Latino
Unemployment (%) - American Indian and Alaska Native
Unemployment (%) - Multirace
Unemployment (%) - Other Race
Population density (people per square mile)
Population - Males (%)
Population - Females (%)
Population - Males (%) - White
Population - Males (%) - Black or African American
Population - Males (%) - Asian
Population - Males (%) - Hispanic or Latino
Population - Males (%) - American Indian and Alaska Native
Population - Males (%) - Multirace
Population - Males (%) - Other Race
Population - Females (%) - White
Population - Females (%) - Black or African American
Population - Females (%) - Asian
Population - Females (%) - Hispanic or Latino
Population - Females (%) - American Indian and Alaska Native
Population - Females (%) - Multirace
Population - Females (%) - Other Race
Coronavirus confirmed cases (Apr 27, 2024)
Deaths caused by coronavirus (Apr 27, 2024)
Coronavirus confirmed cases (per 100k population) (Apr 27, 2024)
Deaths caused by coronavirus (per 100k population) (Apr 27, 2024)
Daily increase in number of cases (Apr 27, 2024)
Weekly increase in number of cases (Apr 27, 2024)
Cases doubled (in days) (Apr 27, 2024)
Hospitalized patients (Apr 18, 2022)
Negative test results (Apr 18, 2022)
Total test results (Apr 18, 2022)
COVID Vaccine doses distributed (per 100k population) (Sep 19, 2023)
COVID Vaccine doses administered (per 100k population) (Sep 19, 2023)
COVID Vaccine doses distributed (Sep 19, 2023)
COVID Vaccine doses administered (Sep 19, 2023)
Likely homosexual households (%)
Likely homosexual households (% change since 2000)
Likely homosexual households - Lesbian couples (%)
Likely homosexual households - Lesbian couples (% change since 2000)
Likely homosexual households - Gay men (%)
Likely homosexual households - Gay men (% change since 2000)
Cost of living index
Median gross rent ($)
Median contract rent ($)
Median monthly housing costs ($)
Median house or condo value ($)
Median house or condo value ($ change since 2000)
Mean house or condo value by units in structure - 1, detached ($)
Mean house or condo value by units in structure - 1, attached ($)
Mean house or condo value by units in structure - 2 ($)
Mean house or condo value by units in structure by units in structure - 3 or 4 ($)
Mean house or condo value by units in structure - 5 or more ($)
Mean house or condo value by units in structure - Boat, RV, van, etc. ($)
Mean house or condo value by units in structure - Mobile home ($)
Median house or condo value ($) - White
Median house or condo value ($) - Black or African American
Median house or condo value ($) - Asian
Median house or condo value ($) - Hispanic or Latino
Median house or condo value ($) - American Indian and Alaska Native
Median house or condo value ($) - Multirace
Median house or condo value ($) - Other Race
Median resident age
Resident age diversity
Median resident age - Males
Median resident age - Females
Median resident age - White
Median resident age - Black or African American
Median resident age - Asian
Median resident age - Hispanic or Latino
Median resident age - American Indian and Alaska Native
Median resident age - Multirace
Median resident age - Other Race
Median resident age - Males - White
Median resident age - Males - Black or African American
Median resident age - Males - Asian
Median resident age - Males - Hispanic or Latino
Median resident age - Males - American Indian and Alaska Native
Median resident age - Males - Multirace
Median resident age - Males - Other Race
Median resident age - Females - White
Median resident age - Females - Black or African American
Median resident age - Females - Asian
Median resident age - Females - Hispanic or Latino
Median resident age - Females - American Indian and Alaska Native
Median resident age - Females - Multirace
Median resident age - Females - Other Race
Commute - mean travel time to work (minutes)
Travel time to work - Less than 5 minutes (%)
Travel time to work - Less than 5 minutes (% change since 2000)
Travel time to work - 5 to 9 minutes (%)
Travel time to work - 5 to 9 minutes (% change since 2000)
Travel time to work - 10 to 19 minutes (%)
Travel time to work - 10 to 19 minutes (% change since 2000)
Travel time to work - 20 to 29 minutes (%)
Travel time to work - 20 to 29 minutes (% change since 2000)
Travel time to work - 30 to 39 minutes (%)
Travel time to work - 30 to 39 minutes (% change since 2000)
Travel time to work - 40 to 59 minutes (%)
Travel time to work - 40 to 59 minutes (% change since 2000)
Travel time to work - 60 to 89 minutes (%)
Travel time to work - 60 to 89 minutes (% change since 2000)
Travel time to work - 90 or more minutes (%)
Travel time to work - 90 or more minutes (% change since 2000)
Marital status - Never married (%)
Marital status - Now married (%)
Marital status - Separated (%)
Marital status - Widowed (%)
Marital status - Divorced (%)
Median family income ($)
Median family income (% change since 2000)
Median non-family income ($)
Median non-family income (% change since 2000)
Median per capita income ($)
Median per capita income (% change since 2000)
Median family income ($) - White
Median family income ($) - Black or African American
Median family income ($) - Asian
Median family income ($) - Hispanic or Latino
Median family income ($) - American Indian and Alaska Native
Median family income ($) - Multirace
Median family income ($) - Other Race
Median year house/condo built
Median year apartment built
Year house built - Built 2005 or later (%)
Year house built - Built 2000 to 2004 (%)
Year house built - Built 1990 to 1999 (%)
Year house built - Built 1980 to 1989 (%)
Year house built - Built 1970 to 1979 (%)
Year house built - Built 1960 to 1969 (%)
Year house built - Built 1950 to 1959 (%)
Year house built - Built 1940 to 1949 (%)
Year house built - Built 1939 or earlier (%)
Average household size
Household density (households per square mile)
Average household size - White
Average household size - Black or African American
Average household size - Asian
Average household size - Hispanic or Latino
Average household size - American Indian and Alaska Native
Average household size - Multirace
Average household size - Other Race
Occupied housing units (%)
Vacant housing units (%)
Owner occupied housing units (%)
Renter occupied housing units (%)
Vacancy status - For rent (%)
Vacancy status - For sale only (%)
Vacancy status - Rented or sold, not occupied (%)
Vacancy status - For seasonal, recreational, or occasional use (%)
Vacancy status - For migrant workers (%)
Vacancy status - Other vacant (%)
Residents with income below the poverty level (%)
Residents with income below 50% of the poverty level (%)
Children below poverty level (%)
Poor families by family type - Married-couple family (%)
Poor families by family type - Male, no wife present (%)
Poor families by family type - Female, no husband present (%)
Poverty status for native-born residents (%)
Poverty status for foreign-born residents (%)
Poverty among high school graduates not in families (%)
Poverty among people who did not graduate high school not in families (%)
Residents with income below the poverty level (%) - White
Residents with income below the poverty level (%) - Black or African American
Residents with income below the poverty level (%) - Asian
Residents with income below the poverty level (%) - Hispanic or Latino
Residents with income below the poverty level (%) - American Indian and Alaska Native
Residents with income below the poverty level (%) - Multirace
Residents with income below the poverty level (%) - Other Race
Air pollution - Air Quality Index (AQI)
Air pollution - CO
Air pollution - NO2
Air pollution - SO2
Air pollution - Ozone
Air pollution - PM10
Air pollution - PM25
Air pollution - Pb
Crime - Murders per 100,000 population
Crime - Rapes per 100,000 population
Crime - Robberies per 100,000 population
Crime - Assaults per 100,000 population
Crime - Burglaries per 100,000 population
Crime - Thefts per 100,000 population
Crime - Auto thefts per 100,000 population
Crime - Arson per 100,000 population
Crime - City-data.com crime index
Crime - Violent crime index
Crime - Property crime index
Crime - Murders per 100,000 population (5 year average)
Crime - Rapes per 100,000 population (5 year average)
Crime - Robberies per 100,000 population (5 year average)
Crime - Assaults per 100,000 population (5 year average)
Crime - Burglaries per 100,000 population (5 year average)
Crime - Thefts per 100,000 population (5 year average)
Crime - Auto thefts per 100,000 population (5 year average)
Crime - Arson per 100,000 population (5 year average)
Crime - City-data.com crime index (5 year average)
Crime - Violent crime index (5 year average)
Crime - Property crime index (5 year average)
1996 Presidential Elections Results (%) - Democratic Party (Clinton)
1996 Presidential Elections Results (%) - Republican Party (Dole)
1996 Presidential Elections Results (%) - Other
2000 Presidential Elections Results (%) - Democratic Party (Gore)
2000 Presidential Elections Results (%) - Republican Party (Bush)
2000 Presidential Elections Results (%) - Other
2004 Presidential Elections Results (%) - Democratic Party (Kerry)
2004 Presidential Elections Results (%) - Republican Party (Bush)
2004 Presidential Elections Results (%) - Other
2008 Presidential Elections Results (%) - Democratic Party (Obama)
2008 Presidential Elections Results (%) - Republican Party (McCain)
2008 Presidential Elections Results (%) - Other
2012 Presidential Elections Results (%) - Democratic Party (Obama)
2012 Presidential Elections Results (%) - Republican Party (Romney)
2012 Presidential Elections Results (%) - Other
2016 Presidential Elections Results (%) - Democratic Party (Clinton)
2016 Presidential Elections Results (%) - Republican Party (Trump)
2016 Presidential Elections Results (%) - Other
2020 Presidential Elections Results (%) - Democratic Party (Biden)
2020 Presidential Elections Results (%) - Republican Party (Trump)
2020 Presidential Elections Results (%) - Other
Ancestries Reported - Arab (%)
Ancestries Reported - Czech (%)
Ancestries Reported - Danish (%)
Ancestries Reported - Dutch (%)
Ancestries Reported - English (%)
Ancestries Reported - French (%)
Ancestries Reported - French Canadian (%)
Ancestries Reported - German (%)
Ancestries Reported - Greek (%)
Ancestries Reported - Hungarian (%)
Ancestries Reported - Irish (%)
Ancestries Reported - Italian (%)
Ancestries Reported - Lithuanian (%)
Ancestries Reported - Norwegian (%)
Ancestries Reported - Polish (%)
Ancestries Reported - Portuguese (%)
Ancestries Reported - Russian (%)
Ancestries Reported - Scotch-Irish (%)
Ancestries Reported - Scottish (%)
Ancestries Reported - Slovak (%)
Ancestries Reported - Subsaharan African (%)
Ancestries Reported - Swedish (%)
Ancestries Reported - Swiss (%)
Ancestries Reported - Ukrainian (%)
Ancestries Reported - United States (%)
Ancestries Reported - Welsh (%)
Ancestries Reported - West Indian (%)
Ancestries Reported - Other (%)
Educational Attainment - No schooling completed (%)
Educational Attainment - Less than high school (%)
Educational Attainment - High school or equivalent (%)
Educational Attainment - Less than 1 year of college (%)
Educational Attainment - 1 or more years of college (%)
Educational Attainment - Associate degree (%)
Educational Attainment - Bachelor's degree (%)
Educational Attainment - Master's degree (%)
Educational Attainment - Professional school degree (%)
Educational Attainment - Doctorate degree (%)
School Enrollment - Nursery, preschool (%)
School Enrollment - Kindergarten (%)
School Enrollment - Grade 1 to 4 (%)
School Enrollment - Grade 5 to 8 (%)
School Enrollment - Grade 9 to 12 (%)
School Enrollment - College undergrad (%)
School Enrollment - Graduate or professional (%)
School Enrollment - Not enrolled in school (%)
School enrollment - Public schools (%)
School enrollment - Private schools (%)
School enrollment - Not enrolled (%)
Median number of rooms in houses and condos
Median number of rooms in apartments
Housing units lacking complete plumbing facilities (%)
Housing units lacking complete kitchen facilities (%)
Density of houses
Urban houses (%)
Rural houses (%)
Households with people 60 years and over (%)
Households with people 65 years and over (%)
Households with people 75 years and over (%)
Households with one or more nonrelatives (%)
Households with no nonrelatives (%)
Population in households (%)
Family households (%)
Nonfamily households (%)
Population in families (%)
Family households with own children (%)
Median number of bedrooms in owner occupied houses
Mean number of bedrooms in owner occupied houses
Median number of bedrooms in renter occupied houses
Mean number of bedrooms in renter occupied houses
Median number of vehichles in owner occupied houses
Mean number of vehichles in owner occupied houses
Median number of vehichles in renter occupied houses
Mean number of vehichles in renter occupied houses
Mortgage status - with mortgage (%)
Mortgage status - with second mortgage (%)
Mortgage status - with home equity loan (%)
Mortgage status - with both second mortgage and home equity loan (%)
Mortgage status - without a mortgage (%)
Average family size
Average family size - White
Average family size - Black or African American
Average family size - Asian
Average family size - Hispanic or Latino
Average family size - American Indian and Alaska Native
Average family size - Multirace
Average family size - Other Race
Geographical mobility - Same house 1 year ago (%)
Geographical mobility - Moved within same county (%)
Geographical mobility - Moved from different county within same state (%)
Geographical mobility - Moved from different state (%)
Geographical mobility - Moved from abroad (%)
Place of birth - Born in state of residence (%)
Place of birth - Born in other state (%)
Place of birth - Native, outside of US (%)
Place of birth - Foreign born (%)
Housing units in structures - 1, detached (%)
Housing units in structures - 1, attached (%)
Housing units in structures - 2 (%)
Housing units in structures - 3 or 4 (%)
Housing units in structures - 5 to 9 (%)
Housing units in structures - 10 to 19 (%)
Housing units in structures - 20 to 49 (%)
Housing units in structures - 50 or more (%)
Housing units in structures - Mobile home (%)
Housing units in structures - Boat, RV, van, etc. (%)
House/condo owner moved in on average (years ago)
Renter moved in on average (years ago)
Year householder moved into unit - Moved in 1999 to March 2000 (%)
Year householder moved into unit - Moved in 1995 to 1998 (%)
Year householder moved into unit - Moved in 1990 to 1994 (%)
Year householder moved into unit - Moved in 1980 to 1989 (%)
Year householder moved into unit - Moved in 1970 to 1979 (%)
Year householder moved into unit - Moved in 1969 or earlier (%)
Means of transportation to work - Drove car alone (%)
Means of transportation to work - Carpooled (%)
Means of transportation to work - Public transportation (%)
Means of transportation to work - Bus or trolley bus (%)
Means of transportation to work - Streetcar or trolley car (%)
Means of transportation to work - Subway or elevated (%)
Means of transportation to work - Railroad (%)
Means of transportation to work - Ferryboat (%)
Means of transportation to work - Taxicab (%)
Means of transportation to work - Motorcycle (%)
Means of transportation to work - Bicycle (%)
Means of transportation to work - Walked (%)
Means of transportation to work - Other means (%)
Working at home (%)
Industry diversity
Most Common Industries - Agriculture, forestry, fishing and hunting, and mining (%)
Most Common Industries - Agriculture, forestry, fishing and hunting (%)
Most Common Industries - Mining, quarrying, and oil and gas extraction (%)
Most Common Industries - Construction (%)
Most Common Industries - Manufacturing (%)
Most Common Industries - Wholesale trade (%)
Most Common Industries - Retail trade (%)
Most Common Industries - Transportation and warehousing, and utilities (%)
Most Common Industries - Transportation and warehousing (%)
Most Common Industries - Utilities (%)
Most Common Industries - Information (%)
Most Common Industries - Finance and insurance, and real estate and rental and leasing (%)
Most Common Industries - Finance and insurance (%)
Most Common Industries - Real estate and rental and leasing (%)
Most Common Industries - Professional, scientific, and management, and administrative and waste management services (%)
Most Common Industries - Professional, scientific, and technical services (%)
Most Common Industries - Management of companies and enterprises (%)
Most Common Industries - Administrative and support and waste management services (%)
Most Common Industries - Educational services, and health care and social assistance (%)
Most Common Industries - Educational services (%)
Most Common Industries - Health care and social assistance (%)
Most Common Industries - Arts, entertainment, and recreation, and accommodation and food services (%)
Most Common Industries - Arts, entertainment, and recreation (%)
Most Common Industries - Accommodation and food services (%)
Most Common Industries - Other services, except public administration (%)
Most Common Industries - Public administration (%)
Occupation diversity
Most Common Occupations - Management, business, science, and arts occupations (%)
Most Common Occupations - Management, business, and financial occupations (%)
Most Common Occupations - Management occupations (%)
Most Common Occupations - Business and financial operations occupations (%)
Most Common Occupations - Computer, engineering, and science occupations (%)
Most Common Occupations - Computer and mathematical occupations (%)
Most Common Occupations - Architecture and engineering occupations (%)
Most Common Occupations - Life, physical, and social science occupations (%)
Most Common Occupations - Education, legal, community service, arts, and media occupations (%)
Most Common Occupations - Community and social service occupations (%)
Most Common Occupations - Legal occupations (%)
Most Common Occupations - Education, training, and library occupations (%)
Most Common Occupations - Arts, design, entertainment, sports, and media occupations (%)
Most Common Occupations - Healthcare practitioners and technical occupations (%)
Most Common Occupations - Health diagnosing and treating practitioners and other technical occupations (%)
Most Common Occupations - Health technologists and technicians (%)
Most Common Occupations - Service occupations (%)
Most Common Occupations - Healthcare support occupations (%)
Most Common Occupations - Protective service occupations (%)
Most Common Occupations - Fire fighting and prevention, and other protective service workers including supervisors (%)
Most Common Occupations - Law enforcement workers including supervisors (%)
Most Common Occupations - Food preparation and serving related occupations (%)
Most Common Occupations - Building and grounds cleaning and maintenance occupations (%)
Most Common Occupations - Personal care and service occupations (%)
Most Common Occupations - Sales and office occupations (%)
Most Common Occupations - Sales and related occupations (%)
Most Common Occupations - Office and administrative support occupations (%)
Most Common Occupations - Natural resources, construction, and maintenance occupations (%)
Most Common Occupations - Farming, fishing, and forestry occupations (%)
Most Common Occupations - Construction and extraction occupations (%)
Most Common Occupations - Installation, maintenance, and repair occupations (%)
Most Common Occupations - Production, transportation, and material moving occupations (%)
Most Common Occupations - Production occupations (%)
Most Common Occupations - Transportation occupations (%)
Most Common Occupations - Material moving occupations (%)
People in Group quarters - Institutionalized population (%)
People in Group quarters - Correctional institutions (%)
People in Group quarters - Federal prisons and detention centers (%)
People in Group quarters - Halfway houses (%)
People in Group quarters - Local jails and other confinement facilities (including police lockups) (%)
People in Group quarters - Military disciplinary barracks (%)
People in Group quarters - State prisons (%)
People in Group quarters - Other types of correctional institutions (%)
People in Group quarters - Nursing homes (%)
People in Group quarters - Hospitals/wards, hospices, and schools for the handicapped (%)
People in Group quarters - Hospitals/wards and hospices for chronically ill (%)
People in Group quarters - Hospices or homes for chronically ill (%)
People in Group quarters - Military hospitals or wards for chronically ill (%)
People in Group quarters - Other hospitals or wards for chronically ill (%)
People in Group quarters - Hospitals or wards for drug/alcohol abuse (%)
People in Group quarters - Mental (Psychiatric) hospitals or wards (%)
People in Group quarters - Schools, hospitals, or wards for the mentally retarded (%)
People in Group quarters - Schools, hospitals, or wards for the physically handicapped (%)
People in Group quarters - Institutions for the deaf (%)
People in Group quarters - Institutions for the blind (%)
People in Group quarters - Orthopedic wards and institutions for the physically handicapped (%)
People in Group quarters - Wards in general hospitals for patients who have no usual home elsewhere (%)
People in Group quarters - Wards in military hospitals for patients who have no usual home elsewhere (%)
People in Group quarters - Juvenile institutions (%)
People in Group quarters - Long-term care (%)
People in Group quarters - Homes for abused, dependent, and neglected children (%)
People in Group quarters - Residential treatment centers for emotionally disturbed children (%)
People in Group quarters - Training schools for juvenile delinquents (%)
People in Group quarters - Short-term care, detention or diagnostic centers for delinquent children (%)
People in Group quarters - Type of juvenile institution unknown (%)
People in Group quarters - Noninstitutionalized population (%)
People in Group quarters - College dormitories (includes college quarters off campus) (%)
People in Group quarters - Military quarters (%)
People in Group quarters - On base (%)
People in Group quarters - Barracks, unaccompanied personnel housing (UPH), (Enlisted/Officer), ;and similar group living quarters for military personnel (%)
People in Group quarters - Transient quarters for temporary residents (%)
People in Group quarters - Military ships (%)
People in Group quarters - Group homes (%)
People in Group quarters - Homes or halfway houses for drug/alcohol abuse (%)
People in Group quarters - Homes for the mentally ill (%)
People in Group quarters - Homes for the mentally retarded (%)
People in Group quarters - Homes for the physically handicapped (%)
People in Group quarters - Other group homes (%)
People in Group quarters - Religious group quarters (%)
People in Group quarters - Dormitories (%)
People in Group quarters - Agriculture workers' dormitories on farms (%)
People in Group quarters - Job Corps and vocational training facilities (%)
People in Group quarters - Other workers' dormitories (%)
People in Group quarters - Crews of maritime vessels (%)
People in Group quarters - Other nonhousehold living situations (%)
People in Group quarters - Other noninstitutional group quarters (%)
Residents speaking English at home (%)
Residents speaking English at home - Born in the United States (%)
Residents speaking English at home - Native, born elsewhere (%)
Residents speaking English at home - Foreign born (%)
Residents speaking Spanish at home (%)
Residents speaking Spanish at home - Born in the United States (%)
Residents speaking Spanish at home - Native, born elsewhere (%)
Residents speaking Spanish at home - Foreign born (%)
Residents speaking other language at home (%)
Residents speaking other language at home - Born in the United States (%)
Residents speaking other language at home - Native, born elsewhere (%)
Residents speaking other language at home - Foreign born (%)
Class of Workers - Employee of private company (%)
Class of Workers - Self-employed in own incorporated business (%)
Class of Workers - Private not-for-profit wage and salary workers (%)
Class of Workers - Local government workers (%)
Class of Workers - State government workers (%)
Class of Workers - Federal government workers (%)
Class of Workers - Self-employed workers in own not incorporated business and Unpaid family workers (%)
House heating fuel used in houses and condos - Utility gas (%)
House heating fuel used in houses and condos - Bottled, tank, or LP gas (%)
House heating fuel used in houses and condos - Electricity (%)
House heating fuel used in houses and condos - Fuel oil, kerosene, etc. (%)
House heating fuel used in houses and condos - Coal or coke (%)
House heating fuel used in houses and condos - Wood (%)
House heating fuel used in houses and condos - Solar energy (%)
House heating fuel used in houses and condos - Other fuel (%)
House heating fuel used in houses and condos - No fuel used (%)
House heating fuel used in apartments - Utility gas (%)
House heating fuel used in apartments - Bottled, tank, or LP gas (%)
House heating fuel used in apartments - Electricity (%)
House heating fuel used in apartments - Fuel oil, kerosene, etc. (%)
House heating fuel used in apartments - Coal or coke (%)
House heating fuel used in apartments - Wood (%)
House heating fuel used in apartments - Solar energy (%)
House heating fuel used in apartments - Other fuel (%)
House heating fuel used in apartments - No fuel used (%)
Armed forces status - In Armed Forces (%)
Armed forces status - Civilian (%)
Armed forces status - Civilian - Veteran (%)
Armed forces status - Civilian - Nonveteran (%)
Fatal accidents locations in years 2005-2021
Fatal accidents locations in 2005
Fatal accidents locations in 2006
Fatal accidents locations in 2007
Fatal accidents locations in 2008
Fatal accidents locations in 2009
Fatal accidents locations in 2010
Fatal accidents locations in 2011
Fatal accidents locations in 2012
Fatal accidents locations in 2013
Fatal accidents locations in 2014
Fatal accidents locations in 2015
Fatal accidents locations in 2016
Fatal accidents locations in 2017
Fatal accidents locations in 2018
Fatal accidents locations in 2019
Fatal accidents locations in 2020
Fatal accidents locations in 2021
Alcohol use - People drinking some alcohol every month (%)
Alcohol use - People not drinking at all (%)
Alcohol use - Average days/month drinking alcohol
Alcohol use - Average drinks/week
Alcohol use - Average days/year people drink much
Audiometry - Average condition of hearing (%)
Audiometry - People that can hear a whisper from across a quiet room (%)
Audiometry - People that can hear normal voice from across a quiet room (%)
Audiometry - Ears ringing, roaring, buzzing (%)
Audiometry - Had a job exposure to loud noise (%)
Audiometry - Had off-work exposure to loud noise (%)
Blood Pressure & Cholesterol - Has high blood pressure (%)
Blood Pressure & Cholesterol - Checking blood pressure at home (%)
Blood Pressure & Cholesterol - Frequently checking blood cholesterol (%)
Blood Pressure & Cholesterol - Has high cholesterol level (%)
Consumer Behavior - Money monthly spent on food at supermarket/grocery store
Consumer Behavior - Money monthly spent on food at other stores
Consumer Behavior - Money monthly spent on eating out
Consumer Behavior - Money monthly spent on carryout/delivered foods
Consumer Behavior - Income spent on food at supermarket/grocery store (%)
Consumer Behavior - Income spent on food at other stores (%)
Consumer Behavior - Income spent on eating out (%)
Consumer Behavior - Income spent on carryout/delivered foods (%)
Current Health Status - General health condition (%)
Current Health Status - Blood donors (%)
Current Health Status - Has blood ever tested for HIV virus (%)
Current Health Status - Left-handed people (%)
Dermatology - People using sunscreen (%)
Diabetes - Diabetics (%)
Diabetes - Had a blood test for high blood sugar (%)
Diabetes - People taking insulin (%)
Diet Behavior & Nutrition - Diet health (%)
Diet Behavior & Nutrition - Milk product consumption (# of products/month)
Diet Behavior & Nutrition - Meals not home prepared (#/week)
Diet Behavior & Nutrition - Meals from fast food or pizza place (#/week)
Diet Behavior & Nutrition - Ready-to-eat foods (#/month)
Diet Behavior & Nutrition - Frozen meals/pizza (#/month)
Drug Use - People that ever used marijuana or hashish (%)
Drug Use - Ever used hard drugs (%)
Drug Use - Ever used any form of cocaine (%)
Drug Use - Ever used heroin (%)
Drug Use - Ever used methamphetamine (%)
Health Insurance - People covered by health insurance (%)
Kidney Conditions-Urology - Avg. # of times urinating at night
Medical Conditions - People with asthma (%)
Medical Conditions - People with anemia (%)
Medical Conditions - People with psoriasis (%)
Medical Conditions - People with overweight (%)
Medical Conditions - Elderly people having difficulties in thinking or remembering (%)
Medical Conditions - People who ever received blood transfusion (%)
Medical Conditions - People having trouble seeing even with glass/contacts (%)
Medical Conditions - People with arthritis (%)
Medical Conditions - People with gout (%)
Medical Conditions - People with congestive heart failure (%)
Medical Conditions - People with coronary heart disease (%)
Medical Conditions - People with angina pectoris (%)
Medical Conditions - People who ever had heart attack (%)
Medical Conditions - People who ever had stroke (%)
Medical Conditions - People with emphysema (%)
Medical Conditions - People with thyroid problem (%)
Medical Conditions - People with chronic bronchitis (%)
Medical Conditions - People with any liver condition (%)
Medical Conditions - People who ever had cancer or malignancy (%)
Mental Health - People who have little interest in doing things (%)
Mental Health - People feeling down, depressed, or hopeless (%)
Mental Health - People who have trouble sleeping or sleeping too much (%)
Mental Health - People feeling tired or having little energy (%)
Mental Health - People with poor appetite or overeating (%)
Mental Health - People feeling bad about themself (%)
Mental Health - People who have trouble concentrating on things (%)
Mental Health - People moving or speaking slowly or too fast (%)
Mental Health - People having thoughts they would be better off dead (%)
Oral Health - Average years since last visit a dentist
Oral Health - People embarrassed because of mouth (%)
Oral Health - People with gum disease (%)
Oral Health - General health of teeth and gums (%)
Oral Health - Average days a week using dental floss/device
Oral Health - Average days a week using mouthwash for dental problem
Oral Health - Average number of teeth
Pesticide Use - Households using pesticides to control insects (%)
Pesticide Use - Households using pesticides to kill weeds (%)
Physical Activity - People doing vigorous-intensity work activities (%)
Physical Activity - People doing moderate-intensity work activities (%)
Physical Activity - People walking or bicycling (%)
Physical Activity - People doing vigorous-intensity recreational activities (%)
Physical Activity - People doing moderate-intensity recreational activities (%)
Physical Activity - Average hours a day doing sedentary activities
Physical Activity - Average hours a day watching TV or videos
Physical Activity - Average hours a day using computer
Physical Functioning - People having limitations keeping them from working (%)
Physical Functioning - People limited in amount of work they can do (%)
Physical Functioning - People that need special equipment to walk (%)
Physical Functioning - People experiencing confusion/memory problems (%)
Physical Functioning - People requiring special healthcare equipment (%)
Prescription Medications - Average number of prescription medicines taking
Preventive Aspirin Use - Adults 40+ taking low-dose aspirin (%)
Reproductive Health - Vaginal deliveries (%)
Reproductive Health - Cesarean deliveries (%)
Reproductive Health - Deliveries resulted in a live birth (%)
Reproductive Health - Pregnancies resulted in a delivery (%)
Reproductive Health - Women breastfeeding newborns (%)
Reproductive Health - Women that had a hysterectomy (%)
Reproductive Health - Women that had both ovaries removed (%)
Reproductive Health - Women that have ever taken birth control pills (%)
Reproductive Health - Women taking birth control pills (%)
Reproductive Health - Women that have ever used Depo-Provera or injectables (%)
Reproductive Health - Women that have ever used female hormones (%)
Sexual Behavior - People 18+ that ever had sex (vaginal, anal, or oral) (%)
Sexual Behavior - Males 18+ that ever had vaginal sex with a woman (%)
Sexual Behavior - Males 18+ that ever performed oral sex on a woman (%)
Sexual Behavior - Males 18+ that ever had anal sex with a woman (%)
Sexual Behavior - Males 18+ that ever had any sex with a man (%)
Sexual Behavior - Females 18+ that ever had vaginal sex with a man (%)
Sexual Behavior - Females 18+ that ever performed oral sex on a man (%)
Sexual Behavior - Females 18+ that ever had anal sex with a man (%)
Sexual Behavior - Females 18+ that ever had any kind of sex with a woman (%)
Sexual Behavior - Average age people first had sex
Sexual Behavior - Average number of female sex partners in lifetime (males 18+)
Sexual Behavior - Average number of female vaginal sex partners in lifetime (males 18+)
Sexual Behavior - Average age people first performed oral sex on a woman (18+)
Sexual Behavior - Average number of woman performed oral sex on in lifetime (18+)
Sexual Behavior - Average number of male sex partners in lifetime (males 18+)
Sexual Behavior - Average number of male anal sex partners in lifetime (males 18+)
Sexual Behavior - Average age people first performed oral sex on a man (18+)
Sexual Behavior - Average number of male oral sex partners in lifetime (18+)
Sexual Behavior - People using protection when performing oral sex (%)
Sexual Behavior - Average number of times people have vaginal or anal sex a year
Sexual Behavior - People having sex without condom (%)
Sexual Behavior - Average number of male sex partners in lifetime (females 18+)
Sexual Behavior - Average number of male vaginal sex partners in lifetime (females 18+)
Sexual Behavior - Average number of female sex partners in lifetime (females 18+)
Sexual Behavior - Circumcised males 18+ (%)
Sleep Disorders - Average hours sleeping at night
Sleep Disorders - People that has trouble sleeping (%)
Smoking-Cigarette Use - People smoking cigarettes (%)
Taste & Smell - People 40+ having problems with smell (%)
Taste & Smell - People 40+ having problems with taste (%)
Taste & Smell - People 40+ that ever had wisdom teeth removed (%)
Taste & Smell - People 40+ that ever had tonsils teeth removed (%)
Taste & Smell - People 40+ that ever had a loss of consciousness because of a head injury (%)
Taste & Smell - People 40+ that ever had a broken nose or other serious injury to face or skull (%)
Taste & Smell - People 40+ that ever had two or more sinus infections (%)
Weight - Average height (inches)
Weight - Average weight (pounds)
Weight - Average BMI
Weight - People that are obese (%)
Weight - People that ever were obese (%)
Weight - People trying to lose weight (%)
Urban population: 6,036
Rural population: 7,644
Estimated median house/condo value in 2022: $255,979
49090:
$255,979Michigan:
$224,400
According to our research of Michigan and other state lists, there were 50 registered sex offenders living in 49090 zip code as of April 27, 2024 . The ratio of all residents to sex offenders in zip code 49090 is 282 to 1.The ratio of registered sex offenders to all residents in this zip code is near the state average.
Median resident age: This zip code:
49.8 yearsMichigan median age:
40.3 years
Average household size: This zip code:
2.3 peopleMichigan:
2.4 people
Averages for the 2020 tax year for zip code 49090, filed in 2021:
Average Adjusted Gross Income (AGI) in 2020: $68,699 (Individual Income Tax Returns) Here:
$68,699State:
$68,945
Salary/wage: $52,277 (reported on 74.7% of returns )Here:
$52,277State:
$57,142
(% of AGI for various income ranges: 1047.1% for AGIs below $25k , 3319.8% for AGIs $25k-50k , 5748.9% for AGIs $50k-75k , 8439.1% for AGIs $75k-100k , 14636.1% for AGIs $100k-200k , 72780.0% for AGIs over 200k ) Taxable interest for individuals: $1,592 (reported on 32.8% of returns )This zip code:
$1,592Michigan:
$1,630
(% of AGI for various income ranges: 14.9% for AGIs below $25k , 25.3% for AGIs $25k-50k , 56.4% for AGIs $50k-75k , 87.6% for AGIs $75k-100k , 208.0% for AGIs $100k-200k , 1338.0% for AGIs over 200k ) Ordinary dividends: $8,477 (reported on 23.1% of returns )(% of AGI for various income ranges: 39.9% for AGIs below $25k , 67.8% for AGIs $25k-50k , 161.8% for AGIs $50k-75k , 305.0% for AGIs $75k-100k , 679.8% for AGIs $100k-200k , 6419.0% for AGIs over 200k ) Net capital gain/loss in AGI: +$23,598 (reported on 20.8% of returns )Here:
+$23,598State:
+$20,064
(% of AGI for various income ranges: 21.8% for AGIs below $25k , 44.0% for AGIs $25k-50k , 250.7% for AGIs $50k-75k , 398.5% for AGIs $75k-100k , 1064.1% for AGIs $100k-200k , 23792.0% for AGIs over 200k ) Profit/loss from business: +$19,468 (reported on 14.5% of returns )Here:
+$19,468State:
+$11,172
(% of AGI for various income ranges: 78.1% for AGIs below $25k , 174.2% for AGIs $25k-50k , 197.5% for AGIs $50k-75k , 332.4% for AGIs $75k-100k , 800.0% for AGIs $100k-200k , 9380.0% for AGIs over 200k ) Taxable individual retirement arrangement distribution: $25,977 (reported on 13.8% of returns )49090:
$25,977Michigan:
$19,803
(% of AGI for various income ranges: 76.8% for AGIs below $25k , 130.1% for AGIs $25k-50k , 437.8% for AGIs $50k-75k , 694.4% for AGIs $75k-100k , 1928.9% for AGIs $100k-200k , 7314.0% for AGIs over 200k ) Self-employed (Keogh) retirement plans: $34,233 (reported on 0.5% of returns )49090:
$34,233Michigan:
$25,132
(% of AGI for various income ranges: 1027.0% for AGIs over 200k ) Total itemized deductions: $38,179 (reported on 6.6% of returns )Here:
$38,179State:
$34,117
(% of AGI for various income ranges: 41.8% for AGIs below $25k , 78.8% for AGIs $25k-50k , 228.0% for AGIs $50k-75k , 347.9% for AGIs $75k-100k , 996.8% for AGIs $100k-200k , 7966.0% for AGIs over 200k ) Charity contributions: $12,811 (reported on 5.7% of returns )Here:
$12,811State:
$13,548
(% of AGI for various income ranges: 16.6% for AGIs $25k-50k , 46.2% for AGIs $50k-75k , 72.1% for AGIs $75k-100k , 319.8% for AGIs $100k-200k , 2627.0% for AGIs over 200k ) Taxes paid: $8,181 (reported on 6.6% of returns )(% of AGI for various income ranges: 8.2% for AGIs below $25k , 11.3% for AGIs $25k-50k , 63.8% for AGIs $50k-75k , 98.5% for AGIs $75k-100k , 268.9% for AGIs $100k-200k , 1381.0% for AGIs over 200k ) Earned income credit: $2,216 (reported on 15.3% of returns )(% of AGI for various income ranges: 83.6% for AGIs below $25k , 74.3% for AGIs $25k-50k ) Percentage of individuals using paid preparers for their 2020 taxes: 93.4%(% for various income ranges: 92.6% for AGIs below $25k , 93.4% for AGIs $25k-50k , 92.7% for AGIs $50k-75k , 94.5% for AGIs $75k-100k , 95.2% for AGIs $100k-200k , 94.4% for AGIs over 200k )
Averages for the 2012 tax year for zip code 49090, filed in 2013:
Average Adjusted Gross Income (AGI) in 2012: $53,770 (Individual Income Tax Returns) Here:
$53,770State:
$55,609
Salary/wage: $41,222 (reported on 78.6% of returns )Here:
$41,222State:
$46,782
(% of AGI for various income ranges: 69.1% for AGIs below $25k , 72.1% for AGIs $25k-50k , 71.5% for AGIs $50k-75k , 66.0% for AGIs $75k-100k , 67.6% for AGIs $100k-200k , 37.7% for AGIs over 200k ) Taxable interest for individuals: $1,469 (reported on 34.3% of returns )This zip code:
$1,469Michigan:
$1,491
(% of AGI for various income ranges: 1.3% for AGIs below $25k , 1.0% for AGIs $25k-50k , 0.8% for AGIs $50k-75k , 0.6% for AGIs $75k-100k , 0.9% for AGIs $100k-200k , 1.0% for AGIs over 200k ) Ordinary dividends: $5,886 (reported on 22.7% of returns )(% of AGI for various income ranges: 2.3% for AGIs below $25k , 1.7% for AGIs $25k-50k , 2.0% for AGIs $50k-75k , 2.0% for AGIs $75k-100k , 2.3% for AGIs $100k-200k , 3.5% for AGIs over 200k ) Net capital gain/loss in AGI: +$10,962 (reported on 17.9% of returns )Here:
+$10,962State:
+$9,326
(% of AGI for various income ranges: 0.3% for AGIs $25k-50k , 1.0% for AGIs $50k-75k , 1.5% for AGIs $75k-100k , 2.2% for AGIs $100k-200k , 10.0% for AGIs over 200k ) Profit/loss from business: +$11,184 (reported on 15.8% of returns )Here:
+$11,184State:
+$11,523
(% of AGI for various income ranges: 6.7% for AGIs below $25k , 3.9% for AGIs $25k-50k , 2.0% for AGIs $50k-75k , 2.7% for AGIs $75k-100k , 3.0% for AGIs $100k-200k , 2.9% for AGIs over 200k ) Taxable individual retirement arrangement distribution: $20,587 (reported on 13.5% of returns )49090:
$20,587Michigan:
$15,298
(% of AGI for various income ranges: 4.0% for AGIs below $25k , 4.0% for AGIs $25k-50k , 3.8% for AGIs $50k-75k , 5.1% for AGIs $75k-100k , 5.6% for AGIs $100k-200k , 6.5% for AGIs over 200k ) Self-employment retirement plans: $18,667 (reported on 0.5% of returns )49090:
$18,667Michigan:
$20,834
Total itemized deductions: $22,692 (19% of AGI, reported on 27.8% of returns )Here:
$22,692State:
$21,628
Here:
18.9% of AGIState:
18.4% of AGI
(% of AGI for various income ranges: 9.5% for AGIs below $25k , 9.9% for AGIs $25k-50k , 12.1% for AGIs $50k-75k , 12.0% for AGIs $75k-100k , 13.9% for AGIs $100k-200k , 11.4% for AGIs over 200k ) Charity contributions: $5,059 (reported on 22.5% of returns )(% of AGI for various income ranges: 1.0% for AGIs below $25k , 1.2% for AGIs $25k-50k , 1.6% for AGIs $50k-75k , 1.8% for AGIs $75k-100k , 2.2% for AGIs $100k-200k , 3.3% for AGIs over 200k ) Taxes paid: $8,885 (reported on 27.5% of returns )(% of AGI for various income ranges: 2.2% for AGIs below $25k , 2.8% for AGIs $25k-50k , 3.9% for AGIs $50k-75k , 4.2% for AGIs $75k-100k , 5.7% for AGIs $100k-200k , 5.7% for AGIs over 200k ) Earned income credit: $2,287 (reported on 19.6% of returns )(% of AGI for various income ranges: 6.9% for AGIs below $25k , 1.1% for AGIs $25k-50k ) Percentage of individuals using paid preparers for their 2012 taxes: 56.7%(% for various income ranges: 51.9% for AGIs below $25k , 57.1% for AGIs $25k-50k , 62.8% for AGIs $50k-75k , 59.2% for AGIs $75k-100k , 62.1% for AGIs $100k-200k , 83.3% for AGIs over 200k )
Averages for the 2004 tax year for zip code 49090, filed in 2005:
Average Adjusted Gross Income (AGI) in 2004: $40,401 (Individual Income Tax Returns) Here:
$40,401State:
$48,204
Salary/wage: $34,977 (reported on 82.5% of returns )Here:
$34,977State:
$42,791
(% of AGI for various income ranges: 107.4% for AGIs below $10k , 71.9% for AGIs $10k-25k , 78.5% for AGIs $25k-50k , 77.4% for AGIs $50k-75k , 78.4% for AGIs $75k-100k , 57.3% for AGIs over 100k ) Taxable interest for individuals: $1,636 (reported on 46.0% of returns )This zip code:
$1,636Michigan:
$1,725
(% of AGI for various income ranges: 6.4% for AGIs below $10k , 2.7% for AGIs $10k-25k , 1.4% for AGIs $25k-50k , 1.4% for AGIs $50k-75k , 1.5% for AGIs $75k-100k , 2.0% for AGIs over 100k ) Taxable dividends: $2,944 (reported on 25.1% of returns )(% of AGI for various income ranges: 4.7% for AGIs below $10k , 2.1% for AGIs $10k-25k , 1.5% for AGIs $25k-50k , 1.3% for AGIs $50k-75k , 1.4% for AGIs $75k-100k , 2.3% for AGIs over 100k ) Net capital gain/loss: +$9,519 (reported on 21.5% of returns )Here:
+$9,519State:
+$8,532
(% of AGI for various income ranges: -0.3% for AGIs below $10k , 0.7% for AGIs $10k-25k , 0.9% for AGIs $25k-50k , 1.2% for AGIs $50k-75k , 2.9% for AGIs $75k-100k , 12.9% for AGIs over 100k ) Profit/loss from business: +$9,029 (reported on 15.2% of returns )Here:
+$9,029State:
+$9,547
(% of AGI for various income ranges: 3.5% for AGIs below $10k , 3.9% for AGIs $10k-25k , 2.6% for AGIs $25k-50k , 1.7% for AGIs $50k-75k , 2.4% for AGIs $75k-100k , 5.3% for AGIs over 100k ) IRA payment deduction: $3,109 (reported on 2.5% of returns )49090:
$3,109Michigan:
$2,875
(% of AGI for various income ranges: 0.4% for AGIs $10k-25k , 0.3% for AGIs $25k-50k , 0.2% for AGIs $50k-75k , 0.2% for AGIs $75k-100k , 0.1% for AGIs over 100k ) Self-employed pension: $11,163 (reported on 0.7% of returns )Here:
$11,163Michigan:
$13,826
Total itemized deductions: $17,578 (23% of AGI, reported on 30.9% of returns )Here:
$17,578State:
$18,509
Here:
22.8% of AGIState:
20.7% of AGI
(% of AGI for various income ranges: 18.5% for AGIs below $10k , 12.1% for AGIs $10k-25k , 11.6% for AGIs $25k-50k , 14.5% for AGIs $50k-75k , 15.1% for AGIs $75k-100k , 13.4% for AGIs over 100k ) Charity contributions deductions: $3,469 (4% of AGI, reported on 26.1% of returns )Here:
4.2% of AGIState:
3.6% of AGI
(% of AGI for various income ranges: 0.8% for AGIs below $10k , 1.4% for AGIs $10k-25k , 1.4% for AGIs $25k-50k , 2.0% for AGIs $50k-75k , 2.4% for AGIs $75k-100k , 3.2% for AGIs over 100k ) Total tax: $6,284 (reported on 69.2% of returns )(% of AGI for various income ranges: 2.7% for AGIs below $10k , 3.7% for AGIs $10k-25k , 6.6% for AGIs $25k-50k , 8.5% for AGIs $50k-75k , 10.5% for AGIs $75k-100k , 17.8% for AGIs over 100k ) Earned income credit: $1,736 (reported on 16.9% of returns )Percentage of individuals using paid preparers for their 2004 taxes: 59.4%(% for various income ranges: 54.2% for AGIs below $10k , 61.0% for AGIs $10k-25k , 60.9% for AGIs $25k-50k , 61.3% for AGIs $50k-75k , 54.7% for AGIs $75k-100k , 68.7% for AGIs over 100k )
Estimated median household income in 2022: This zip code:
$61,623Michigan:
$66,986
Nearest zip codes: 49043 ,
49013 ,
49450 ,
49027 ,
49056 ,
49408 .
Percentage of family households: This zip code:
35.9%Michigan:
43.3%
Percentage of households with unmarried partners: This zip code:
4.8%Michigan:
45.7%
Likely homosexual households (counted as self-reported same-sex unmarried-partner households)
Lesbian couples: 0.1% of all households Gay men: 0.2% of all households
Household received Food Stamps/SNAP in the past 12 months: 800Household did not receive Food Stamps/SNAP in the past 12 months: 5,010
Women who had a birth in the past 12 months: 209 (135 now married , 73 unmarried) Women who did not have a birth in the past 12 months: 2,111 (949 now married , 1,159 unmarried)
Housing units in zip code 49090 with a mortgage: 2,456 (283
second mortgage , 10
home equity loan , 232
both second mortgage and home equity loan )
Houses without a mortgage: 146
Median monthly owner costs for units with a mortgage: $1,554
Median monthly owner costs for units without a mortgage: $637
Residents with income below the poverty level in 2022:
This zip code:
17.2%Whole state:
13.4%
Residents with income below 50% of the poverty level in 2022:
This zip code:
8.8%Whole state:
6.9%
Median number of rooms in houses and condos: Median number of rooms in apartments: Notable locations in this zip code not listed on our city pages
Click to draw/clear zip code borders Notable locations in zip code 49090: (A) , South Haven Municipal Marina (B) , Pothole Marina (C) , Jensens Fishery (D) , North Beach Public Park (E) , River Bend Boat Club (F) , South Haven Marine (G) , North Pierh Light (H) , South Pierh Light (I) , Michigan State College South Haven Experiment Station (J) , South Haven Country Club (K) , Camp Na Wa Kwa (L) , Roosevelt Hills (M) , Van Buren State Park (N) , Variety Park (O) , Hawkshead Links (P) , Kibbie Corners (Q) , Glenn Shores Golf Club (R) , Glenn Rest Area (S) , Jensen's Campground and Motel (T) . Display/hide their locations on the map
Churches in zip code 49090 include: (A) , Macedonia Church (B) , Packard Gospel Center (C) , Church of God (D) , Trinity Church (E) , Lacota Church (F) , Blue Star Church (G) , Bethel Church (H) , Open Door Church (I) . Display/hide their locations on the map
Cemeteries: (1) , McDowell Cemetery (2) , Hebrew Cemetery (3) , Lake View Cemetery (4) , Stephenson Cemetery (5) . Display/hide their locations on the map
Lakes and swamps: (A) , Picture Lake (B) , Moon Lake (C) , Dyckman Swamp (D) . Display/hide their locations on the map
Streams, rivers, and creeks: (A) , Glenn Creek (B) , Black River (C) , Spicebush Creek (D) , Butternut Creek (E) , Scott Creek Drain (F) , Cedar Creek (G) , Deerlick Creek (H) , Tripp and Extension Drain (I) . Display/hide their locations on the map
Parks in zip code 49090 include: (1) , Elkenburg Park (2) , Kids Corner Playground (3) , River Front Park (4) , Ellen Avery Park (5) , Hartman Park (6) , Tot Lot Park (7) , Stanley Johnson Park (8) , Packard Park (9) . Display/hide their locations on the map
Beaches: (A) , South Beach (B) , Woodman Beach (C) , Dyckman Beach (D) . Display/hide their locations on the map
Year house built (houses)
0 2020 or later533 2010 to 20191,089 2000 to 20091,049 1990 to 1999975 1980 to 19891,082 1970 to 1979692 1960 to 19691,095 1950 to 1959633 1940 to 19491,523 1939 or earlier
Zip code 49090 household income distribution in 2022 428 Less than $10,000320 $10,000 to $14,999167 $15,000 to $19,999310 $20,000 to $24,999211 $25,000 to $29,999321 $30,000 to $34,999158 $35,000 to $39,999192 $40,000 to $44,999177 $45,000 to $49,999554 $50,000 to $59,999478 $60,000 to $74,999703 $75,000 to $99,999600 $100,000 to $124,999327 $125,000 to $149,999399 $150,000 to $199,999469 $200,000 or moreEstimate of home value of owner-occupied houses/condos in 2022 in zip code 49090 67 Less than $10,00066 $10,000 to $14,99964 $15,000 to $19,99949 $20,000 to $24,99942 $30,000 to $34,99939 $35,000 to $39,99954 $40,000 to $49,99968 $50,000 to $59,99920 $60,000 to $69,999117 $80,000 to $89,99934 $90,000 to $99,999165 $100,000 to $124,999290 $125,000 to $149,999286 $150,000 to $174,999290 $175,000 to $199,999530 $200,000 to $249,999286 $250,000 to $299,999672 $300,000 to $399,999470 $400,000 to $499,999553 $500,000 to $749,999133 $750,000 to $999,999208 $1,000,000 to $1,499,99930 $1,500,000 to $1,999,99931 $2,000,000 or moreRent paid by renters in 2022 in zip code 49090 6 Less than $10035 $100 to $14927 $150 to $19963 $200 to $24928 $250 to $29922 $300 to $34951 $350 to $39928 $400 to $44918 $450 to $49984 $500 to $54977 $550 to $599142 $600 to $649110 $650 to $69942 $700 to $74943 $750 to $79982 $800 to $89972 $900 to $999122 $1,000 to $1,249167 $1,250 to $1,49934 $2,000 to $2,49968 No cash rent
Median gross rent in 2022: $896.
Median price asked for vacant for-sale houses and condos in 2022: $699,586.
Estimated median house (or condo) value in 2022 for: White Non-Hispanic householders: $301,088Black or African American householders: $200,192Asian householders: $1,086,642Some other race householders: $130,792Two or more races householders: $373,158Hispanic or Latino householders: $200,192Estimated median house or condo value in 2022: $255,979
49090:
$255,979Michigan:
$224,400
Lower value quartile - upper value quartile: $153,472 - $463,746
Mean price in 2022: Detached houses: $372,833Here:
$372,833State:
$280,038
Townhouses or other attached units: $329,809Here:
$329,809State:
$239,520
In 2-unit structures: $376,277Here:
$376,277State:
$219,481
In 3-to-4-unit structures: $542,797Here:
$542,797State:
$207,067
In 5-or-more-unit structures: $398,521Here:
$398,521State:
$192,733
Mobile homes: $255,622Here:
$255,622State:
$72,868
Housing units in structures:
One, detached: 6,256One, attached: 248Two: 893 or 4: 2505 to 9: 19710 to 19: 21920 to 49: 36750 or more: 152Mobile homes: 902Unemployment : 2.7%
Means of transportation to work in zip code 49090 70.2% 4,329 Drove a car alone9.9% 609 Carpooled0.2% 15 Bus or trolley bus0.1% 5 Streetcar or trolley car0.3% 17 Taxi1.8% 109 Walked0.2% 11 Other means18.8% 1,157 Worked at homeTravel time to work (commute) in zip code 49090 275 Less than 5 minutes712 5 to 9 minutes1,230 10 to 14 minutes847 15 to 19 minutes306 20 to 24 minutes228 25 to 29 minutes488 30 to 34 minutes68 35 to 39 minutes195 40 to 44 minutes408 45 to 59 minutes296 60 to 89 minutes43 90 or more minutes
Percentage of zip code residents living and working in this county: 66.6%
Household type by relationship:
Households: 13,681
Male householders: 2,755 (704 living alone ), Female householders: 3,059 (962 living alone )3,104 spouses (2,975 opposite-sex spouses ), 479 unmarried partners , (463 opposite-sex unmarried partners ), 3,025 children (2,854 natural , 79 adopted , 91 stepchildren ), 498 grandchildren , 58 brothers or sisters , 87 parents , 28 foster children , 245 other relatives , 216 non-relatives In group quarters: 189 (-1 institutionalized population )
Size of family households: 2,099 2-persons , 567 3-persons , 536 4-persons , 322 5-persons , 73 6-persons , 130 7-or-more-persons
Size of nonfamily households: 1,666 1-person , 427 2-persons
1,449 married couples with children. single-parent households (45 men , 590 women ).
87.5% of residents of 49090 zip code speak English at home. of residents speak Spanish at home (59% very well, 17% well, 7% not well, 17% not at all ).of residents speak other Indo-European language at home (75% very well, 17% well, 8% not well ).of residents speak Asian or Pacific Island language at home (71% very well, 29% well ).
Foreign born population: 1,200 (8.8%)
(33.0%
of them are naturalized citizens )
This zip code:
8.8%Whole state:
6.9%
55% Honduras 17% Guatemala 7% France 6% Bhutan 6% Malaysia 6% Senegal 2% North Macedonia (Macedonia) 14% German 9% Irish 8% American 8% English 7% European 6% Polish 5% Dutch
Year of entry for the foreign-born population
311 2010 or later 353 2000 to 2009 229 1990 to 1999 345 Before 1990
Major facilities with environmental interests located in this zip code:
BASELINE MIDDLE SCHOOL (7357 BASELINE ROAD in SOUTH HAVEN, MI)
(National Center for Education Statistics) - STATE ID-07769 Organizations: SOUTH HAVEN PUBLIC SCHOOLS (SCHOOL DISTRICT)
MI DEPT/ENVIRONMENTAL QUALITY (125 ELKENBURG ST in SOUTH HAVEN, MI)
HAZARDOUS WASTE BIENNIAL REPORTER (Resource Conservation and Recovery Act (tracking hazardous waste)) Large Quantity Generators, more that 1000 kg of hazardous waste/month (Resource Conservation and Recovery Act (tracking hazardous waste)) Organizations: MARC BERTORELLI/BERTORELLI BUILDER LLC (CONTACT/OPERATOR)
Alternative names: ABONDONED PROPERTY
AIR BOSS, INC (1425 KALAMAZOO ST in SOUTH HAVEN, MI)
AIR MINOR (AIRS/AFS) Business SIC classification: FABRICATED RUBBER PRODUCTSAlternative names: CONTROLLED RUBBER PROD INCORPORATED
MI DEPT/TRANSPORTATION BRIDGE (M-43 OVER I-196 in SOUTH HAVEN, MI)
(Resource Conservation and Recovery Act (tracking hazardous waste)) Organizations: MICH DEPT OF TRANSPORTATION (CONTACT/OPERATOR)
Alternative names: MIDOT BRIDGE M-43 OVER I-196
AM SIGN (202 ELKENBURG ST in SOUTH HAVEN, MI)
(Resource Conservation and Recovery Act (tracking hazardous waste)) Organizations: PETERSON LAND CO (CONTACT/OWNER)
MI DEPT/MILITARY & VETERANS AFFAIRS (500 ALYWORTH (AT CENTER ST) in SOUTH HAVEN, MI)
(Resource Conservation and Recovery Act (tracking hazardous waste)) Alternative names: SOUTH HAVEN ARMORY
BETTEN FAMILY CHEVROLET OLDS (10420 M140 HWY in SOUTH HAVEN, MI)
(Resource Conservation and Recovery Act (tracking hazardous waste)) Organizations: BETTEN FAMILY CHEV OLDS (CONTACT/OPERATOR)
Housing units lacking complete plumbing facilities: 1.2%
Housing units lacking complete kitchen facilities: 1.4%
68.8% Utility gas 10.8% Bottled, tank, or LP gas 9.7% Electricity 4.1% Fuel oil, kerosene, etc. 3.0% Wood 2.5% Other fuel 1.2% No fuel used
Population in 1990: 12,604. Population change in the 1990s: +2,427 (+19.3%).
Place of birth for U.S.-born residents:
This state: 9,155Northeast: 229Midwest: 1,851South: 850West: 343
59% of the 49090 zip code residents lived in the same house 5 years ago.
Out of people who lived in different houses, 54% lived in this county.
Out of people who lived in different counties, 50% lived in Michigan.
88% of the 49090 zip code residents lived in the same house 1 year ago.
Out of people who lived in different houses, 26% moved from this county.
Out of people who lived in different houses, 34% moved from different county within same state.
Out of people who lived in different houses, 42% moved from different state.
Out of people who lived in different houses, 2% moved from abroad.
Private vs. public school enrollment:
Students in private schools in grades 1 to 8 (elementary and middle school): 191
Students in private schools in grades 9 to 12 (high school): 18
Students in private undergraduate colleges: 70
Occupation by median earnings in the past 12 months ($)
140,466 Life, physical, and social science occupations 126,632 Legal occupations 100,849 Computer and mathematical occupations 97,522 Fire fighting and prevention, and other protective service workers including supervisors 80,852 Architecture and engineering occupations 77,309 Business and financial operations occupations
Top industries in this zip code by the number of employees in 2005:
Health Care and Social Assistance: General Medical and Surgical Hospitals (250-499 employees: 1 establishment)Accommodation and Food Services: Limited-Service Restaurants (50-99: 2, 20-49: 3, 10-19: 5, 5-9: 4, 1-4: 1)Accommodation and Food Services: Full-Service Restaurants (50-99: 1, 20-49: 4, 10-19: 6, 5-9: 2, 1-4: 3)Health Care and Social Assistance: Nursing Care Facilities (100-249: 1, 50-99: 1)Management of Companies and Enterprises: Corporate, Subsidiary, and Regional Managing Offices (100-249: 1, 10-19: 1, 1-4: 1)Professional, Scientific, and Technical Services: Payroll Services (100-249: 1, 1-4: 1)Construction: New Single-Family Housing Construction (except Operative Builders) (20-49: 2, 10-19: 1, 5-9: 2, 1-4: 9)
People in group quarters in 2010:
155 people in nursing facilities/skilled-nursing facilities
15 people in workers' group living quarters and job corps centers
People in group quarters in 2000:
236 people in agriculture workers' dormitories on farms
208 people in nursing homes
15 people in unknown juvenile institutions
14 people in other nonhousehold living situations
6 people in other noninstitutional group quarters
Fatal accident statistics in 2014:
Fatal accident count: 1Vehicles involved in fatal accidents: 2Fatal accidents caused by drunken drivers: 2Fatalities: 1Persons involved in fatal accidents: 3Pedestrians involved in fatal accidents: 0
Fatal accident statistics in 2013:
Fatal accident count: 5Vehicles involved in fatal accidents: 9Fatal accidents caused by drunken drivers: 0Fatalities: 5Persons involved in fatal accidents: 13Pedestrians involved in fatal accidents: 1
Home Mortgage Disclosure Act Aggregated Statistics For Year 2009(Based on 3 full and 4 partial tracts) A) FHA, FSA/RHS & VA B) Conventional C) Refinancings D) Home Improvement Loans F) Non-occupant Loans on G) Loans On Manufactured Number Average Value Number Average Value Number Average Value Number Average Value Number Average Value Number Average Value
LOANS ORIGINATED 26 $109,817 73 $176,158 339 $174,273 25 $89,600 161 $208,498 9 $92,372 APPLICATIONS APPROVED, NOT ACCEPTED 1 $63,000 7 $167,173 23 $149,049 4 $18,500 7 $169,887 1 $24,240 APPLICATIONS DENIED 5 $160,768 9 $249,626 119 $202,987 17 $40,070 44 $218,582 8 $72,111 APPLICATIONS WITHDRAWN 6 $124,177 9 $162,957 44 $171,288 4 $44,475 11 $226,855 2 $72,670 FILES CLOSED FOR INCOMPLETENESS 0 $0 1 $550,000 11 $129,983 2 $37,500 4 $233,060 1 $85,310
Aggregated Statistics For Year 2008(Based on 3 full and 4 partial tracts) A) FHA, FSA/RHS & VA B) Conventional C) Refinancings D) Home Improvement Loans F) Non-occupant Loans on G) Loans On Manufactured Number Average Value Number Average Value Number Average Value Number Average Value Number Average Value Number Average Value
LOANS ORIGINATED 22 $90,351 85 $203,444 198 $181,664 56 $56,657 87 $225,674 19 $79,898 APPLICATIONS APPROVED, NOT ACCEPTED 2 $81,120 8 $177,531 28 $177,305 7 $39,776 12 $257,674 4 $63,422 APPLICATIONS DENIED 11 $134,616 30 $165,685 131 $165,758 35 $69,552 37 $195,467 11 $67,355 APPLICATIONS WITHDRAWN 2 $54,950 10 $246,153 47 $138,601 6 $137,652 11 $190,223 4 $64,332 FILES CLOSED FOR INCOMPLETENESS 0 $0 4 $102,902 7 $181,703 0 $0 4 $83,152 0 $0
Aggregated Statistics For Year 2007(Based on 3 full and 4 partial tracts) A) FHA, FSA/RHS & VA B) Conventional C) Refinancings D) Home Improvement Loans E) Loans on Dwellings For 5+ Families F) Non-occupant Loans on G) Loans On Manufactured Number Average Value Number Average Value Number Average Value Number Average Value Number Average Value Number Average Value Number Average Value
LOANS ORIGINATED 12 $94,637 155 $207,275 223 $155,895 79 $53,318 1 $204,100 136 $222,621 23 $81,105 APPLICATIONS APPROVED, NOT ACCEPTED 0 $0 22 $214,324 56 $155,213 9 $53,672 0 $0 17 $264,681 5 $54,872 APPLICATIONS DENIED 6 $79,970 58 $151,377 173 $160,625 48 $68,502 1 $300,000 42 $184,411 24 $80,607 APPLICATIONS WITHDRAWN 1 $35,080 9 $174,030 64 $172,172 4 $193,870 0 $0 13 $166,471 1 $128,630 FILES CLOSED FOR INCOMPLETENESS 0 $0 5 $146,322 22 $158,216 2 $73,445 0 $0 6 $217,942 2 $44,500
Aggregated Statistics For Year 2006(Based on 3 full and 4 partial tracts) A) FHA, FSA/RHS & VA B) Conventional C) Refinancings D) Home Improvement Loans E) Loans on Dwellings For 5+ Families F) Non-occupant Loans on G) Loans On Manufactured Number Average Value Number Average Value Number Average Value Number Average Value Number Average Value Number Average Value Number Average Value
LOANS ORIGINATED 25 $112,181 185 $172,396 276 $144,428 79 $49,459 0 $0 145 $203,477 27 $75,399 APPLICATIONS APPROVED, NOT ACCEPTED 1 $44,010 20 $115,498 57 $167,516 5 $23,640 0 $0 12 $358,377 6 $100,023 APPLICATIONS DENIED 2 $108,250 52 $181,512 197 $127,773 50 $61,542 1 $28,700 34 $272,301 35 $65,382 APPLICATIONS WITHDRAWN 3 $107,227 18 $111,398 113 $127,748 10 $121,265 0 $0 14 $244,605 8 $94,571 FILES CLOSED FOR INCOMPLETENESS 3 $65,627 6 $299,662 35 $142,050 2 $43,230 0 $0 3 $460,993 0 $0
Aggregated Statistics For Year 2005(Based on 3 full and 4 partial tracts) A) FHA, FSA/RHS & VA B) Conventional C) Refinancings D) Home Improvement Loans E) Loans on Dwellings For 5+ Families F) Non-occupant Loans on G) Loans On Manufactured Number Average Value Number Average Value Number Average Value Number Average Value Number Average Value Number Average Value Number Average Value
LOANS ORIGINATED 18 $99,296 237 $168,004 343 $158,344 68 $74,028 2 $209,500 182 $222,790 34 $78,359 APPLICATIONS APPROVED, NOT ACCEPTED 0 $0 34 $133,598 66 $146,074 8 $63,788 0 $0 22 $200,065 3 $58,940 APPLICATIONS DENIED 3 $81,997 59 $91,484 229 $131,892 39 $76,307 0 $0 38 $148,241 36 $60,492 APPLICATIONS WITHDRAWN 2 $149,735 31 $117,795 153 $135,924 24 $115,415 0 $0 13 $191,144 10 $95,066 FILES CLOSED FOR INCOMPLETENESS 1 $169,020 6 $103,315 35 $120,826 2 $16,380 0 $0 3 $210,650 1 $169,910
Aggregated Statistics For Year 2004(Based on 3 full and 4 partial tracts) A) FHA, FSA/RHS & VA B) Conventional C) Refinancings D) Home Improvement Loans E) Loans on Dwellings For 5+ Families F) Non-occupant Loans on G) Loans On Manufactured Number Average Value Number Average Value Number Average Value Number Average Value Number Average Value Number Average Value Number Average Value
LOANS ORIGINATED 8 $83,711 203 $168,871 403 $136,719 82 $42,961 3 $153,667 181 $200,236 24 $73,052 APPLICATIONS APPROVED, NOT ACCEPTED 2 $79,110 26 $181,520 77 $117,782 3 $45,503 0 $0 15 $203,272 7 $72,674 APPLICATIONS DENIED 5 $105,080 49 $93,265 263 $109,710 47 $46,410 1 $300,000 32 $159,263 45 $67,949 APPLICATIONS WITHDRAWN 1 $113,690 16 $117,715 140 $142,745 7 $37,857 0 $0 13 $161,752 8 $99,335 FILES CLOSED FOR INCOMPLETENESS 0 $0 5 $111,256 44 $162,665 2 $118,975 0 $0 5 $138,924 2 $62,585
Aggregated Statistics For Year 2003(Based on 3 full and 6 partial tracts) A) FHA, FSA/RHS & VA B) Conventional C) Refinancings D) Home Improvement Loans E) Loans on Dwellings For 5+ Families F) Non-occupant Loans on Number Average Value Number Average Value Number Average Value Number Average Value Number Average Value Number Average Value
LOANS ORIGINATED 13 $114,109 270 $160,364 1,134 $131,229 101 $31,350 2 $472,930 382 $177,376 APPLICATIONS APPROVED, NOT ACCEPTED 5 $111,972 38 $153,554 129 $134,577 11 $26,291 0 $0 45 $203,522 APPLICATIONS DENIED 3 $92,443 50 $110,068 350 $146,270 48 $26,865 0 $0 48 $195,363 APPLICATIONS WITHDRAWN 4 $131,775 28 $109,798 215 $129,851 7 $33,069 0 $0 22 $191,282 FILES CLOSED FOR INCOMPLETENESS 1 $62,290 4 $141,982 41 $166,338 3 $29,027 1 $74,630 8 $309,539
Aggregated Statistics For Year 2002(Based on 3 full and 6 partial tracts) A) FHA, FSA/RHS & VA B) Conventional C) Refinancings D) Home Improvement Loans E) Loans on Dwellings For 5+ Families F) Non-occupant Loans on Number Average Value Number Average Value Number Average Value Number Average Value Number Average Value Number Average Value
LOANS ORIGINATED 13 $87,057 272 $140,287 810 $131,244 102 $26,659 2 $97,565 267 $175,954 APPLICATIONS APPROVED, NOT ACCEPTED 3 $97,617 26 $125,481 125 $111,808 10 $42,399 0 $0 10 $109,780 APPLICATIONS DENIED 4 $98,345 61 $53,014 300 $92,050 44 $17,860 0 $0 27 $94,187 APPLICATIONS WITHDRAWN 1 $62,500 20 $128,610 121 $116,200 5 $24,120 0 $0 13 $107,560 FILES CLOSED FOR INCOMPLETENESS 1 $42,730 4 $45,545 52 $138,313 0 $0 0 $0 4 $217,070
Aggregated Statistics For Year 2001(Based on 3 full and 6 partial tracts) A) FHA, FSA/RHS & VA B) Conventional C) Refinancings D) Home Improvement Loans E) Loans on Dwellings For 5+ Families F) Non-occupant Loans on Number Average Value Number Average Value Number Average Value Number Average Value Number Average Value Number Average Value
LOANS ORIGINATED 31 $88,354 231 $130,657 713 $117,067 126 $26,131 2 $82,500 203 $158,030 APPLICATIONS APPROVED, NOT ACCEPTED 3 $79,227 45 $82,607 85 $87,732 24 $30,880 0 $0 8 $140,901 APPLICATIONS DENIED 4 $105,042 112 $47,693 296 $80,676 102 $19,425 0 $0 18 $76,424 APPLICATIONS WITHDRAWN 4 $71,855 21 $138,815 140 $88,800 7 $31,793 0 $0 6 $258,215 FILES CLOSED FOR INCOMPLETENESS 1 $86,610 8 $86,045 38 $98,987 1 $4,290 0 $0 4 $77,818
Aggregated Statistics For Year 2000(Based on 3 full and 6 partial tracts) A) FHA, FSA/RHS & VA B) Conventional C) Refinancings D) Home Improvement Loans F) Non-occupant Loans on Number Average Value Number Average Value Number Average Value Number Average Value Number Average Value
LOANS ORIGINATED 23 $79,229 278 $108,769 289 $78,235 142 $24,606 125 $135,218 APPLICATIONS APPROVED, NOT ACCEPTED 1 $109,700 54 $83,864 78 $70,504 24 $18,458 13 $105,823 APPLICATIONS DENIED 7 $92,826 271 $55,676 263 $66,720 105 $20,116 33 $60,254 APPLICATIONS WITHDRAWN 3 $60,167 32 $89,852 79 $72,291 9 $29,330 8 $106,339 FILES CLOSED FOR INCOMPLETENESS 1 $65,060 9 $147,059 32 $73,349 0 $0 5 $209,140
Aggregated Statistics For Year 1999(Based on 3 full and 3 partial tracts) A) FHA, FSA/RHS & VA B) Conventional C) Refinancings D) Home Improvement Loans E) Loans on Dwellings For 5+ Families F) Non-occupant Loans on Number Average Value Number Average Value Number Average Value Number Average Value Number Average Value Number Average Value
LOANS ORIGINATED 22 $81,078 219 $110,417 367 $91,013 140 $23,838 2 $90,025 110 $134,256 APPLICATIONS APPROVED, NOT ACCEPTED 2 $79,130 31 $101,302 87 $61,879 25 $21,916 0 $0 7 $175,910 APPLICATIONS DENIED 5 $88,006 179 $54,649 163 $65,006 64 $12,806 0 $0 31 $70,508 APPLICATIONS WITHDRAWN 4 $86,010 27 $84,443 92 $73,882 6 $52,077 0 $0 11 $75,535 FILES CLOSED FOR INCOMPLETENESS 0 $0 6 $73,238 29 $79,900 0 $0 0 $0 4 $60,998
Private Mortgage Insurance Companies Aggregated Statistics For Year 2009(Based on 3 full and 4 partial tracts) A) Conventional B) Refinancings C) Non-occupant Loans on D) Loans On Manufactured Number Average Value Number Average Value Number Average Value Number Average Value
LOANS ORIGINATED 6 $146,627 6 $193,512 2 $158,000 1 $81,640 APPLICATIONS APPROVED, NOT ACCEPTED 4 $309,720 3 $144,377 0 $0 0 $0 APPLICATIONS DENIED 2 $166,000 1 $275,410 1 $90,000 0 $0 APPLICATIONS WITHDRAWN 0 $0 0 $0 0 $0 0 $0 FILES CLOSED FOR INCOMPLETENESS 0 $0 0 $0 0 $0 0 $0
Aggregated Statistics For Year 2008(Based on 3 full and 4 partial tracts) A) Conventional B) Refinancings C) Non-occupant Loans on D) Loans On Manufactured Number Average Value Number Average Value Number Average Value Number Average Value
LOANS ORIGINATED 23 $180,514 12 $151,772 9 $122,828 1 $130,110 APPLICATIONS APPROVED, NOT ACCEPTED 10 $189,021 8 $166,624 4 $186,862 0 $0 APPLICATIONS DENIED 2 $192,000 1 $159,000 2 $192,000 0 $0 APPLICATIONS WITHDRAWN 1 $236,160 0 $0 1 $183,000 0 $0 FILES CLOSED FOR INCOMPLETENESS 0 $0 1 $113,000 0 $0 0 $0
Aggregated Statistics For Year 2007(Based on 3 full and 4 partial tracts) A) Conventional B) Refinancings C) Non-occupant Loans on D) Loans On Manufactured Number Average Value Number Average Value Number Average Value Number Average Value
LOANS ORIGINATED 35 $143,676 10 $160,950 20 $177,581 1 $77,810 APPLICATIONS APPROVED, NOT ACCEPTED 6 $128,907 1 $212,390 2 $226,000 0 $0 APPLICATIONS DENIED 1 $91,480 0 $0 0 $0 1 $68,880 APPLICATIONS WITHDRAWN 4 $146,238 0 $0 3 $153,650 0 $0 FILES CLOSED FOR INCOMPLETENESS 0 $0 0 $0 0 $0 0 $0
Aggregated Statistics For Year 2006(Based on 3 full and 4 partial tracts) A) Conventional B) Refinancings C) Non-occupant Loans on D) Loans On Manufactured Number Average Value Number Average Value Number Average Value Number Average Value
LOANS ORIGINATED 29 $148,858 19 $144,915 10 $140,651 1 $90,360 APPLICATIONS APPROVED, NOT ACCEPTED 4 $174,062 3 $146,960 2 $227,500 0 $0 APPLICATIONS DENIED 0 $0 0 $0 0 $0 0 $0 APPLICATIONS WITHDRAWN 1 $65,920 0 $0 0 $0 0 $0 FILES CLOSED FOR INCOMPLETENESS 0 $0 1 $114,800 0 $0 0 $0
Aggregated Statistics For Year 2005(Based on 3 full and 4 partial tracts) A) Conventional B) Refinancings C) Non-occupant Loans on D) Loans On Manufactured Number Average Value Number Average Value Number Average Value Number Average Value
LOANS ORIGINATED 27 $152,662 15 $134,831 14 $171,621 2 $128,485 APPLICATIONS APPROVED, NOT ACCEPTED 7 $219,206 6 $127,048 5 $219,088 1 $115,000 APPLICATIONS DENIED 0 $0 2 $116,220 2 $81,140 0 $0 APPLICATIONS WITHDRAWN 5 $105,880 3 $129,427 4 $117,070 2 $87,200 FILES CLOSED FOR INCOMPLETENESS 1 $132,190 0 $0 1 $108,000 0 $0
Aggregated Statistics For Year 2004(Based on 3 full and 4 partial tracts) A) Conventional B) Refinancings C) Non-occupant Loans on D) Loans On Manufactured Number Average Value Number Average Value Number Average Value Number Average Value
LOANS ORIGINATED 39 $133,591 8 $151,972 16 $151,235 1 $57,400 APPLICATIONS APPROVED, NOT ACCEPTED 8 $143,308 7 $138,787 3 $177,000 0 $0 APPLICATIONS DENIED 1 $27,430 2 $100,180 0 $0 1 $80,360 APPLICATIONS WITHDRAWN 3 $180,413 3 $191,000 3 $124,923 0 $0 FILES CLOSED FOR INCOMPLETENESS 0 $0 0 $0 0 $0 0 $0
Aggregated Statistics For Year 2003(Based on 3 full and 6 partial tracts) A) Conventional B) Refinancings C) Non-occupant Loans on Number Average Value Number Average Value Number Average Value
LOANS ORIGINATED 76 $129,913 57 $125,426 30 $148,957 APPLICATIONS APPROVED, NOT ACCEPTED 15 $121,043 14 $119,502 5 $148,800 APPLICATIONS DENIED 2 $182,695 3 $113,480 0 $0 APPLICATIONS WITHDRAWN 2 $73,890 3 $127,197 1 $118,790 FILES CLOSED FOR INCOMPLETENESS 0 $0 1 $103,000 0 $0
Aggregated Statistics For Year 2002(Based on 3 full and 6 partial tracts) A) Conventional B) Refinancings C) Non-occupant Loans on Number Average Value Number Average Value Number Average Value
LOANS ORIGINATED 51 $119,767 42 $121,784 14 $131,209 APPLICATIONS APPROVED, NOT ACCEPTED 17 $168,598 13 $138,542 3 $282,017 APPLICATIONS DENIED 3 $89,077 3 $102,650 1 $197,610 APPLICATIONS WITHDRAWN 5 $136,106 2 $119,500 0 $0 FILES CLOSED FOR INCOMPLETENESS 0 $0 0 $0 0 $0
Aggregated Statistics For Year 2001(Based on 3 full and 6 partial tracts) A) Conventional B) Refinancings C) Non-occupant Loans on Number Average Value Number Average Value Number Average Value
LOANS ORIGINATED 48 $124,000 40 $128,653 10 $139,710 APPLICATIONS APPROVED, NOT ACCEPTED 14 $119,927 15 $123,047 4 $110,115 APPLICATIONS DENIED 0 $0 4 $97,872 0 $0 APPLICATIONS WITHDRAWN 0 $0 3 $167,547 0 $0 FILES CLOSED FOR INCOMPLETENESS 0 $0 0 $0 0 $0
Aggregated Statistics For Year 2000(Based on 3 full and 6 partial tracts) A) Conventional B) Refinancings C) Non-occupant Loans on Number Average Value Number Average Value Number Average Value
LOANS ORIGINATED 37 $107,871 18 $103,198 10 $107,173 APPLICATIONS APPROVED, NOT ACCEPTED 12 $136,424 2 $100,790 4 $140,542 APPLICATIONS DENIED 2 $144,920 0 $0 0 $0 APPLICATIONS WITHDRAWN 0 $0 0 $0 0 $0 FILES CLOSED FOR INCOMPLETENESS 1 $86,000 0 $0 0 $0
Aggregated Statistics For Year 1999(Based on 3 full and 3 partial tracts) A) Conventional B) Refinancings C) Non-occupant Loans on Number Average Value Number Average Value Number Average Value
LOANS ORIGINATED 40 $101,967 20 $102,298 8 $111,140 APPLICATIONS APPROVED, NOT ACCEPTED 0 $0 4 $120,815 0 $0 APPLICATIONS DENIED 3 $124,620 0 $0 2 $81,425 APPLICATIONS WITHDRAWN 0 $0 1 $72,950 0 $0 FILES CLOSED FOR INCOMPLETENESS 0 $0 0 $0 0 $0
2002 - 2018 National Fire Incident Reporting System (NFIRS) incidents See full 2006 National Fire Incident Reporting System statistics for zip code 49090, Michigan
Most common first names in zip code 49090 among deceased individuals Name Count Lived (average)
John 123 76.1 years Mary 109 78.6 years William 94 71.8 years Robert 94 72.8 years James 79 74.5 years Charles 79 73.9 years George 69 76.1 years Helen 56 81.2 years Frank 50 81.6 years Margaret 49 80.3 years
Most common last names in zip code 49090 among deceased individuals Last name Count Lived (average)
Smith 62 76.4 years Johnson 47 75.4 years Williams 39 68.0 years Brown 35 76.6 years Miller 24 74.8 years Davis 21 75.1 years Robinson 20 78.1 years Nelson 19 80.1 years Jones 19 74.8 years Anderson 18 76.0 years
Businesses in zip code 49090
Name Count Name Count
AutoZone 1 McDonald's 2 Burger King 1 Menards 1 Chevrolet 1 Penske 1 Comfort Suites 1 Pizza Hut 1 Curves 1 Quiznos 1 DHL 1 RadioShack 1 Dairy Queen 1 Ramada 1 FedEx 1 Subway 1 Ford 1 Taco Bell 1 H&R Block 1 U-Haul 1 Holiday Inn 1 UPS 3 La-Z-Boy 1 Walgreens 1 Lane Furniture 1 Walmart 1 Little Caesars Pizza 1 Wendy's 1 MasterBrand Cabinets 4
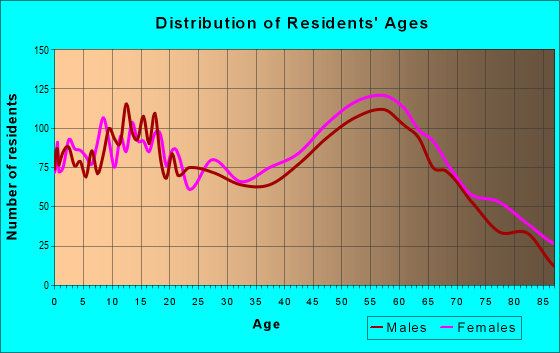
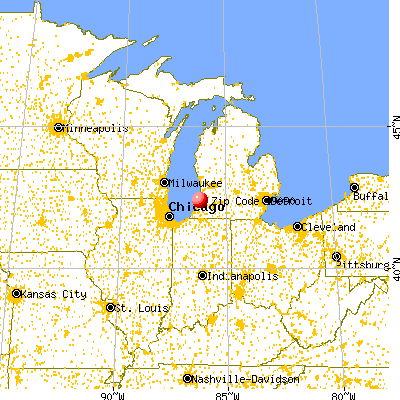


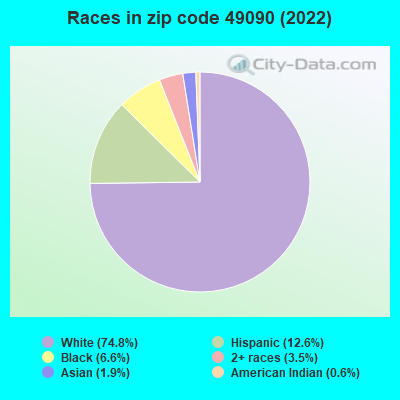


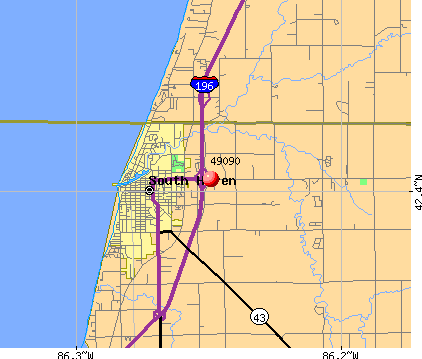 Nearest zip codes: 49043, 49013, 49450, 49027, 49056, 49408.
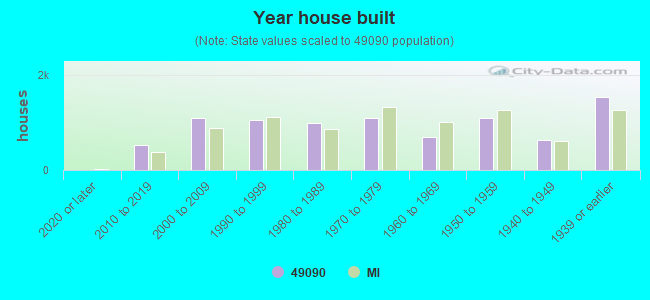
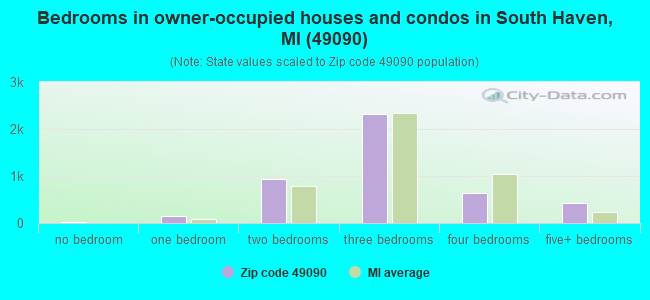
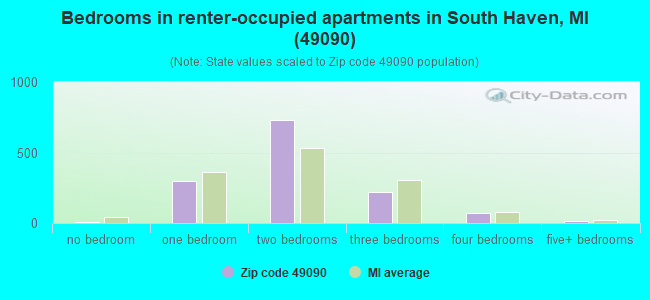
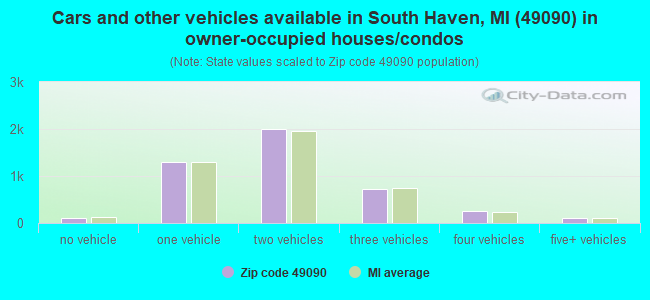
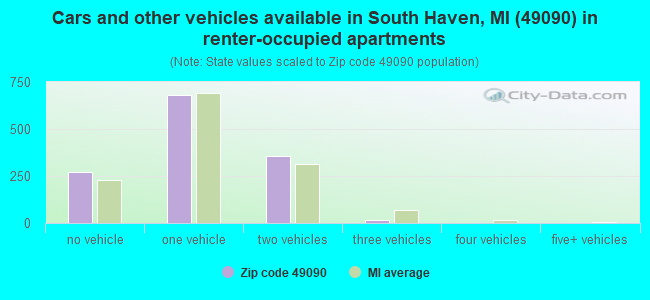


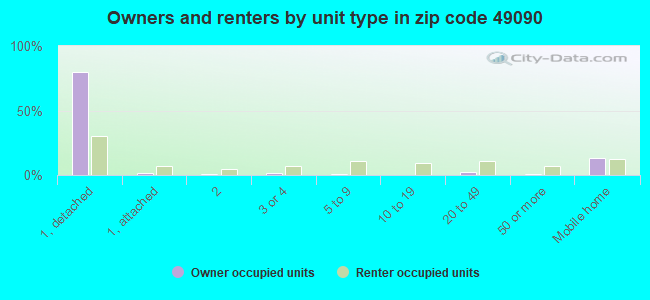
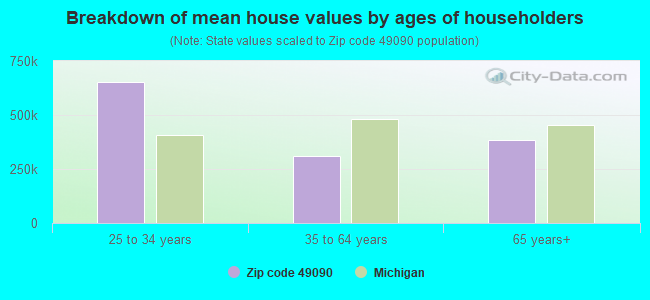


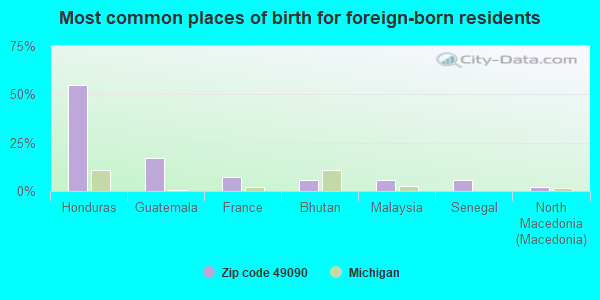
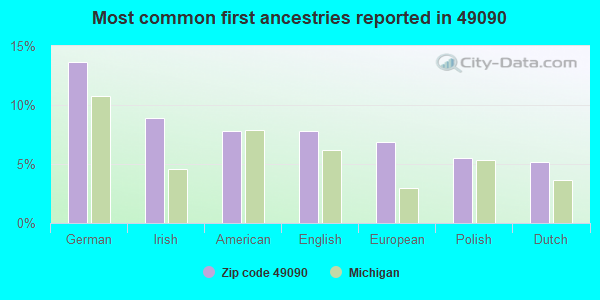
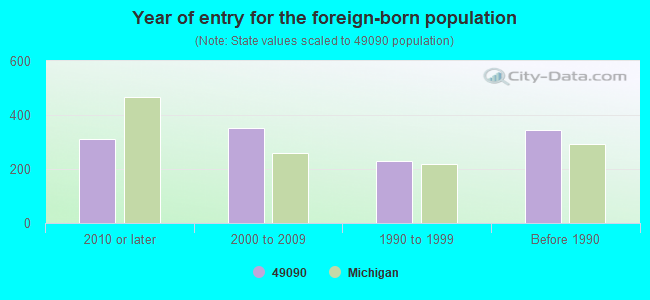

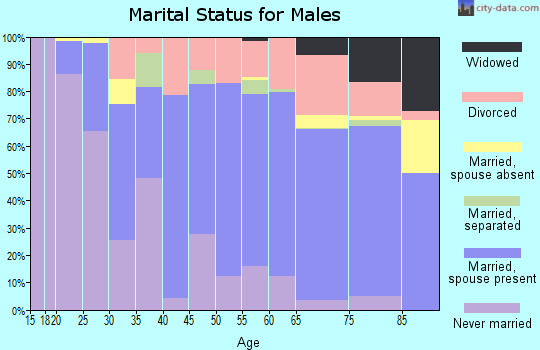
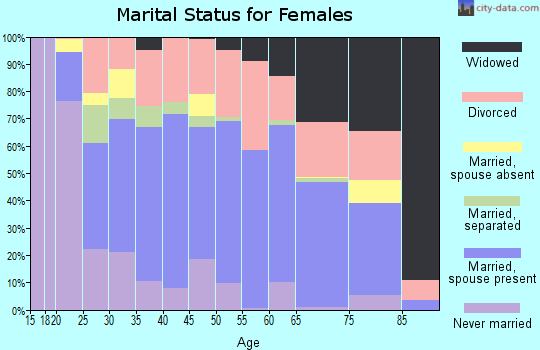
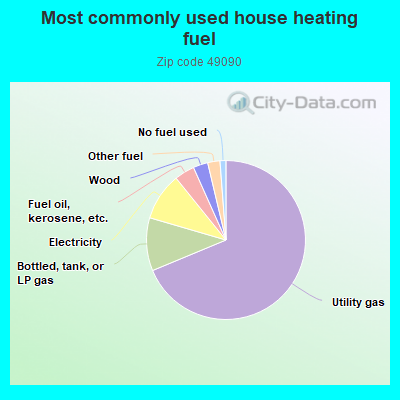
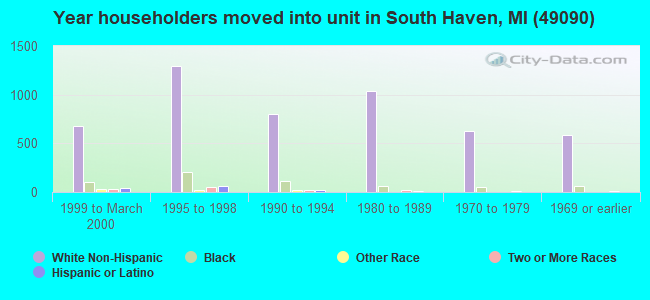

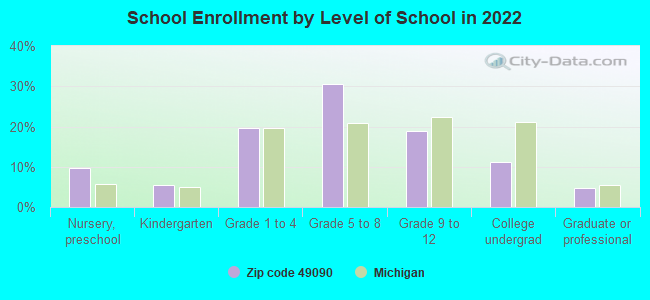
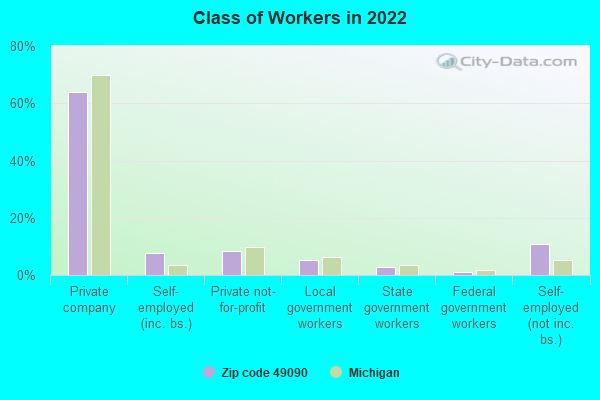
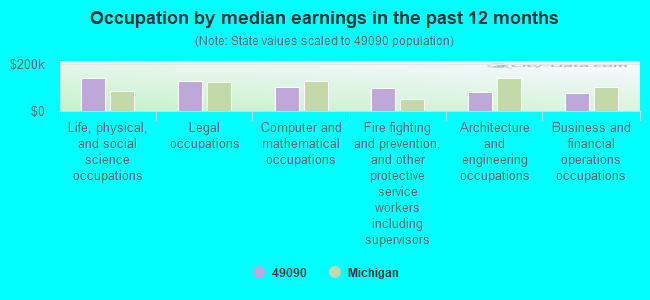
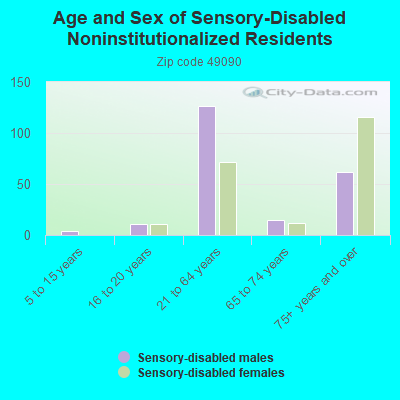
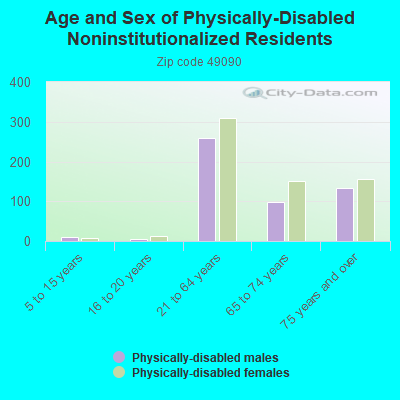
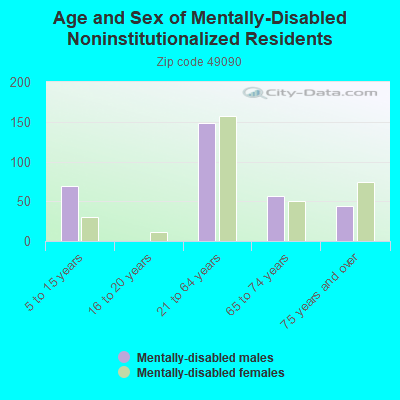
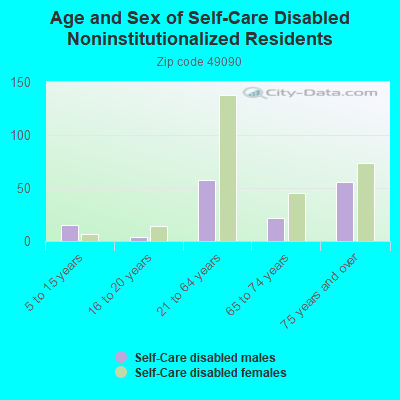
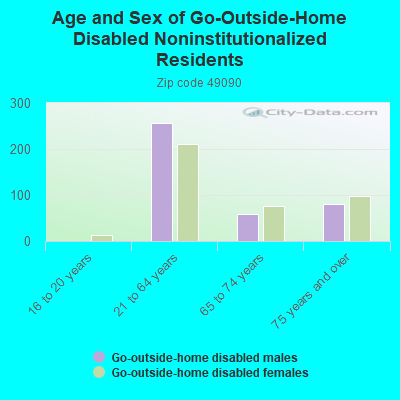
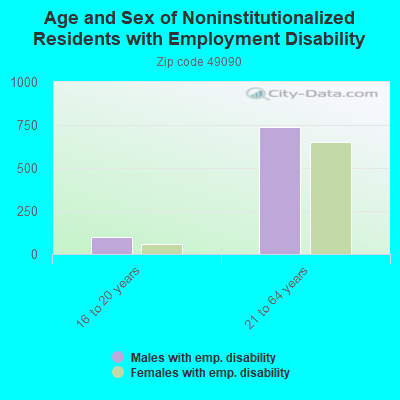
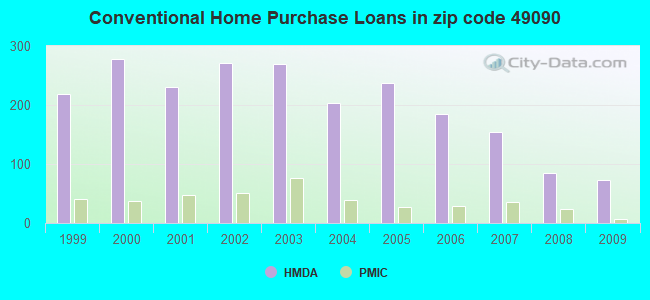
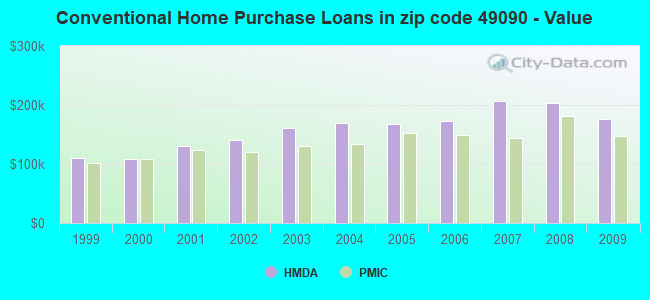
 Based on the data from the years 2002 - 2018 the average number of fire incidents per year is 71. The highest number of fire incidents - 116 took place in 2002, and the least - 38 in 2009. The data has a declining trend.
 When looking into fire subcategories, the most incidents belonged to: Structure Fires (44.8%), and Outside Fires (29.8%).