Estimated zip code population in 2022: 2,160 Zip code population in 2010: 2,462 Zip code population in 2000: 2,551
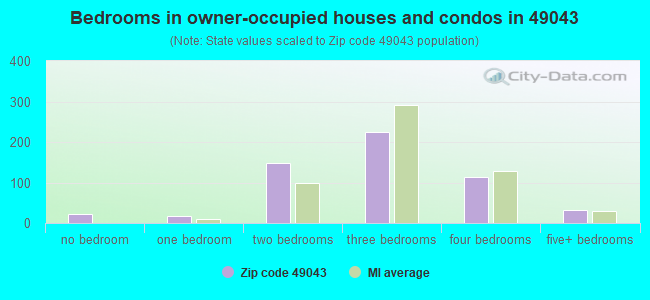
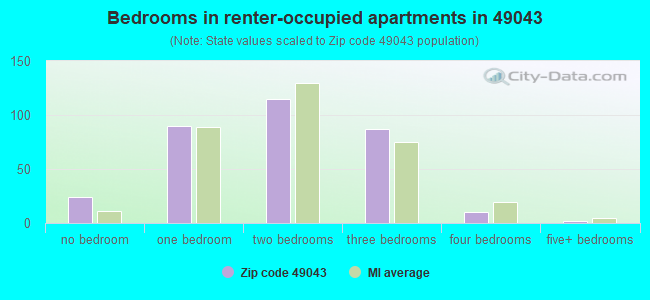
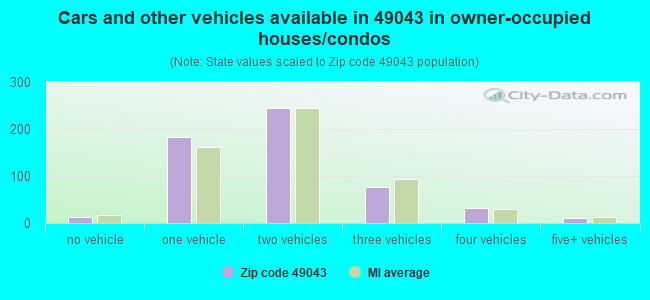
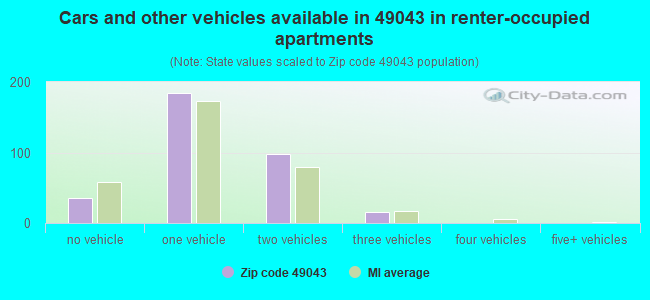
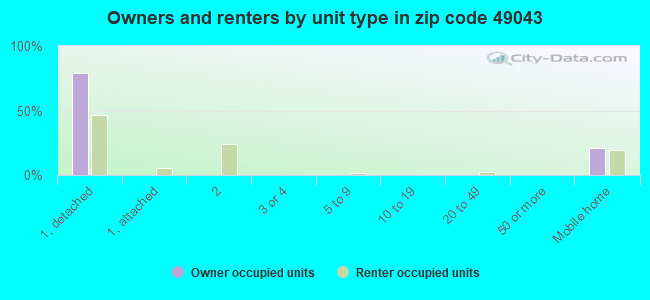
Houses and condos: 1,384 Renter-occupied apartments: 332
% of renters here:
37%
State:
27%
March 2022 cost of living index in zip code 49043: 81.9 (low, U.S. average is 100)
Land area: 32.4 sq. mi. Water area: 1.9 sq. mi.
Population density: 67 people per square mile
(very low).
OSM Map
General Map
Google Map
MSN Map
OSM Map
General Map
Google Map
MSN Map
OSM Map
General Map
Google Map
MSN Map
OSM Map
General Map
Google Map
MSN Map
Please wait while loading the map...
Real estate property taxes paid for housing units in 2022:
This zip code:
1.1% ($1,563)
Michigan:
1.2% ($2,746)
Median real estate property taxes paid for housing units with mortgages in 2022: $1,928 (1.2%) Median real estate property taxes paid for housing units with no mortgage in 2022: $1,287 (1.2%)
Business Search- 14 Million verified businesses
Males: 1,046
(48.4%)
Females: 1,113
(51.6%)
For population 25 years and over in 49043:
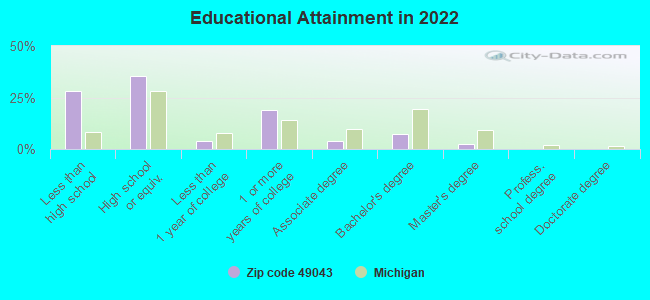
High school or higher: 70.5%
Bachelor's degree or higher: 9.7%
Graduate or professional degree: 2.3%
Unemployed: 2.8%
Mean travel time to work (commute): 28.3 minutes
For population 15 years and over in 49043:
Never married: 38.6%
Now married: 49.5%
Separated: 1.2%
Widowed: 5.7%
Divorced: 5.1%
Zip code 49043 compared to state average:
Median household income below state average.
Median house value below state average.
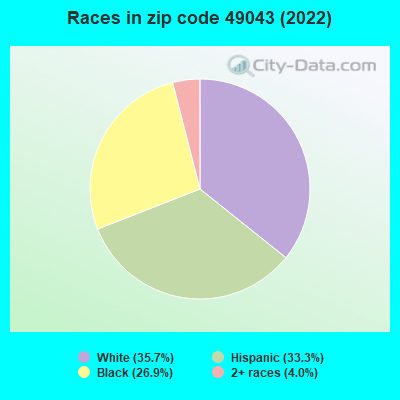
Black race population percentage above state average.
Hispanic race population percentage significantly above state average.
Foreign-born population percentage above state average.
Length of stay since moving in above state average.
Number of college students significantly below state average.
Percentage of population with a bachelor's degree or higher significantly below state average.
Averages for the 2020 tax year for zip code 49043, filed in 2021:
Average Adjusted Gross Income (AGI) in 2020: $38,780 (Individual Income Tax Returns)
Here:
$38,780
State:
$68,945
Salary/wage: $32,919 (reported on 83.0% of returns)
Here:
$32,919
State:
$57,142
(% of AGI for various income ranges: 1188.5% for AGIs below $25k, 3727.1% for AGIs $25k-50k, 7197.1% for AGIs $50k-75k, 14050.0% for AGIs $75k-100k, 22026.7% for AGIs $100k-200k)
Taxable interest for individuals: $930 (reported on 10.0% of returns)
This zip code:
$930
Michigan:
$1,630
(% of AGI for various income ranges: 7.3% for AGIs below $25k, 7.1% for AGIs $50k-75k, 213.3% for AGIs $100k-200k)
Ordinary dividends: $2,233 (reported on 6.0% of returns)
Here:
$2,233
State:
$6,972
(% of AGI for various income ranges: 9.7% for AGIs below $25k, 510.0% for AGIs $75k-100k)
Net capital gain/loss in AGI: +$8,317 (reported on 6.0% of returns)
Here:
+$8,317
State:
+$20,064
(% of AGI for various income ranges: 15.8% for AGIs $25k-50k, 1536.7% for AGIs $100k-200k)
Profit/loss from business: +$7,233 (reported on 15.0% of returns)
Here:
+$7,233
State:
+$11,172
(% of AGI for various income ranges: 95.5% for AGIs below $25k, 220.4% for AGIs $25k-50k, 344.3% for AGIs $50k-75k)
Taxable individual retirement arrangement distribution: $13,650 (reported on 4.0% of returns)
49043:
$13,650
Michigan:
$19,803
(% of AGI for various income ranges: 780.0% for AGIs $50k-75k)
Total itemized deductions: $37,000 (reported on 2.0% of returns)
Here:
$37,000
State:
$34,117
(% of AGI for various income ranges: 2466.7% for AGIs $100k-200k)
Taxes paid: $9,300 (reported on 2.0% of returns)
49043:
$9,300
State:
$7,972
(% of AGI for various income ranges: 620.0% for AGIs $100k-200k)
Earned income credit: $2,359 (reported on 27.0% of returns)
Here:
$2,359
State:
$2,251
(% of AGI for various income ranges: 119.1% for AGIs below $25k, 101.7% for AGIs $25k-50k)
Percentage of individuals using paid preparers for their 2020 taxes: 94.0%
Here:
94%
State:
93%
(% for various income ranges: 95.7% for AGIs below $25k, 90.6% for AGIs $25k-50k, 90.9% for AGIs $50k-75k, 100.0% for AGIs $75k-100k, 100.0% for AGIs $100k-200k)
Averages for the 2012 tax year for zip code 49043, filed in 2013:
Average Adjusted Gross Income (AGI) in 2012: $30,749 (Individual Income Tax Returns)
Here:
$30,749
State:
$55,609
Salary/wage: $25,119 (reported on 82.4% of returns)
Here:
$25,119
State:
$46,782
(% of AGI for various income ranges: 76.0% for AGIs below $25k, 81.6% for AGIs $25k-50k, 81.6% for AGIs $50k-75k, 66.0% for AGIs $75k-100k, 39.8% for AGIs $100k-200k)
Taxable interest for individuals: $1,100 (reported on 15.4% of returns)
This zip code:
$1,100
Michigan:
$1,491
(% of AGI for various income ranges: 0.9% for AGIs below $25k, 1.7% for AGIs $50k-75k, 0.4% for AGIs $100k-200k)
Ordinary dividends: $1,871 (reported on 7.7% of returns)
Here:
$1,871
State:
$6,225
Net capital gain/loss in AGI: +$15,725 (reported on 4.4% of returns)
Here:
+$15,725
State:
+$9,326
(% of AGI for various income ranges: 21.1% for AGIs $75k-100k)
Profit/loss from business: +$7,569 (reported on 14.3% of returns)
Here:
+$7,569
State:
+$11,523
Taxable individual retirement arrangement distribution: $21,875 (reported on 4.4% of returns)
49043:
$21,875
Michigan:
$15,298
Total itemized deductions: $21,262 (24% of AGI, reported on 14.3% of returns)
Here:
$21,262
State:
$21,628
Here:
24.0% of AGI
State:
18.4% of AGI
(% of AGI for various income ranges: 5.6% for AGIs below $25k, 4.5% for AGIs $25k-50k, 12.6% for AGIs $50k-75k, 12.4% for AGIs $75k-100k, 16.3% for AGIs $100k-200k)
Charity contributions: $4,925 (reported on 8.8% of returns)
Here:
$4,925
State:
$4,225
(% of AGI for various income ranges: 1.2% for AGIs below $25k, 3.3% for AGIs $50k-75k, 2.6% for AGIs $100k-200k)
Taxes paid: $6,700 (reported on 14.3% of returns)
49043:
$6,700
State:
$8,327
(% of AGI for various income ranges: 1.4% for AGIs below $25k, 0.7% for AGIs $25k-50k, 3.3% for AGIs $50k-75k, 3.9% for AGIs $75k-100k, 6.4% for AGIs $100k-200k)
Earned income credit: $2,562 (reported on 35.2% of returns)
Here:
$2,562
State:
$2,306
(% of AGI for various income ranges: 10.7% for AGIs below $25k, 2.0% for AGIs $25k-50k)
Percentage of individuals using paid preparers for their 2012 taxes: 59.3%
Here:
59%
State:
57%
(% for various income ranges: 55.4% for AGIs below $25k, 61.9% for AGIs $25k-50k, 66.7% for AGIs $50k-75k, 75.0% for AGIs $75k-100k, 75.0% for AGIs $100k-200k)
Averages for the 2004 tax year for zip code 49043, filed in 2005:
Average Adjusted Gross Income (AGI) in 2004: $26,406 (Individual Income Tax Returns)
Here:
$26,406
State:
$48,204
Salary/wage: $23,452 (reported on 83.8% of returns)
Here:
$23,452
State:
$42,791
(% of AGI for various income ranges: 98.1% for AGIs below $10k, 79.1% for AGIs $10k-25k, 83.8% for AGIs $25k-50k, 77.6% for AGIs $50k-75k, 71.8% for AGIs $75k-100k, 48.5% for AGIs over 100k)
Taxable interest for individuals: $854 (reported on 21.7% of returns)
This zip code:
$854
Michigan:
$1,725
(% of AGI for various income ranges: 2.5% for AGIs below $10k, 0.5% for AGIs $10k-25k, 1.1% for AGIs $25k-50k, 0.5% for AGIs $50k-75k, 0.3% for AGIs over 100k)
Taxable dividends: $1,405 (reported on 8.7% of returns)
Here:
$1,405
State:
$3,420
(% of AGI for various income ranges: 1.5% for AGIs below $10k, 0.4% for AGIs $10k-25k, 0.4% for AGIs $25k-50k, 0.3% for AGIs $50k-75k, 0.7% for AGIs over 100k)
Net capital gain/loss: +$14,141 (reported on 7.5% of returns)
Here:
+$14,141
State:
+$8,532
(% of AGI for various income ranges: -3.3% for AGIs below $10k, -0.3% for AGIs $10k-25k, -0.2% for AGIs $25k-50k, 0.8% for AGIs $50k-75k, 20.7% for AGIs over 100k)
Profit/loss from business: +$3,361 (reported on 12.7% of returns)
Here:
+$3,361
State:
+$9,547
(% of AGI for various income ranges: 9.3% for AGIs below $10k, 6.0% for AGIs $10k-25k, -0.6% for AGIs $25k-50k, 0.5% for AGIs $50k-75k)
Profit/loss from farming: +$1,895 (reported on 4.5% of returns)
Here:
+$1,895
State:
-$4,492
Total itemized deductions: $16,016 (24% of AGI, reported on 14.4% of returns)
Here:
$16,016
State:
$18,509
Here:
24.1% of AGI
State:
20.7% of AGI
(% of AGI for various income ranges: 5.3% for AGIs $10k-25k, 7.8% for AGIs $25k-50k, 9.1% for AGIs $50k-75k, 15.8% for AGIs $75k-100k, 13.3% for AGIs over 100k)
Charity contributions deductions: $3,366 (5% of AGI, reported on 10.9% of returns)
Here:
$3,366
State:
$3,365
Here:
5.1% of AGI
State:
3.6% of AGI
(% of AGI for various income ranges: 0.9% for AGIs $10k-25k, 1.3% for AGIs $25k-50k, 3.1% for AGIs $50k-75k, 1.2% for AGIs over 100k)
Total tax: $3,899 (reported on 54.5% of returns)
49043:
$3,899
State:
$7,691
(% of AGI for various income ranges: 2.7% for AGIs below $10k, 2.9% for AGIs $10k-25k, 5.5% for AGIs $25k-50k, 9.0% for AGIs $50k-75k, 8.7% for AGIs $75k-100k, 17.4% for AGIs over 100k)
Earned income credit: $2,104 (reported on 36.0% of returns)
Here:
$2,104
State:
$1,737
Percentage of individuals using paid preparers for their 2004 taxes: 67.3%
Here:
67%
State:
60%
(% for various income ranges: 61.5% for AGIs below $10k, 69.5% for AGIs $10k-25k, 69.8% for AGIs $25k-50k, 66.7% for AGIs $50k-75k, 81.2% for AGIs $75k-100k, 70.8% for AGIs over 100k)
Notable locations in zip code 49043: Covert/South Haven KOA Campground (A), Covert Township Fire and Emergency Medical Services (B), Covert Branch Library (C), Covert Historical Museum (D). Display/hide their locations on the map
Churches in zip code 49043 include: Emanuel Home (A), German Church (B), His Place Cathedral of Faith (C), Covert Community Church (D), First Baptist Church (E), Seventh-Day Adventist Church (F), Gospel Tabernacle Baptist Church (G), First Spiritual Church of God (H). Display/hide their locations on the map
In group quarters: 17 (-1 institutionalized population)
Size of family households: 304 2-persons, 189 3-persons, 92 4-persons, 12 5-persons, 30 6-persons, 5 7-or-more-persons
Size of nonfamily households: 213 1-person, 31 2-persons, 11 3-persons
236 married couples with children.
146 single-parent households (22 men, 124 women).
65.7% of residents of 49043 zip code speak English at home.
33.7% of residents speak Spanish at home (50% very well, 24% well, 21% not well, 5% not at all).
1.2% of residents speak other Indo-European language at home (38% very well, 50% well, 8% not well, 4% not at all).
0.1% of residents speak Asian or Pacific Island language at home (100% very well).
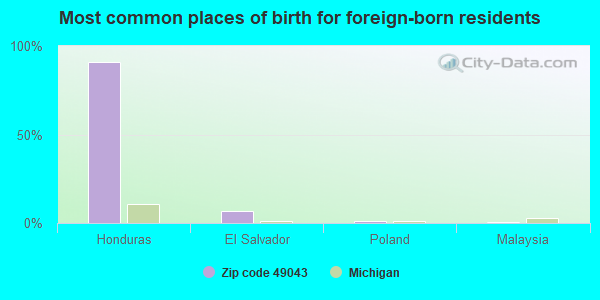
Foreign born population: 314 (14.5%) (26.1% of them are naturalized citizens)
This zip code:
14.5%
Whole state:
6.9%
91%Honduras
7%El Salvador
1%Poland
1%Malaysia
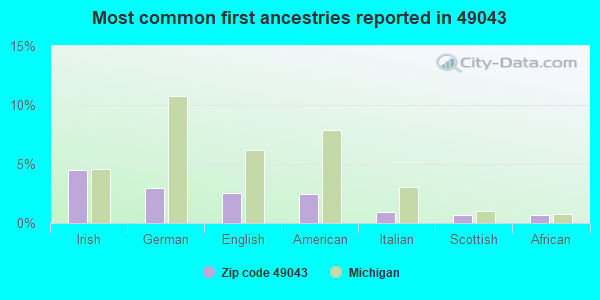
4%Irish
3%German
3%English
2%American
1%Italian
1%Scottish
1%African
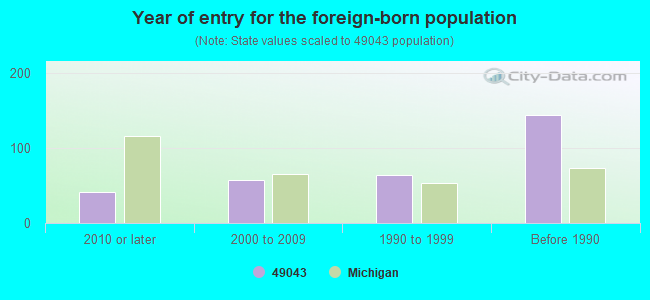
Year of entry for the foreign-born population
412010 or later
582000 to 2009
641990 to 1999
144Before 1990
Public high school in in zip code 49043 not listed on the city page:
COVERT HIGH SCHOOL(Students: 237, Location: 35323 M 140 HWY, Grades: 9-12)
Public elementary/middle schools in in zip code 49043 not listed on the city page:
Facilities with environmental interests located in this zip code:
BEN HORTON & SONS DISP AREA (76TH ST in COVERT, MI)
CRITERIA AND HAZARDOUS AIR POLLUTANT INVENTORY (Inventory of air pollution sources) Business SIC classification: REFUSE SYSTEMS Business NAICS classification: SOLID WASTE LANDFILL.
Housing units lacking complete plumbing facilities: 4.2% Housing units lacking complete kitchen facilities: 3.5%
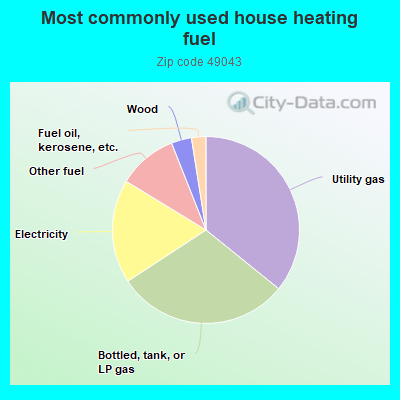
35.9%Utility gas
30.0%Bottled, tank, or LP gas
18.0%Electricity
10.3%Other fuel
3.5%Wood
2.5%Fuel oil, kerosene, etc.
Population in 1990: 2,544. Population change in the 1990s: +7 (+0.3%).
Place of birth for U.S.-born residents:
This state: 1,252
Northeast: 5
Midwest: 234
South: 287
West: 56
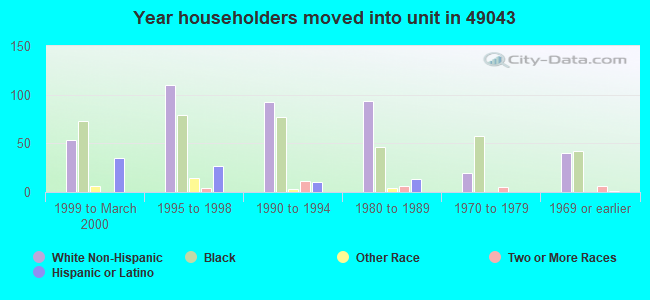
63% of the 49043 zip code residents lived in the same house 5 years ago. Out of people who lived in different houses, 44% lived in this county. Out of people who lived in different counties, 50% lived in Michigan.
96% of the 49043 zip code residents lived in the same house 1 year ago. Out of people who lived in different houses, 83% moved from this county. Out of people who lived in different houses, 19% moved from different county within same state.
Private vs. public school enrollment:
Students in private schools in grades 1 to 8 (elementary and middle school): 6
Here:
2.2%
Michigan:
12.4%
Students in private schools in grades 9 to 12 (high school):
Here:
0.0%
Michigan:
9.8%
Students in private undergraduate colleges:
Here:
0.0%
Michigan:
14.9%
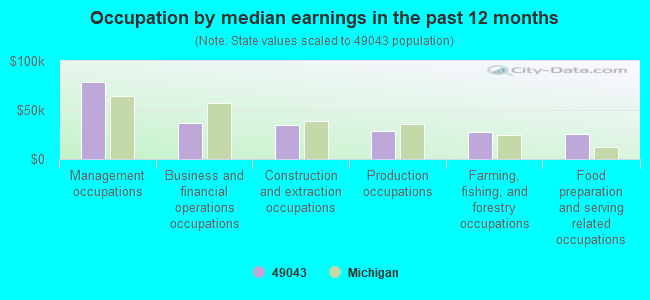
Occupation by median earnings in the past 12 months ($)
78,716Management occupations
37,171Business and financial operations occupations
34,715Construction and extraction occupations
28,212Production occupations
27,138Farming, fishing, and forestry occupations
25,862Food preparation and serving related occupations
Top industries in this zip code by the number of employees in 2005:
Utilities: Electric Power Distribution (100-249 employees: 1 establishment)
Accommodation and Food Services: Food Service Contractors (20-49: 1)
Other Services (except Public Administration): Religious Organizations (5-9: 1)
Educational Services: Professional and Management Development Training (5-9: 1)
Construction: Residential Remodelers (1-4: 1)
Other Services (except Public Administration): Civic and Social Organizations (1-4: 1)
Other Services (except Public Administration): Other Similar Organizations (except Business, Professional, Labor, and Political Organizations) (1-4: 1)
Professional, Scientific, and Technical Services: Process, Physical Distribution, and Logistics Consulting Services (1-4: 1)
People in group quarters in 2010:
14 people in workers' group living quarters and job corps centers
3 people in group homes intended for adults
People in group quarters in 2000:
23 people in unknown juvenile institutions
6 people in other nonhousehold living situations
Fatal accident statistics in 2013:
Fatal accident count: 1
Vehicles involved in fatal accidents: 1
Fatal accidents caused by drunken drivers: 0
Fatalities: 1
Persons involved in fatal accidents: 2
Pedestrians involved in fatal accidents: 0
Fatal accident statistics in 2011:
Fatal accident count: 1
Vehicles involved in fatal accidents: 1
Fatal accidents caused by drunken drivers: 1
Fatalities: 1
Persons involved in fatal accidents: 3
Pedestrians involved in fatal accidents: 0
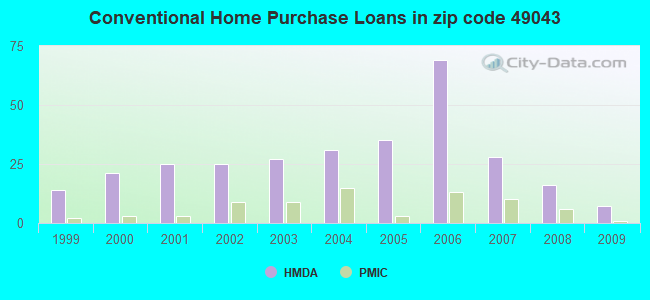
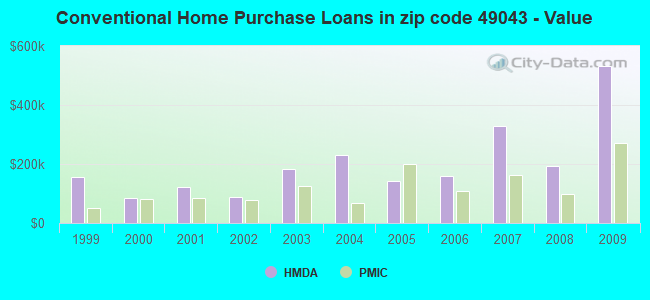
Home Mortgage Disclosure Act Aggregated Statistics For Year 2009 (Based on 2 partial tracts)
A) FHA, FSA/RHS & VA Home Purchase Loans
B) Conventional Home Purchase Loans
C) Refinancings
D) Home Improvement Loans
F) Non-occupant Loans on < 5 Family Dwellings (A B C & D)
G) Loans On Manufactured Home Dwelling (A B C & D)
Number
Average Value
Number
Average Value
Number
Average Value
Number
Average Value
Number
Average Value
Number
Average Value
LOANS ORIGINATED
1
$66,320
7
$533,094
59
$273,153
4
$95,428
34
$450,506
6
$61,163
APPLICATIONS APPROVED, NOT ACCEPTED
0
$0
1
$29,480
4
$95,428
0
$0
1
$29,480
0
$0
APPLICATIONS DENIED
1
$86,950
1
$170,960
31
$187,838
18
$20,142
13
$280,362
4
$66,320
APPLICATIONS WITHDRAWN
0
$0
1
$103,170
15
$103,363
1
$36,840
0
$0
1
$103,170
FILES CLOSED FOR INCOMPLETENESS
0
$0
0
$0
6
$178,330
0
$0
1
$508,460
1
$66,320
Aggregated Statistics For Year 2008 (Based on 2 partial tracts)
A) FHA, FSA/RHS & VA Home Purchase Loans
B) Conventional Home Purchase Loans
C) Refinancings
D) Home Improvement Loans
F) Non-occupant Loans on < 5 Family Dwellings (A B C & D)
G) Loans On Manufactured Home Dwelling (A B C & D)
Number
Average Value
Number
Average Value
Number
Average Value
Number
Average Value
Number
Average Value
Number
Average Value
LOANS ORIGINATED
6
$84,498
16
$194,449
40
$236,729
18
$37,418
16
$441,127
4
$82,902
APPLICATIONS APPROVED, NOT ACCEPTED
0
$0
1
$53,060
12
$69,760
7
$72,637
4
$121,220
6
$28,738
APPLICATIONS DENIED
3
$138,537
13
$87,748
50
$107,352
32
$35,417
6
$109,062
15
$66,616
APPLICATIONS WITHDRAWN
1
$176,860
0
$0
13
$106,567
3
$51,583
0
$0
0
$0
FILES CLOSED FOR INCOMPLETENESS
1
$144,430
0
$0
1
$125,270
0
$0
0
$0
0
$0
Aggregated Statistics For Year 2007 (Based on 2 partial tracts)
A) FHA, FSA/RHS & VA Home Purchase Loans
B) Conventional Home Purchase Loans
C) Refinancings
D) Home Improvement Loans
F) Non-occupant Loans on < 5 Family Dwellings (A B C & D)
G) Loans On Manufactured Home Dwelling (A B C & D)
Number
Average Value
Number
Average Value
Number
Average Value
Number
Average Value
Number
Average Value
Number
Average Value
LOANS ORIGINATED
4
$75,165
28
$328,447
59
$136,514
15
$87,151
29
$378,512
12
$75,901
APPLICATIONS APPROVED, NOT ACCEPTED
0
$0
15
$85,481
22
$127,350
1
$29,480
10
$149,001
1
$29,480
APPLICATIONS DENIED
3
$61,900
13
$65,868
53
$101,219
22
$44,214
12
$110,903
10
$73,690
APPLICATIONS WITHDRAWN
0
$0
19
$113,017
29
$104,741
6
$127,238
10
$59,394
1
$112,010
FILES CLOSED FOR INCOMPLETENESS
0
$0
4
$109,060
9
$101,037
0
$0
0
$0
0
$0
Aggregated Statistics For Year 2006 (Based on 2 partial tracts)
A) FHA, FSA/RHS & VA Home Purchase Loans
B) Conventional Home Purchase Loans
C) Refinancings
D) Home Improvement Loans
F) Non-occupant Loans on < 5 Family Dwellings (A B C & D)
G) Loans On Manufactured Home Dwelling (A B C & D)
Number
Average Value
Number
Average Value
Number
Average Value
Number
Average Value
Number
Average Value
Number
Average Value
LOANS ORIGINATED
6
$98,008
69
$159,704
69
$141,570
19
$65,002
46
$204,538
10
$97,566
APPLICATIONS APPROVED, NOT ACCEPTED
0
$0
9
$68,450
22
$84,409
1
$19,160
4
$112,745
1
$125,270
APPLICATIONS DENIED
3
$137,553
37
$93,128
94
$87,174
44
$34,768
12
$91,621
13
$103,506
APPLICATIONS WITHDRAWN
1
$188,650
16
$93,955
32
$95,152
6
$19,405
6
$116,185
4
$96,165
FILES CLOSED FOR INCOMPLETENESS
3
$105,130
4
$107,588
10
$169,340
0
$0
1
$235,810
0
$0
Aggregated Statistics For Year 2005 (Based on 2 partial tracts)
A) FHA, FSA/RHS & VA Home Purchase Loans
B) Conventional Home Purchase Loans
C) Refinancings
D) Home Improvement Loans
F) Non-occupant Loans on < 5 Family Dwellings (A B C & D)
G) Loans On Manufactured Home Dwelling (A B C & D)
Number
Average Value
Number
Average Value
Number
Average Value
Number
Average Value
Number
Average Value
Number
Average Value
LOANS ORIGINATED
7
$119,167
35
$142,622
71
$124,443
24
$44,091
29
$221,019
13
$76,525
APPLICATIONS APPROVED, NOT ACCEPTED
0
$0
10
$90,344
19
$95,332
7
$38,530
6
$73,198
3
$54,530
APPLICATIONS DENIED
3
$74,180
18
$97,434
84
$76,515
28
$24,949
7
$101,060
22
$64,043
APPLICATIONS WITHDRAWN
0
$0
12
$52,198
50
$95,355
10
$106,703
4
$55,268
0
$0
FILES CLOSED FOR INCOMPLETENESS
0
$0
0
$0
25
$131,227
0
$0
3
$480,460
1
$154,750
Aggregated Statistics For Year 2004 (Based on 2 partial tracts)
A) FHA, FSA/RHS & VA Home Purchase Loans
B) Conventional Home Purchase Loans
C) Refinancings
D) Home Improvement Loans
F) Non-occupant Loans on < 5 Family Dwellings (A B C & D)
G) Loans On Manufactured Home Dwelling (A B C & D)
Number
Average Value
Number
Average Value
Number
Average Value
Number
Average Value
Number
Average Value
Number
Average Value
LOANS ORIGINATED
1
$137,060
31
$232,147
90
$153,897
22
$22,308
28
$337,448
10
$70,005
APPLICATIONS APPROVED, NOT ACCEPTED
1
$112,010
4
$50,110
35
$84,175
1
$10,320
4
$136,695
6
$62,637
APPLICATIONS DENIED
4
$73,322
21
$99,868
149
$75,342
28
$22,370
10
$163,297
29
$67,591
APPLICATIONS WITHDRAWN
1
$110,540
6
$227,948
35
$76,006
0
$0
1
$119,380
6
$76,392
FILES CLOSED FOR INCOMPLETENESS
0
$0
0
$0
22
$81,662
0
$0
1
$81,060
1
$145,910
Aggregated Statistics For Year 2003 (Based on 2 partial tracts)
A) FHA, FSA/RHS & VA Home Purchase Loans
B) Conventional Home Purchase Loans
C) Refinancings
D) Home Improvement Loans
F) Non-occupant Loans on < 5 Family Dwellings (A B C & D)
Number
Average Value
Number
Average Value
Number
Average Value
Number
Average Value
Number
Average Value
LOANS ORIGINATED
1
$95,800
27
$181,605
136
$152,278
13
$31,743
52
$256,640
APPLICATIONS APPROVED, NOT ACCEPTED
0
$0
4
$105,008
16
$83,178
1
$60,430
3
$118,887
APPLICATIONS DENIED
0
$0
13
$75,731
97
$69,117
16
$9,119
10
$84,891
APPLICATIONS WITHDRAWN
0
$0
3
$206,333
55
$94,484
3
$57,477
6
$179,558
FILES CLOSED FOR INCOMPLETENESS
1
$41,270
0
$0
7
$79,796
0
$0
1
$137,060
Aggregated Statistics For Year 2002 (Based on 2 partial tracts)
A) FHA, FSA/RHS & VA Home Purchase Loans
B) Conventional Home Purchase Loans
C) Refinancings
D) Home Improvement Loans
F) Non-occupant Loans on < 5 Family Dwellings (A B C & D)
Number
Average Value
Number
Average Value
Number
Average Value
Number
Average Value
Number
Average Value
LOANS ORIGINATED
3
$88,427
25
$86,777
91
$143,347
18
$28,002
37
$160,883
APPLICATIONS APPROVED, NOT ACCEPTED
1
$76,640
6
$55,022
27
$88,046
3
$46,670
4
$57,848
APPLICATIONS DENIED
0
$0
15
$65,731
84
$69,356
13
$14,965
6
$57,478
APPLICATIONS WITHDRAWN
0
$0
1
$19,160
43
$79,757
1
$23,580
7
$44,003
FILES CLOSED FOR INCOMPLETENESS
0
$0
1
$97,270
10
$69,121
0
$0
1
$44,210
Aggregated Statistics For Year 2001 (Based on 2 partial tracts)
A) FHA, FSA/RHS & VA Home Purchase Loans
B) Conventional Home Purchase Loans
C) Refinancings
D) Home Improvement Loans
E) Loans on Dwellings For 5+ Families
F) Non-occupant Loans on < 5 Family Dwellings (A B C & D)
Number
Average Value
Number
Average Value
Number
Average Value
Number
Average Value
Number
Average Value
Number
Average Value
LOANS ORIGINATED
4
$82,165
25
$121,972
81
$107,151
24
$26,099
0
$0
15
$127,631
APPLICATIONS APPROVED, NOT ACCEPTED
3
$86,953
6
$42,248
24
$141,116
9
$21,288
1
$132,640
6
$162,118
APPLICATIONS DENIED
3
$53,547
29
$53,311
109
$60,534
28
$22,423
0
$0
7
$70,743
APPLICATIONS WITHDRAWN
1
$73,690
4
$51,215
44
$133,111
10
$36,698
0
$0
4
$399,032
FILES CLOSED FOR INCOMPLETENESS
1
$85,480
0
$0
10
$60,278
0
$0
0
$0
0
$0
Aggregated Statistics For Year 2000 (Based on 2 partial tracts)
A) FHA, FSA/RHS & VA Home Purchase Loans
B) Conventional Home Purchase Loans
C) Refinancings
D) Home Improvement Loans
F) Non-occupant Loans on < 5 Family Dwellings (A B C & D)
Number
Average Value
Number
Average Value
Number
Average Value
Number
Average Value
Number
Average Value
LOANS ORIGINATED
6
$78,603
21
$84,849
60
$64,602
13
$37,298
12
$165,188
APPLICATIONS APPROVED, NOT ACCEPTED
0
$0
7
$54,530
32
$57,985
6
$31,442
4
$67,795
APPLICATIONS DENIED
0
$0
38
$56,470
90
$59,787
32
$22,337
3
$53,547
APPLICATIONS WITHDRAWN
0
$0
1
$45,690
43
$50,760
3
$13,757
0
$0
FILES CLOSED FOR INCOMPLETENESS
0
$0
0
$0
16
$49,556
1
$73,690
0
$0
Aggregated Statistics For Year 1999 (Based on 1 partial tract)
A) FHA, FSA/RHS & VA Home Purchase Loans
B) Conventional Home Purchase Loans
C) Refinancings
D) Home Improvement Loans
F) Non-occupant Loans on < 5 Family Dwellings (A B C & D)
Detailed PMIC statistics for the following Tracts:0106.00
2002 - 2018 National Fire Incident Reporting System (NFIRS) incidents
According to the data from the years 2002 - 2018 the average number of fire incidents per year is 32. The highest number of reported fires - 62 took place in 2003, and the least - 12 in 2002. The data has a rising trend.
When looking into fire subcategories, the most reports belonged to: Outside Fires (45.1%), and Structure Fires (36.2%).
Fire incident types reported to NFIRS in Zip Code 49043


+$1,895
-$4,492
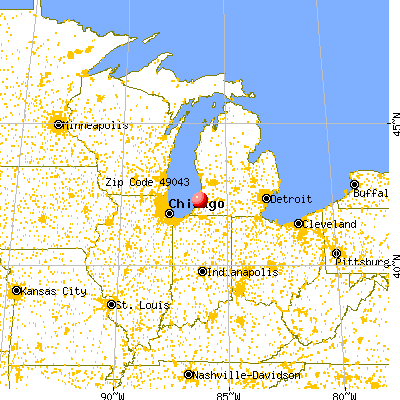
 Nearest zip codes: 49038, 49098, 49090, 49057, 49084, 49013.
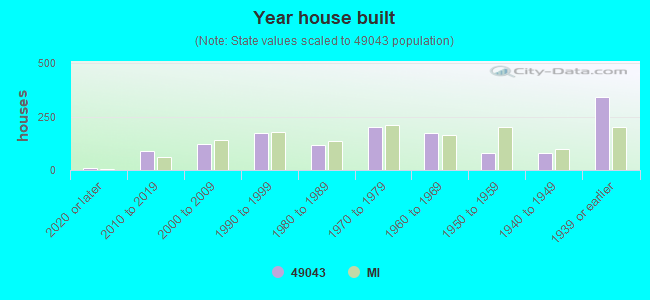


 (Students: 237, Location: 35323 M 140 HWY, Grades: 9-12)


 According to the data from the years 2002 - 2018 the average number of fire incidents per year is 32. The highest number of reported fires - 62 took place in 2003, and the least - 12 in 2002. The data has a rising trend.
 When looking into fire subcategories, the most reports belonged to: Outside Fires (45.1%), and Structure Fires (36.2%).