Estimated zip code population in 2022: 5,018 Zip code population in 2010: 5,508 Zip code population in 2000: 5,486
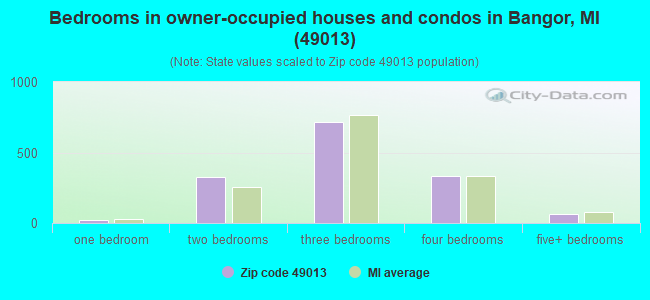
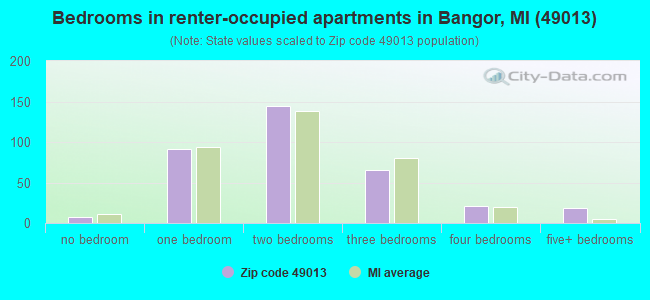
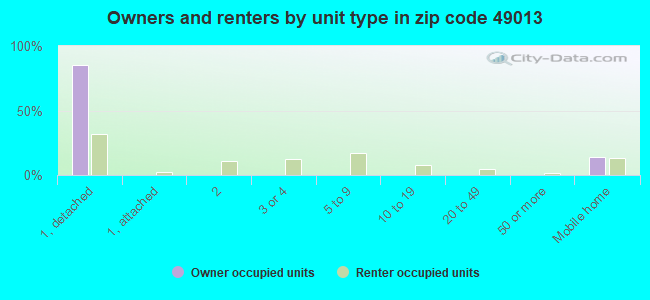
Houses and condos: 2,205 Renter-occupied apartments: 345
% of renters here:
19%
State:
27%
March 2022 cost of living index in zip code 49013: 79.9 (low, U.S. average is 100)
Land area: 59.0 sq. mi. Water area: 0.7 sq. mi.
Population density: 85 people per square mile
(very low).
OSM Map
General Map
Google Map
MSN Map
OSM Map
General Map
Google Map
MSN Map
OSM Map
General Map
Google Map
MSN Map
OSM Map
General Map
Google Map
MSN Map
Please wait while loading the map...
Real estate property taxes paid for housing units in 2022:
This zip code:
1.3% ($1,809)
Michigan:
1.2% ($2,746)
Median real estate property taxes paid for housing units with mortgages in 2022: $1,861 (1.3%) Median real estate property taxes paid for housing units with no mortgage in 2022: $1,769 (1.3%)
Business Search- 14 Million verified businesses
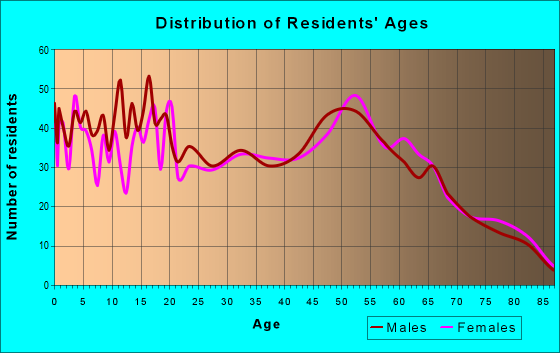
Males: 2,482
(49.5%)
Females: 2,535
(50.5%)
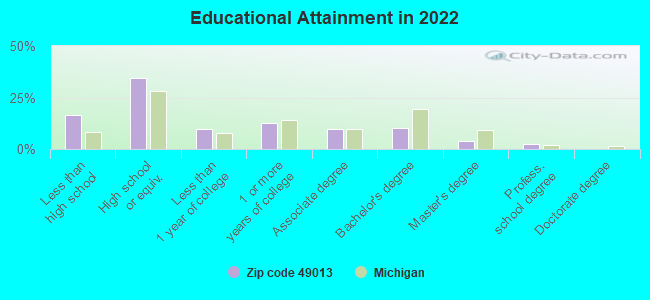
For population 25 years and over in 49013:
High school or higher: 82.4%
Bachelor's degree or higher: 16.3%
Graduate or professional degree: 6.3%
Unemployed: 3.0%
Mean travel time to work (commute): 26.0 minutes
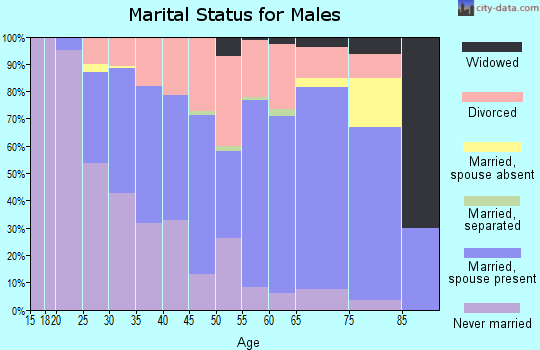
For population 15 years and over in 49013:
Never married: 30.4%
Now married: 49.7%
Separated: 1.0%
Widowed: 7.5%
Divorced: 11.4%
Zip code 49013 compared to state average:
Median house value below state average.
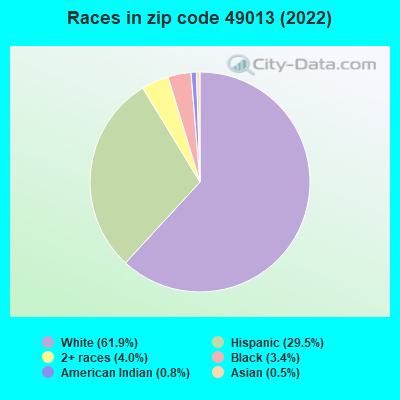
Black race population percentage significantly below state average.
Hispanic race population percentage significantly above state average.
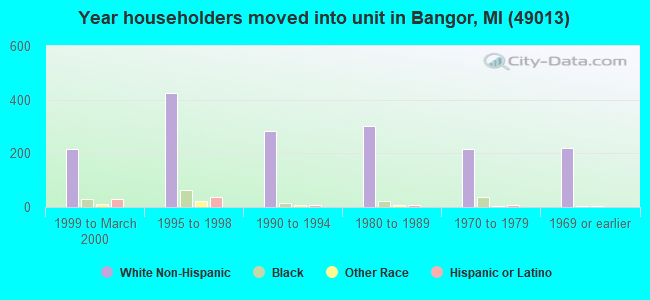
Length of stay since moving in significantly above state average.
Percentage of population with a bachelor's degree or higher below state average.
Estimated median house/condo value in 2022: $140,376
49013:
$140,376
Michigan:
$224,400
According to our research of Michigan and other state lists, there were 20 registered sex offenders living in 49013 zip code as of April 27, 2024. The ratio of all residents to sex offenders in zip code 49013 is 282 to 1. The ratio of registered sex offenders to all residents in this zip code is near the state average.
Median resident age:
This zip code:
37.9 years
Michigan median age:
40.3 years
Average household size:
This zip code:
2.7 people
Michigan:
2.4 people
Averages for the 2020 tax year for zip code 49013, filed in 2021:
Average Adjusted Gross Income (AGI) in 2020: $42,155 (Individual Income Tax Returns)
Here:
$42,155
State:
$68,945
Salary/wage: $36,492 (reported on 80.3% of returns)
Here:
$36,492
State:
$57,142
(% of AGI for various income ranges: 1087.1% for AGIs below $25k, 3375.3% for AGIs $25k-50k, 6400.8% for AGIs $50k-75k, 9262.0% for AGIs $75k-100k, 13544.5% for AGIs $100k-200k)
Taxable interest for individuals: $885 (reported on 16.8% of returns)
This zip code:
$885
Michigan:
$1,630
(% of AGI for various income ranges: 8.4% for AGIs below $25k, 11.4% for AGIs $25k-50k, 29.6% for AGIs $50k-75k, 56.0% for AGIs $75k-100k, 93.6% for AGIs $100k-200k)
Ordinary dividends: $4,010 (reported on 8.4% of returns)
Here:
$4,010
State:
$6,972
(% of AGI for various income ranges: 15.4% for AGIs below $25k, 24.0% for AGIs $25k-50k, 25.4% for AGIs $50k-75k, 148.0% for AGIs $75k-100k, 316.4% for AGIs $100k-200k)
Net capital gain/loss in AGI: +$9,132 (reported on 8.0% of returns)
Here:
+$9,132
State:
+$20,064
(% of AGI for various income ranges: 3.9% for AGIs below $25k, 12.4% for AGIs $25k-50k, 114.6% for AGIs $50k-75k, 382.0% for AGIs $75k-100k, 890.0% for AGIs $100k-200k)
Profit/loss from business: +$9,450 (reported on 12.6% of returns)
Here:
+$9,450
State:
+$11,172
(% of AGI for various income ranges: 104.2% for AGIs below $25k, 141.0% for AGIs $25k-50k, 344.6% for AGIs $50k-75k, 428.2% for AGIs $100k-200k)
Taxable individual retirement arrangement distribution: $16,419 (reported on 6.7% of returns)
49013:
$16,419
Michigan:
$19,803
(% of AGI for various income ranges: 39.3% for AGIs below $25k, 101.7% for AGIs $25k-50k, 289.6% for AGIs $50k-75k, 973.6% for AGIs $100k-200k)
Total itemized deductions: $26,275 (reported on 1.7% of returns)
Here:
$26,275
State:
$34,117
(% of AGI for various income ranges: 437.9% for AGIs $50k-75k)
Taxes paid: $5,125 (reported on 1.7% of returns)
49013:
$5,125
State:
$7,972
(% of AGI for various income ranges: 85.4% for AGIs $50k-75k)
Earned income credit: $2,360 (reported on 23.9% of returns)
Here:
$2,360
State:
$2,251
(% of AGI for various income ranges: 114.9% for AGIs below $25k, 95.2% for AGIs $25k-50k)
Percentage of individuals using paid preparers for their 2020 taxes: 94.5%
Here:
95%
State:
93%
(% for various income ranges: 93.9% for AGIs below $25k, 95.8% for AGIs $25k-50k, 97.0% for AGIs $50k-75k, 93.3% for AGIs $75k-100k, 93.8% for AGIs $100k-200k, 66.7% for AGIs over 200k)
Averages for the 2012 tax year for zip code 49013, filed in 2013:
Average Adjusted Gross Income (AGI) in 2012: $33,706 (Individual Income Tax Returns)
Here:
$33,706
State:
$55,609
Salary/wage: $30,738 (reported on 82.6% of returns)
Here:
$30,738
State:
$46,782
(% of AGI for various income ranges: 75.4% for AGIs below $25k, 79.8% for AGIs $25k-50k, 75.7% for AGIs $50k-75k, 78.0% for AGIs $75k-100k, 66.0% for AGIs $100k-200k)
Taxable interest for individuals: $927 (reported on 22.0% of returns)
This zip code:
$927
Michigan:
$1,491
(% of AGI for various income ranges: 0.6% for AGIs below $25k, 0.6% for AGIs $25k-50k, 0.6% for AGIs $50k-75k, 0.4% for AGIs $75k-100k, 0.9% for AGIs $100k-200k)
Ordinary dividends: $2,942 (reported on 11.0% of returns)
Here:
$2,942
State:
$6,225
(% of AGI for various income ranges: 0.7% for AGIs below $25k, 0.4% for AGIs $25k-50k, 0.6% for AGIs $50k-75k, 0.7% for AGIs $75k-100k, 2.5% for AGIs $100k-200k)
Net capital gain/loss in AGI: +$1,594 (reported on 7.8% of returns)
Here:
+$1,594
State:
+$9,326
(% of AGI for various income ranges: 0.4% for AGIs $50k-75k, 1.9% for AGIs $75k-100k, 0.1% for AGIs $100k-200k)
Profit/loss from business: +$6,928 (reported on 13.3% of returns)
Here:
+$6,928
State:
+$11,523
(% of AGI for various income ranges: 7.2% for AGIs below $25k, 2.3% for AGIs $25k-50k, 3.0% for AGIs $50k-75k, 1.2% for AGIs $75k-100k)
Taxable individual retirement arrangement distribution: $13,810 (reported on 9.6% of returns)
49013:
$13,810
Michigan:
$15,298
(% of AGI for various income ranges: 3.5% for AGIs below $25k, 2.7% for AGIs $25k-50k, 4.9% for AGIs $50k-75k, 8.2% for AGIs $100k-200k)
Total itemized deductions: $15,965 (25% of AGI, reported on 15.6% of returns)
Here:
$15,965
State:
$21,628
Here:
24.6% of AGI
State:
18.4% of AGI
(% of AGI for various income ranges: 5.0% for AGIs below $25k, 6.7% for AGIs $25k-50k, 6.7% for AGIs $50k-75k, 9.0% for AGIs $75k-100k, 10.2% for AGIs $100k-200k)
Charity contributions: $3,605 (reported on 10.1% of returns)
Here:
$3,605
State:
$4,225
(% of AGI for various income ranges: 0.4% for AGIs below $25k, 0.8% for AGIs $25k-50k, 1.2% for AGIs $50k-75k, 1.4% for AGIs $75k-100k, 1.9% for AGIs $100k-200k)
Taxes paid: $4,850 (reported on 15.6% of returns)
49013:
$4,850
State:
$8,327
(% of AGI for various income ranges: 1.2% for AGIs below $25k, 1.6% for AGIs $25k-50k, 1.9% for AGIs $50k-75k, 3.0% for AGIs $75k-100k, 4.0% for AGIs $100k-200k)
Earned income credit: $2,384 (reported on 28.4% of returns)
Here:
$2,384
State:
$2,306
(% of AGI for various income ranges: 8.9% for AGIs below $25k, 1.4% for AGIs $25k-50k)
Percentage of individuals using paid preparers for their 2012 taxes: 62.4%
Here:
62%
State:
57%
(% for various income ranges: 60.5% for AGIs below $25k, 63.6% for AGIs $25k-50k, 69.2% for AGIs $50k-75k, 61.5% for AGIs $75k-100k, 60.0% for AGIs $100k-200k)
Averages for the 2004 tax year for zip code 49013, filed in 2005:
Average Adjusted Gross Income (AGI) in 2004: $29,420 (Individual Income Tax Returns)
Here:
$29,420
State:
$48,204
Salary/wage: $27,614 (reported on 83.8% of returns)
Here:
$27,614
State:
$42,791
(% of AGI for various income ranges: 94.0% for AGIs below $10k, 78.1% for AGIs $10k-25k, 79.7% for AGIs $25k-50k, 83.7% for AGIs $50k-75k, 79.3% for AGIs $75k-100k, 60.2% for AGIs over 100k)
Taxable interest for individuals: $1,265 (reported on 31.9% of returns)
This zip code:
$1,265
Michigan:
$1,725
(% of AGI for various income ranges: 4.6% for AGIs below $10k, 1.8% for AGIs $10k-25k, 1.2% for AGIs $25k-50k, 1.6% for AGIs $50k-75k, 0.7% for AGIs $75k-100k, 0.6% for AGIs over 100k)
Taxable dividends: $1,486 (reported on 13.3% of returns)
Here:
$1,486
State:
$3,420
(% of AGI for various income ranges: 2.2% for AGIs below $10k, 0.7% for AGIs $10k-25k, 0.7% for AGIs $25k-50k, 0.4% for AGIs $50k-75k, 0.6% for AGIs $75k-100k, 0.9% for AGIs over 100k)
Net capital gain/loss: +$3,332 (reported on 10.2% of returns)
Here:
+$3,332
State:
+$8,532
(% of AGI for various income ranges: -2.1% for AGIs below $10k, 0.6% for AGIs $10k-25k, 0.4% for AGIs $25k-50k, 1.0% for AGIs $50k-75k, 1.3% for AGIs $75k-100k, 5.4% for AGIs over 100k)
Profit/loss from business: +$6,432 (reported on 15.7% of returns)
Here:
+$6,432
State:
+$9,547
(% of AGI for various income ranges: 5.1% for AGIs below $10k, 5.6% for AGIs $10k-25k, 2.6% for AGIs $25k-50k, 2.0% for AGIs $50k-75k, 1.6% for AGIs $75k-100k, 7.2% for AGIs over 100k)
IRA payment deduction: $2,841 (reported on 2.0% of returns)
49013:
$2,841
Michigan:
$2,875
Total itemized deductions: $14,163 (24% of AGI, reported on 19.9% of returns)
Here:
$14,163
State:
$18,509
Here:
24.5% of AGI
State:
20.7% of AGI
(% of AGI for various income ranges: 6.4% for AGIs below $10k, 5.6% for AGIs $10k-25k, 9.0% for AGIs $25k-50k, 11.2% for AGIs $50k-75k, 10.9% for AGIs $75k-100k, 13.3% for AGIs over 100k)
Charity contributions deductions: $2,543 (4% of AGI, reported on 14.7% of returns)
Here:
$2,543
State:
$3,365
Here:
4.1% of AGI
State:
3.6% of AGI
(% of AGI for various income ranges: 0.4% for AGIs $10k-25k, 1.1% for AGIs $25k-50k, 1.6% for AGIs $50k-75k, 1.6% for AGIs $75k-100k, 2.3% for AGIs over 100k)
Total tax: $3,570 (reported on 65.0% of returns)
49013:
$3,570
State:
$7,691
(% of AGI for various income ranges: 3.4% for AGIs below $10k, 3.8% for AGIs $10k-25k, 6.2% for AGIs $25k-50k, 8.3% for AGIs $50k-75k, 10.5% for AGIs $75k-100k, 16.7% for AGIs over 100k)
Earned income credit: $1,819 (reported on 24.7% of returns)
Here:
$1,819
State:
$1,737
Percentage of individuals using paid preparers for their 2004 taxes: 62.6%
Here:
63%
State:
60%
(% for various income ranges: 59.8% for AGIs below $10k, 62.3% for AGIs $10k-25k, 65.8% for AGIs $25k-50k, 60.9% for AGIs $50k-75k, 59.3% for AGIs $75k-100k, 75.0% for AGIs over 100k)
Household received Food Stamps/SNAP in the past 12 months: 342 Household did not receive Food Stamps/SNAP in the past 12 months: 1,468
Women who had a birth in the past 12 months: 57 (22 now married, 33 unmarried) Women who did not have a birth in the past 12 months: 997 (511 now married, 482 unmarried)
Housing units in zip code 49013 with a mortgage: 792 (55 second mortgage, 44 both second mortgage and home equity loan) Houses without a mortgage: 25
Median monthly owner costs for units with a mortgage: $1,126 Median monthly owner costs for units without a mortgage: $504
Residents with income below the poverty level in 2022:
This zip code:
21.0%
Whole state:
13.4%
Residents with income below 50% of the poverty level in 2022:
This zip code:
15.4%
Whole state:
6.9%
Median number of rooms in houses and condos:
Here:
6.0
State:
6.5
Median number of rooms in apartments:
Here:
4.2
State:
4.3
Notable locations in this zip code not listed on our city pages
Notable locations in zip code 49013: Circle Y Ranch Bible Camp (A), Bangor Station (B), Bangor Branch Library (C), Bangor City Hall (D), Bangor Community Fire Department (E), Bangor Police Department (F), Coloma Emergency Medical Services Medical Transport Station 2 (G). Display/hide their locations on the map
Churches in zip code 49013 include: Sacred Heart Church (A), New Jerusalem Church (B), Seventh Day Adventist Church (C), Simpson United Methodist Church (D), Family Gospel Chapel (E), Free Methodist Church (F), Church of Christ (G), First Congregational Church (H), Trinity Evangelical Lutheran Church (I). Display/hide their locations on the map
Cemeteries: Southard Cemetery (1), Hoppin Cemetery (2), Arlington Hill Cemetery (3), Taylor Cemetery (4), Thomas Cemetery (5), Monk Cemetery (6). Display/hide their locations on the map
Lakes: Van Auken Lake (A), Mud Lake (B), Mill Pond (C), Merriman Lake (D), Scott Lakes (E), Lake Fourteen (F), Donovan Lake (G), South Scott Lake (H). Display/hide their locations on the map
794 married couples with children.
259 single-parent households (54 men, 205 women).
81.0% of residents of 49013 zip code speak English at home.
17.9% of residents speak Spanish at home (62% very well, 16% well, 16% not well, 5% not at all).
0.2% of residents speak other Indo-European language at home (90% very well, 10% well).
0.8% of residents speak Asian or Pacific Island language at home (64% very well, 17% well, 19% not well).
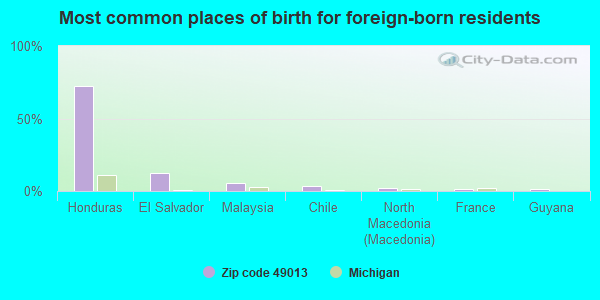
Foreign born population: 492 (9.8%) (45.5% of them are naturalized citizens)
This zip code:
9.8%
Whole state:
6.9%
73%Honduras
13%El Salvador
5%Malaysia
4%Chile
2%North Macedonia (Macedonia)
1%France
1%Guyana
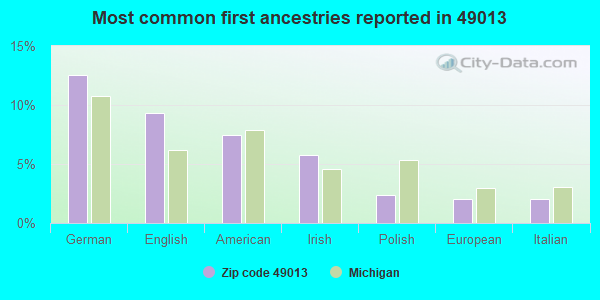
13%German
9%English
7%American
6%Irish
2%Polish
2%European
2%Italian
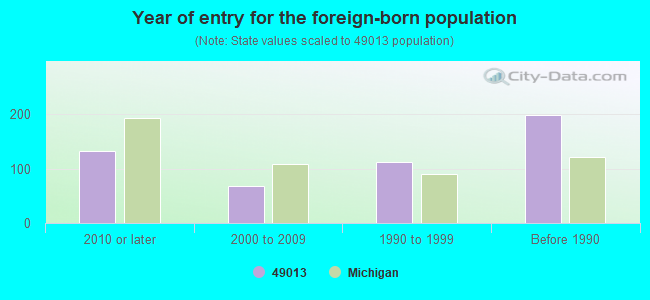
Year of entry for the foreign-born population
1332010 or later
692000 to 2009
1121990 to 1999
199Before 1990
Major facilities with environmental interests located in this zip code:
BANGOR INDUSTRIES INCORPORATED (101 RICHARD BEER MEMORIAL DR. in BANGOR, MI)
AIR MINOR (AIRS/AFS) (Integrated Compliance Information System) - ICIS-05-1988-0083, FORMAL ENFORCEMENT ACTION CRITERIA AND HAZARDOUS AIR POLLUTANT INVENTORY (Inventory of air pollution sources) HAZARDOUS WASTE BIENNIAL REPORTER (Resource Conservation and Recovery Act (tracking hazardous waste)) (Resource Conservation and Recovery Act (tracking hazardous waste)) TRI REPORTER (Tracking of toxic chemicals releasing facilities) Business SIC and NAICS classification: ELECTROPLATING, PLATING, POLISHING, ANODIZING, AND COLORING
ALTERNATIVE HIGH SCHOOL (799 W. ARLINGTON STREET in BANGOR, MI)
(National Center for Education Statistics) - STATE ID-07220 Organizations: BANGOR PUBLIC SCHOOLS (VAN BUREN) (SCHOOL DISTRICT)
BANGOR HIGH SCHOOL (801 W. ARLINGTON STREET in BANGOR, MI)
(National Center for Education Statistics) - STATE ID-00189 Organizations: BANGOR PUBLIC SCHOOLS (VAN BUREN) (SCHOOL DISTRICT)
BANGOR MIDDLE SCHOOL (803 W. ARLINGTON STREET in BANGOR, MI)
(National Center for Education Statistics) - STATE ID-04961 Organizations: BANGOR PUBLIC SCHOOLS (VAN BUREN) (SCHOOL DISTRICT)
BANGOR PRIMARY SCHOOL (12 N. WALNUT STREET in BANGOR, MI)
(National Center for Education Statistics) - STATE ID-06949 Organizations: BANGOR PUBLIC SCHOOLS (VAN BUREN) (SCHOOL DISTRICT)
BANGOR ELECTRONICS (10 INDUSTRIAL PARK DR in BANGOR, MI)
National Pollutant Discharge Elimination System NON-MAJOR (Tracking pollutant discharge elimination systems) - permit
BANGOR PUBLIC SCHOOLS (309 S WALNUT in BANGOR, MI)
(Resource Conservation and Recovery Act (tracking hazardous waste))
MI DEPT/ENVIRONMENTAL QUALITY (901 N CENTER STREET in BANGOR, MI)
Large Quantity Generators, more that 1000 kg of hazardous waste/month (Resource Conservation and Recovery Act (tracking hazardous waste)) Organizations: US EPA/MDEQ (CONTACT/OPERATOR)
MI DEPT/STATE POLICE (16TH & 60TH ST in BANGOR, MI)
(Resource Conservation and Recovery Act (tracking hazardous waste)) Alternative names: MI DEPT/STATE POLICE (E)
MI DEPT/STATE POLICE (T01S R17W SEC 1 SOUTH HAVEN TW in BANGOR, MI)
(Resource Conservation and Recovery Act (tracking hazardous waste))
GETMAN CORP (59750 34TH AVE in BANGOR, MI)
Small Quantity Generators, between 100 kg and 1000 kg of hazardous waste/month (Resource Conservation and Recovery Act (tracking hazardous waste)) Business NAICS classification: MINING MACHINERY AND EQUIPMENT MANUFACTURING. Organizations: DANA GETMAN (CONTACT/OPERATOR)
GTE NORTH INC BANGOR (55 1/2 ST AND 28TH ST in BANGOR, MI)
(Resource Conservation and Recovery Act (tracking hazardous waste))
BANGOR PLASTICS INC (809 WASHINGTON ST in BANGOR, MI)
Conditionally Exempt Small Quantity Generators, less than 100 kg/month of hazardous waste (Resource Conservation and Recovery Act (tracking hazardous waste)) - notification Organizations: WOKECK GF (CONTACT/OWNER)
Housing units lacking complete plumbing facilities: 2.1% Housing units lacking complete kitchen facilities: 1.9%
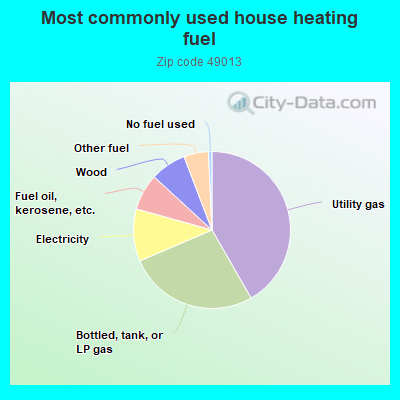
41.8%Utility gas
26.9%Bottled, tank, or LP gas
10.8%Electricity
7.5%Fuel oil, kerosene, etc.
7.4%Wood
5.1%Other fuel
0.7%No fuel used
Population in 1990: 8,743.
Place of birth for U.S.-born residents:
This state: 3,251
Northeast: 31
Midwest: 666
South: 431
West: 111
59% of the 49013 zip code residents lived in the same house 5 years ago. Out of people who lived in different houses, 67% lived in this county. Out of people who lived in different counties, 50% lived in Michigan.
94% of the 49013 zip code residents lived in the same house 1 year ago. Out of people who lived in different houses, 59% moved from this county. Out of people who lived in different houses, 19% moved from different county within same state. Out of people who lived in different houses, 20% moved from different state. Out of people who lived in different houses, 3% moved from abroad.
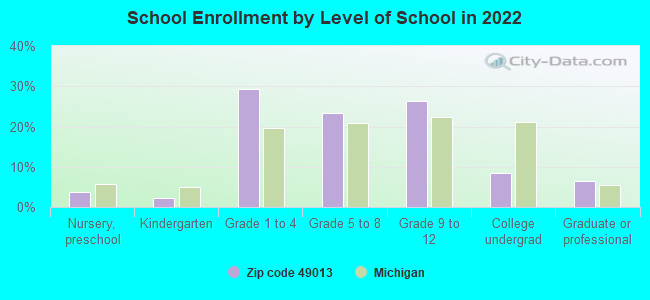
Private vs. public school enrollment:
Students in private schools in grades 1 to 8 (elementary and middle school): 61
Here:
8.9%
Michigan:
12.4%
Students in private schools in grades 9 to 12 (high school): 35
Here:
10.3%
Michigan:
9.8%
Students in private undergraduate colleges: 24
Here:
22.1%
Michigan:
14.9%
Occupation by median earnings in the past 12 months ($)
163,793Architecture and engineering occupations
77,356Arts, design, entertainment, sports, and media occupations
70,441Law enforcement workers including supervisors
64,415Transportation occupations
54,013Health diagnosing and treating practitioners and other technical occupations
53,610Life, physical, and social science occupations
Companies with federal contracts located in this zip code:
BANGOR PLASTICS INC (809 WASHINGTON ST in BANGOR, MI; small business) : $272,111 in 5 contractsfrom 2000 to 2005
Contracts for Plastics Fabricated Materials, Rubber Fabricated Materials, Rubber and Plastics Working Machinery by Navy Signed by year:2000: $42,351; 2001: $0; 2002: $30,840; 2003: $0; 2004: $93,500; 2005: $105,420; 2006: $0.
Biggest contracts:
$93,500 with Navy for Plastics Fabricated Materials. Signed on 2004-04-28. Completion date: 2004-11-30.
$92,400, same as above.Signed on 2005-09-12. Completion date: 2006-07-31.
$42,351 with Navy for Rubber Fabricated Materials. Signed on 2000-03-15. Completion date: 2000-06-14.
$30,840 with Navy for Rubber and Plastics Working Machinery. Signed on 2002-02-20. Completion date: 2002-06-14.
Top industries in this zip code by the number of employees in 2005:
2002 - 2018 National Fire Incident Reporting System (NFIRS) incidents
According to the data from the years 2002 - 2018 the average number of fire incidents per year is 34. The highest number of reported fires - 59 took place in 2011, and the least - 13 in 2015. The data has a declining trend.
When looking into fire subcategories, the most reports belonged to: Structure Fires (62.3%), and Outside Fires (22.8%).
Fire incident types reported to NFIRS in Zip Code 49013
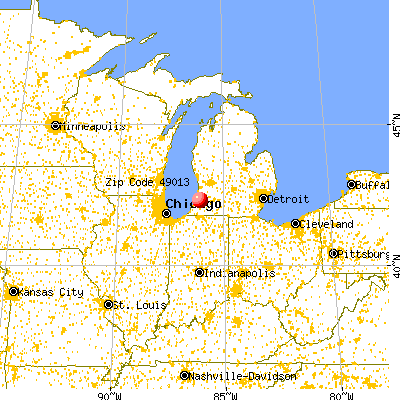


 Nearest zip codes: 49027, 49064, 49056, 49057, 49090, 49026.


 According to the data from the years 2002 - 2018 the average number of fire incidents per year is 34. The highest number of reported fires - 59 took place in 2011, and the least - 13 in 2015. The data has a declining trend.
 When looking into fire subcategories, the most reports belonged to: Structure Fires (62.3%), and Outside Fires (22.8%).