South Haven, Michigan Submit your own pictures of this city and show them to the world
OSM Map
General Map
Google Map
MSN Map
OSM Map
General Map
Google Map
MSN Map
OSM Map
General Map
Google Map
MSN Map
OSM Map
General Map
Google Map
MSN Map
Please wait while loading the map...
Population in 2022: 3,988 (100% urban, 0% rural). Population change since 2000: -20.6%Males: 1,818 Females: 2,170
March 2022 cost of living index in South Haven: 84.9 (less than average, U.S. average is 100) Percentage of residents living in poverty in 2022: 20.7%for White Non-Hispanic residents , 61.1% for Black residents , 74.4% for Hispanic or Latino residents , 53.3% for American Indian residents , 74.3% for two or more races residents )
Profiles of local businesses
Business Search - 14 Million verified businesses
Data:
Median household income ($)
Median household income (% change since 2000)
Household income diversity
Ratio of average income to average house value (%)
Ratio of average income to average rent
Median household income ($) - White
Median household income ($) - Black or African American
Median household income ($) - Asian
Median household income ($) - Hispanic or Latino
Median household income ($) - American Indian and Alaska Native
Median household income ($) - Multirace
Median household income ($) - Other Race
Median household income for houses/condos with a mortgage ($)
Median household income for apartments without a mortgage ($)
Races - White alone (%)
Races - White alone (% change since 2000)
Races - Black alone (%)
Races - Black alone (% change since 2000)
Races - American Indian alone (%)
Races - American Indian alone (% change since 2000)
Races - Asian alone (%)
Races - Asian alone (% change since 2000)
Races - Hispanic (%)
Races - Hispanic (% change since 2000)
Races - Native Hawaiian and Other Pacific Islander alone (%)
Races - Native Hawaiian and Other Pacific Islander alone (% change since 2000)
Races - Two or more races (%)
Races - Two or more races (% change since 2000)
Races - Other race alone (%)
Races - Other race alone (% change since 2000)
Racial diversity
Unemployment (%)
Unemployment (% change since 2000)
Unemployment (%) - White
Unemployment (%) - Black or African American
Unemployment (%) - Asian
Unemployment (%) - Hispanic or Latino
Unemployment (%) - American Indian and Alaska Native
Unemployment (%) - Multirace
Unemployment (%) - Other Race
Population density (people per square mile)
Population - Males (%)
Population - Females (%)
Population - Males (%) - White
Population - Males (%) - Black or African American
Population - Males (%) - Asian
Population - Males (%) - Hispanic or Latino
Population - Males (%) - American Indian and Alaska Native
Population - Males (%) - Multirace
Population - Males (%) - Other Race
Population - Females (%) - White
Population - Females (%) - Black or African American
Population - Females (%) - Asian
Population - Females (%) - Hispanic or Latino
Population - Females (%) - American Indian and Alaska Native
Population - Females (%) - Multirace
Population - Females (%) - Other Race
Coronavirus confirmed cases (Apr 27, 2024)
Deaths caused by coronavirus (Apr 27, 2024)
Coronavirus confirmed cases (per 100k population) (Apr 27, 2024)
Deaths caused by coronavirus (per 100k population) (Apr 27, 2024)
Daily increase in number of cases (Apr 27, 2024)
Weekly increase in number of cases (Apr 27, 2024)
Cases doubled (in days) (Apr 27, 2024)
Hospitalized patients (Apr 18, 2022)
Negative test results (Apr 18, 2022)
Total test results (Apr 18, 2022)
COVID Vaccine doses distributed (per 100k population) (Sep 19, 2023)
COVID Vaccine doses administered (per 100k population) (Sep 19, 2023)
COVID Vaccine doses distributed (Sep 19, 2023)
COVID Vaccine doses administered (Sep 19, 2023)
Likely homosexual households (%)
Likely homosexual households (% change since 2000)
Likely homosexual households - Lesbian couples (%)
Likely homosexual households - Lesbian couples (% change since 2000)
Likely homosexual households - Gay men (%)
Likely homosexual households - Gay men (% change since 2000)
Cost of living index
Median gross rent ($)
Median contract rent ($)
Median monthly housing costs ($)
Median house or condo value ($)
Median house or condo value ($ change since 2000)
Mean house or condo value by units in structure - 1, detached ($)
Mean house or condo value by units in structure - 1, attached ($)
Mean house or condo value by units in structure - 2 ($)
Mean house or condo value by units in structure by units in structure - 3 or 4 ($)
Mean house or condo value by units in structure - 5 or more ($)
Mean house or condo value by units in structure - Boat, RV, van, etc. ($)
Mean house or condo value by units in structure - Mobile home ($)
Median house or condo value ($) - White
Median house or condo value ($) - Black or African American
Median house or condo value ($) - Asian
Median house or condo value ($) - Hispanic or Latino
Median house or condo value ($) - American Indian and Alaska Native
Median house or condo value ($) - Multirace
Median house or condo value ($) - Other Race
Median resident age
Resident age diversity
Median resident age - Males
Median resident age - Females
Median resident age - White
Median resident age - Black or African American
Median resident age - Asian
Median resident age - Hispanic or Latino
Median resident age - American Indian and Alaska Native
Median resident age - Multirace
Median resident age - Other Race
Median resident age - Males - White
Median resident age - Males - Black or African American
Median resident age - Males - Asian
Median resident age - Males - Hispanic or Latino
Median resident age - Males - American Indian and Alaska Native
Median resident age - Males - Multirace
Median resident age - Males - Other Race
Median resident age - Females - White
Median resident age - Females - Black or African American
Median resident age - Females - Asian
Median resident age - Females - Hispanic or Latino
Median resident age - Females - American Indian and Alaska Native
Median resident age - Females - Multirace
Median resident age - Females - Other Race
Commute - mean travel time to work (minutes)
Travel time to work - Less than 5 minutes (%)
Travel time to work - Less than 5 minutes (% change since 2000)
Travel time to work - 5 to 9 minutes (%)
Travel time to work - 5 to 9 minutes (% change since 2000)
Travel time to work - 10 to 19 minutes (%)
Travel time to work - 10 to 19 minutes (% change since 2000)
Travel time to work - 20 to 29 minutes (%)
Travel time to work - 20 to 29 minutes (% change since 2000)
Travel time to work - 30 to 39 minutes (%)
Travel time to work - 30 to 39 minutes (% change since 2000)
Travel time to work - 40 to 59 minutes (%)
Travel time to work - 40 to 59 minutes (% change since 2000)
Travel time to work - 60 to 89 minutes (%)
Travel time to work - 60 to 89 minutes (% change since 2000)
Travel time to work - 90 or more minutes (%)
Travel time to work - 90 or more minutes (% change since 2000)
Marital status - Never married (%)
Marital status - Now married (%)
Marital status - Separated (%)
Marital status - Widowed (%)
Marital status - Divorced (%)
Median family income ($)
Median family income (% change since 2000)
Median non-family income ($)
Median non-family income (% change since 2000)
Median per capita income ($)
Median per capita income (% change since 2000)
Median family income ($) - White
Median family income ($) - Black or African American
Median family income ($) - Asian
Median family income ($) - Hispanic or Latino
Median family income ($) - American Indian and Alaska Native
Median family income ($) - Multirace
Median family income ($) - Other Race
Median year house/condo built
Median year apartment built
Year house built - Built 2005 or later (%)
Year house built - Built 2000 to 2004 (%)
Year house built - Built 1990 to 1999 (%)
Year house built - Built 1980 to 1989 (%)
Year house built - Built 1970 to 1979 (%)
Year house built - Built 1960 to 1969 (%)
Year house built - Built 1950 to 1959 (%)
Year house built - Built 1940 to 1949 (%)
Year house built - Built 1939 or earlier (%)
Average household size
Household density (households per square mile)
Average household size - White
Average household size - Black or African American
Average household size - Asian
Average household size - Hispanic or Latino
Average household size - American Indian and Alaska Native
Average household size - Multirace
Average household size - Other Race
Occupied housing units (%)
Vacant housing units (%)
Owner occupied housing units (%)
Renter occupied housing units (%)
Vacancy status - For rent (%)
Vacancy status - For sale only (%)
Vacancy status - Rented or sold, not occupied (%)
Vacancy status - For seasonal, recreational, or occasional use (%)
Vacancy status - For migrant workers (%)
Vacancy status - Other vacant (%)
Residents with income below the poverty level (%)
Residents with income below 50% of the poverty level (%)
Children below poverty level (%)
Poor families by family type - Married-couple family (%)
Poor families by family type - Male, no wife present (%)
Poor families by family type - Female, no husband present (%)
Poverty status for native-born residents (%)
Poverty status for foreign-born residents (%)
Poverty among high school graduates not in families (%)
Poverty among people who did not graduate high school not in families (%)
Residents with income below the poverty level (%) - White
Residents with income below the poverty level (%) - Black or African American
Residents with income below the poverty level (%) - Asian
Residents with income below the poverty level (%) - Hispanic or Latino
Residents with income below the poverty level (%) - American Indian and Alaska Native
Residents with income below the poverty level (%) - Multirace
Residents with income below the poverty level (%) - Other Race
Air pollution - Air Quality Index (AQI)
Air pollution - CO
Air pollution - NO2
Air pollution - SO2
Air pollution - Ozone
Air pollution - PM10
Air pollution - PM25
Air pollution - Pb
Crime - Murders per 100,000 population
Crime - Rapes per 100,000 population
Crime - Robberies per 100,000 population
Crime - Assaults per 100,000 population
Crime - Burglaries per 100,000 population
Crime - Thefts per 100,000 population
Crime - Auto thefts per 100,000 population
Crime - Arson per 100,000 population
Crime - City-data.com crime index
Crime - Violent crime index
Crime - Property crime index
Crime - Murders per 100,000 population (5 year average)
Crime - Rapes per 100,000 population (5 year average)
Crime - Robberies per 100,000 population (5 year average)
Crime - Assaults per 100,000 population (5 year average)
Crime - Burglaries per 100,000 population (5 year average)
Crime - Thefts per 100,000 population (5 year average)
Crime - Auto thefts per 100,000 population (5 year average)
Crime - Arson per 100,000 population (5 year average)
Crime - City-data.com crime index (5 year average)
Crime - Violent crime index (5 year average)
Crime - Property crime index (5 year average)
1996 Presidential Elections Results (%) - Democratic Party (Clinton)
1996 Presidential Elections Results (%) - Republican Party (Dole)
1996 Presidential Elections Results (%) - Other
2000 Presidential Elections Results (%) - Democratic Party (Gore)
2000 Presidential Elections Results (%) - Republican Party (Bush)
2000 Presidential Elections Results (%) - Other
2004 Presidential Elections Results (%) - Democratic Party (Kerry)
2004 Presidential Elections Results (%) - Republican Party (Bush)
2004 Presidential Elections Results (%) - Other
2008 Presidential Elections Results (%) - Democratic Party (Obama)
2008 Presidential Elections Results (%) - Republican Party (McCain)
2008 Presidential Elections Results (%) - Other
2012 Presidential Elections Results (%) - Democratic Party (Obama)
2012 Presidential Elections Results (%) - Republican Party (Romney)
2012 Presidential Elections Results (%) - Other
2016 Presidential Elections Results (%) - Democratic Party (Clinton)
2016 Presidential Elections Results (%) - Republican Party (Trump)
2016 Presidential Elections Results (%) - Other
2020 Presidential Elections Results (%) - Democratic Party (Biden)
2020 Presidential Elections Results (%) - Republican Party (Trump)
2020 Presidential Elections Results (%) - Other
Ancestries Reported - Arab (%)
Ancestries Reported - Czech (%)
Ancestries Reported - Danish (%)
Ancestries Reported - Dutch (%)
Ancestries Reported - English (%)
Ancestries Reported - French (%)
Ancestries Reported - French Canadian (%)
Ancestries Reported - German (%)
Ancestries Reported - Greek (%)
Ancestries Reported - Hungarian (%)
Ancestries Reported - Irish (%)
Ancestries Reported - Italian (%)
Ancestries Reported - Lithuanian (%)
Ancestries Reported - Norwegian (%)
Ancestries Reported - Polish (%)
Ancestries Reported - Portuguese (%)
Ancestries Reported - Russian (%)
Ancestries Reported - Scotch-Irish (%)
Ancestries Reported - Scottish (%)
Ancestries Reported - Slovak (%)
Ancestries Reported - Subsaharan African (%)
Ancestries Reported - Swedish (%)
Ancestries Reported - Swiss (%)
Ancestries Reported - Ukrainian (%)
Ancestries Reported - United States (%)
Ancestries Reported - Welsh (%)
Ancestries Reported - West Indian (%)
Ancestries Reported - Other (%)
Educational Attainment - No schooling completed (%)
Educational Attainment - Less than high school (%)
Educational Attainment - High school or equivalent (%)
Educational Attainment - Less than 1 year of college (%)
Educational Attainment - 1 or more years of college (%)
Educational Attainment - Associate degree (%)
Educational Attainment - Bachelor's degree (%)
Educational Attainment - Master's degree (%)
Educational Attainment - Professional school degree (%)
Educational Attainment - Doctorate degree (%)
School Enrollment - Nursery, preschool (%)
School Enrollment - Kindergarten (%)
School Enrollment - Grade 1 to 4 (%)
School Enrollment - Grade 5 to 8 (%)
School Enrollment - Grade 9 to 12 (%)
School Enrollment - College undergrad (%)
School Enrollment - Graduate or professional (%)
School Enrollment - Not enrolled in school (%)
School enrollment - Public schools (%)
School enrollment - Private schools (%)
School enrollment - Not enrolled (%)
Median number of rooms in houses and condos
Median number of rooms in apartments
Housing units lacking complete plumbing facilities (%)
Housing units lacking complete kitchen facilities (%)
Density of houses
Urban houses (%)
Rural houses (%)
Households with people 60 years and over (%)
Households with people 65 years and over (%)
Households with people 75 years and over (%)
Households with one or more nonrelatives (%)
Households with no nonrelatives (%)
Population in households (%)
Family households (%)
Nonfamily households (%)
Population in families (%)
Family households with own children (%)
Median number of bedrooms in owner occupied houses
Mean number of bedrooms in owner occupied houses
Median number of bedrooms in renter occupied houses
Mean number of bedrooms in renter occupied houses
Median number of vehichles in owner occupied houses
Mean number of vehichles in owner occupied houses
Median number of vehichles in renter occupied houses
Mean number of vehichles in renter occupied houses
Mortgage status - with mortgage (%)
Mortgage status - with second mortgage (%)
Mortgage status - with home equity loan (%)
Mortgage status - with both second mortgage and home equity loan (%)
Mortgage status - without a mortgage (%)
Average family size
Average family size - White
Average family size - Black or African American
Average family size - Asian
Average family size - Hispanic or Latino
Average family size - American Indian and Alaska Native
Average family size - Multirace
Average family size - Other Race
Geographical mobility - Same house 1 year ago (%)
Geographical mobility - Moved within same county (%)
Geographical mobility - Moved from different county within same state (%)
Geographical mobility - Moved from different state (%)
Geographical mobility - Moved from abroad (%)
Place of birth - Born in state of residence (%)
Place of birth - Born in other state (%)
Place of birth - Native, outside of US (%)
Place of birth - Foreign born (%)
Housing units in structures - 1, detached (%)
Housing units in structures - 1, attached (%)
Housing units in structures - 2 (%)
Housing units in structures - 3 or 4 (%)
Housing units in structures - 5 to 9 (%)
Housing units in structures - 10 to 19 (%)
Housing units in structures - 20 to 49 (%)
Housing units in structures - 50 or more (%)
Housing units in structures - Mobile home (%)
Housing units in structures - Boat, RV, van, etc. (%)
House/condo owner moved in on average (years ago)
Renter moved in on average (years ago)
Year householder moved into unit - Moved in 1999 to March 2000 (%)
Year householder moved into unit - Moved in 1995 to 1998 (%)
Year householder moved into unit - Moved in 1990 to 1994 (%)
Year householder moved into unit - Moved in 1980 to 1989 (%)
Year householder moved into unit - Moved in 1970 to 1979 (%)
Year householder moved into unit - Moved in 1969 or earlier (%)
Means of transportation to work - Drove car alone (%)
Means of transportation to work - Carpooled (%)
Means of transportation to work - Public transportation (%)
Means of transportation to work - Bus or trolley bus (%)
Means of transportation to work - Streetcar or trolley car (%)
Means of transportation to work - Subway or elevated (%)
Means of transportation to work - Railroad (%)
Means of transportation to work - Ferryboat (%)
Means of transportation to work - Taxicab (%)
Means of transportation to work - Motorcycle (%)
Means of transportation to work - Bicycle (%)
Means of transportation to work - Walked (%)
Means of transportation to work - Other means (%)
Working at home (%)
Industry diversity
Most Common Industries - Agriculture, forestry, fishing and hunting, and mining (%)
Most Common Industries - Agriculture, forestry, fishing and hunting (%)
Most Common Industries - Mining, quarrying, and oil and gas extraction (%)
Most Common Industries - Construction (%)
Most Common Industries - Manufacturing (%)
Most Common Industries - Wholesale trade (%)
Most Common Industries - Retail trade (%)
Most Common Industries - Transportation and warehousing, and utilities (%)
Most Common Industries - Transportation and warehousing (%)
Most Common Industries - Utilities (%)
Most Common Industries - Information (%)
Most Common Industries - Finance and insurance, and real estate and rental and leasing (%)
Most Common Industries - Finance and insurance (%)
Most Common Industries - Real estate and rental and leasing (%)
Most Common Industries - Professional, scientific, and management, and administrative and waste management services (%)
Most Common Industries - Professional, scientific, and technical services (%)
Most Common Industries - Management of companies and enterprises (%)
Most Common Industries - Administrative and support and waste management services (%)
Most Common Industries - Educational services, and health care and social assistance (%)
Most Common Industries - Educational services (%)
Most Common Industries - Health care and social assistance (%)
Most Common Industries - Arts, entertainment, and recreation, and accommodation and food services (%)
Most Common Industries - Arts, entertainment, and recreation (%)
Most Common Industries - Accommodation and food services (%)
Most Common Industries - Other services, except public administration (%)
Most Common Industries - Public administration (%)
Occupation diversity
Most Common Occupations - Management, business, science, and arts occupations (%)
Most Common Occupations - Management, business, and financial occupations (%)
Most Common Occupations - Management occupations (%)
Most Common Occupations - Business and financial operations occupations (%)
Most Common Occupations - Computer, engineering, and science occupations (%)
Most Common Occupations - Computer and mathematical occupations (%)
Most Common Occupations - Architecture and engineering occupations (%)
Most Common Occupations - Life, physical, and social science occupations (%)
Most Common Occupations - Education, legal, community service, arts, and media occupations (%)
Most Common Occupations - Community and social service occupations (%)
Most Common Occupations - Legal occupations (%)
Most Common Occupations - Education, training, and library occupations (%)
Most Common Occupations - Arts, design, entertainment, sports, and media occupations (%)
Most Common Occupations - Healthcare practitioners and technical occupations (%)
Most Common Occupations - Health diagnosing and treating practitioners and other technical occupations (%)
Most Common Occupations - Health technologists and technicians (%)
Most Common Occupations - Service occupations (%)
Most Common Occupations - Healthcare support occupations (%)
Most Common Occupations - Protective service occupations (%)
Most Common Occupations - Fire fighting and prevention, and other protective service workers including supervisors (%)
Most Common Occupations - Law enforcement workers including supervisors (%)
Most Common Occupations - Food preparation and serving related occupations (%)
Most Common Occupations - Building and grounds cleaning and maintenance occupations (%)
Most Common Occupations - Personal care and service occupations (%)
Most Common Occupations - Sales and office occupations (%)
Most Common Occupations - Sales and related occupations (%)
Most Common Occupations - Office and administrative support occupations (%)
Most Common Occupations - Natural resources, construction, and maintenance occupations (%)
Most Common Occupations - Farming, fishing, and forestry occupations (%)
Most Common Occupations - Construction and extraction occupations (%)
Most Common Occupations - Installation, maintenance, and repair occupations (%)
Most Common Occupations - Production, transportation, and material moving occupations (%)
Most Common Occupations - Production occupations (%)
Most Common Occupations - Transportation occupations (%)
Most Common Occupations - Material moving occupations (%)
People in Group quarters - Institutionalized population (%)
People in Group quarters - Correctional institutions (%)
People in Group quarters - Federal prisons and detention centers (%)
People in Group quarters - Halfway houses (%)
People in Group quarters - Local jails and other confinement facilities (including police lockups) (%)
People in Group quarters - Military disciplinary barracks (%)
People in Group quarters - State prisons (%)
People in Group quarters - Other types of correctional institutions (%)
People in Group quarters - Nursing homes (%)
People in Group quarters - Hospitals/wards, hospices, and schools for the handicapped (%)
People in Group quarters - Hospitals/wards and hospices for chronically ill (%)
People in Group quarters - Hospices or homes for chronically ill (%)
People in Group quarters - Military hospitals or wards for chronically ill (%)
People in Group quarters - Other hospitals or wards for chronically ill (%)
People in Group quarters - Hospitals or wards for drug/alcohol abuse (%)
People in Group quarters - Mental (Psychiatric) hospitals or wards (%)
People in Group quarters - Schools, hospitals, or wards for the mentally retarded (%)
People in Group quarters - Schools, hospitals, or wards for the physically handicapped (%)
People in Group quarters - Institutions for the deaf (%)
People in Group quarters - Institutions for the blind (%)
People in Group quarters - Orthopedic wards and institutions for the physically handicapped (%)
People in Group quarters - Wards in general hospitals for patients who have no usual home elsewhere (%)
People in Group quarters - Wards in military hospitals for patients who have no usual home elsewhere (%)
People in Group quarters - Juvenile institutions (%)
People in Group quarters - Long-term care (%)
People in Group quarters - Homes for abused, dependent, and neglected children (%)
People in Group quarters - Residential treatment centers for emotionally disturbed children (%)
People in Group quarters - Training schools for juvenile delinquents (%)
People in Group quarters - Short-term care, detention or diagnostic centers for delinquent children (%)
People in Group quarters - Type of juvenile institution unknown (%)
People in Group quarters - Noninstitutionalized population (%)
People in Group quarters - College dormitories (includes college quarters off campus) (%)
People in Group quarters - Military quarters (%)
People in Group quarters - On base (%)
People in Group quarters - Barracks, unaccompanied personnel housing (UPH), (Enlisted/Officer), ;and similar group living quarters for military personnel (%)
People in Group quarters - Transient quarters for temporary residents (%)
People in Group quarters - Military ships (%)
People in Group quarters - Group homes (%)
People in Group quarters - Homes or halfway houses for drug/alcohol abuse (%)
People in Group quarters - Homes for the mentally ill (%)
People in Group quarters - Homes for the mentally retarded (%)
People in Group quarters - Homes for the physically handicapped (%)
People in Group quarters - Other group homes (%)
People in Group quarters - Religious group quarters (%)
People in Group quarters - Dormitories (%)
People in Group quarters - Agriculture workers' dormitories on farms (%)
People in Group quarters - Job Corps and vocational training facilities (%)
People in Group quarters - Other workers' dormitories (%)
People in Group quarters - Crews of maritime vessels (%)
People in Group quarters - Other nonhousehold living situations (%)
People in Group quarters - Other noninstitutional group quarters (%)
Residents speaking English at home (%)
Residents speaking English at home - Born in the United States (%)
Residents speaking English at home - Native, born elsewhere (%)
Residents speaking English at home - Foreign born (%)
Residents speaking Spanish at home (%)
Residents speaking Spanish at home - Born in the United States (%)
Residents speaking Spanish at home - Native, born elsewhere (%)
Residents speaking Spanish at home - Foreign born (%)
Residents speaking other language at home (%)
Residents speaking other language at home - Born in the United States (%)
Residents speaking other language at home - Native, born elsewhere (%)
Residents speaking other language at home - Foreign born (%)
Class of Workers - Employee of private company (%)
Class of Workers - Self-employed in own incorporated business (%)
Class of Workers - Private not-for-profit wage and salary workers (%)
Class of Workers - Local government workers (%)
Class of Workers - State government workers (%)
Class of Workers - Federal government workers (%)
Class of Workers - Self-employed workers in own not incorporated business and Unpaid family workers (%)
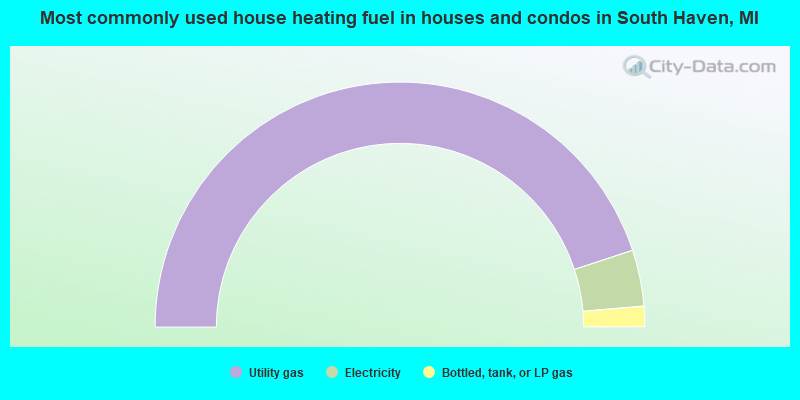
House heating fuel used in houses and condos - Utility gas (%)
House heating fuel used in houses and condos - Bottled, tank, or LP gas (%)
House heating fuel used in houses and condos - Electricity (%)
House heating fuel used in houses and condos - Fuel oil, kerosene, etc. (%)
House heating fuel used in houses and condos - Coal or coke (%)
House heating fuel used in houses and condos - Wood (%)
House heating fuel used in houses and condos - Solar energy (%)
House heating fuel used in houses and condos - Other fuel (%)
House heating fuel used in houses and condos - No fuel used (%)
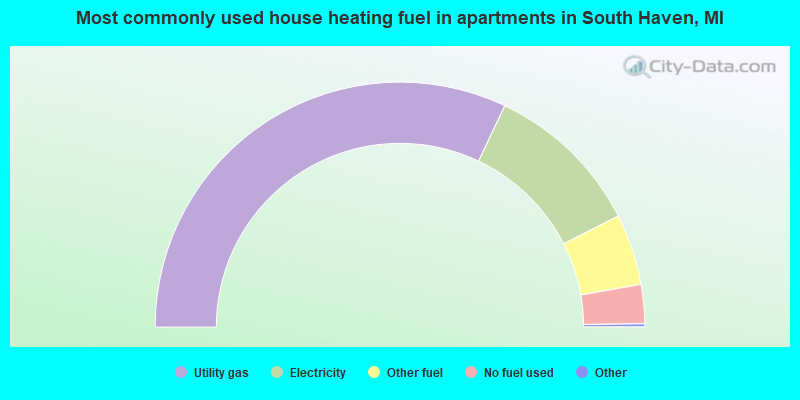
House heating fuel used in apartments - Utility gas (%)
House heating fuel used in apartments - Bottled, tank, or LP gas (%)
House heating fuel used in apartments - Electricity (%)
House heating fuel used in apartments - Fuel oil, kerosene, etc. (%)
House heating fuel used in apartments - Coal or coke (%)
House heating fuel used in apartments - Wood (%)
House heating fuel used in apartments - Solar energy (%)
House heating fuel used in apartments - Other fuel (%)
House heating fuel used in apartments - No fuel used (%)
Armed forces status - In Armed Forces (%)
Armed forces status - Civilian (%)
Armed forces status - Civilian - Veteran (%)
Armed forces status - Civilian - Nonveteran (%)
Fatal accidents locations in years 2005-2021
Fatal accidents locations in 2005
Fatal accidents locations in 2006
Fatal accidents locations in 2007
Fatal accidents locations in 2008
Fatal accidents locations in 2009
Fatal accidents locations in 2010
Fatal accidents locations in 2011
Fatal accidents locations in 2012
Fatal accidents locations in 2013
Fatal accidents locations in 2014
Fatal accidents locations in 2015
Fatal accidents locations in 2016
Fatal accidents locations in 2017
Fatal accidents locations in 2018
Fatal accidents locations in 2019
Fatal accidents locations in 2020
Fatal accidents locations in 2021
Alcohol use - People drinking some alcohol every month (%)
Alcohol use - People not drinking at all (%)
Alcohol use - Average days/month drinking alcohol
Alcohol use - Average drinks/week
Alcohol use - Average days/year people drink much
Audiometry - Average condition of hearing (%)
Audiometry - People that can hear a whisper from across a quiet room (%)
Audiometry - People that can hear normal voice from across a quiet room (%)
Audiometry - Ears ringing, roaring, buzzing (%)
Audiometry - Had a job exposure to loud noise (%)
Audiometry - Had off-work exposure to loud noise (%)
Blood Pressure & Cholesterol - Has high blood pressure (%)
Blood Pressure & Cholesterol - Checking blood pressure at home (%)
Blood Pressure & Cholesterol - Frequently checking blood cholesterol (%)
Blood Pressure & Cholesterol - Has high cholesterol level (%)
Consumer Behavior - Money monthly spent on food at supermarket/grocery store
Consumer Behavior - Money monthly spent on food at other stores
Consumer Behavior - Money monthly spent on eating out
Consumer Behavior - Money monthly spent on carryout/delivered foods
Consumer Behavior - Income spent on food at supermarket/grocery store (%)
Consumer Behavior - Income spent on food at other stores (%)
Consumer Behavior - Income spent on eating out (%)
Consumer Behavior - Income spent on carryout/delivered foods (%)
Current Health Status - General health condition (%)
Current Health Status - Blood donors (%)
Current Health Status - Has blood ever tested for HIV virus (%)
Current Health Status - Left-handed people (%)
Dermatology - People using sunscreen (%)
Diabetes - Diabetics (%)
Diabetes - Had a blood test for high blood sugar (%)
Diabetes - People taking insulin (%)
Diet Behavior & Nutrition - Diet health (%)
Diet Behavior & Nutrition - Milk product consumption (# of products/month)
Diet Behavior & Nutrition - Meals not home prepared (#/week)
Diet Behavior & Nutrition - Meals from fast food or pizza place (#/week)
Diet Behavior & Nutrition - Ready-to-eat foods (#/month)
Diet Behavior & Nutrition - Frozen meals/pizza (#/month)
Drug Use - People that ever used marijuana or hashish (%)
Drug Use - Ever used hard drugs (%)
Drug Use - Ever used any form of cocaine (%)
Drug Use - Ever used heroin (%)
Drug Use - Ever used methamphetamine (%)
Health Insurance - People covered by health insurance (%)
Kidney Conditions-Urology - Avg. # of times urinating at night
Medical Conditions - People with asthma (%)
Medical Conditions - People with anemia (%)
Medical Conditions - People with psoriasis (%)
Medical Conditions - People with overweight (%)
Medical Conditions - Elderly people having difficulties in thinking or remembering (%)
Medical Conditions - People who ever received blood transfusion (%)
Medical Conditions - People having trouble seeing even with glass/contacts (%)
Medical Conditions - People with arthritis (%)
Medical Conditions - People with gout (%)
Medical Conditions - People with congestive heart failure (%)
Medical Conditions - People with coronary heart disease (%)
Medical Conditions - People with angina pectoris (%)
Medical Conditions - People who ever had heart attack (%)
Medical Conditions - People who ever had stroke (%)
Medical Conditions - People with emphysema (%)
Medical Conditions - People with thyroid problem (%)
Medical Conditions - People with chronic bronchitis (%)
Medical Conditions - People with any liver condition (%)
Medical Conditions - People who ever had cancer or malignancy (%)
Mental Health - People who have little interest in doing things (%)
Mental Health - People feeling down, depressed, or hopeless (%)
Mental Health - People who have trouble sleeping or sleeping too much (%)
Mental Health - People feeling tired or having little energy (%)
Mental Health - People with poor appetite or overeating (%)
Mental Health - People feeling bad about themself (%)
Mental Health - People who have trouble concentrating on things (%)
Mental Health - People moving or speaking slowly or too fast (%)
Mental Health - People having thoughts they would be better off dead (%)
Oral Health - Average years since last visit a dentist
Oral Health - People embarrassed because of mouth (%)
Oral Health - People with gum disease (%)
Oral Health - General health of teeth and gums (%)
Oral Health - Average days a week using dental floss/device
Oral Health - Average days a week using mouthwash for dental problem
Oral Health - Average number of teeth
Pesticide Use - Households using pesticides to control insects (%)
Pesticide Use - Households using pesticides to kill weeds (%)
Physical Activity - People doing vigorous-intensity work activities (%)
Physical Activity - People doing moderate-intensity work activities (%)
Physical Activity - People walking or bicycling (%)
Physical Activity - People doing vigorous-intensity recreational activities (%)
Physical Activity - People doing moderate-intensity recreational activities (%)
Physical Activity - Average hours a day doing sedentary activities
Physical Activity - Average hours a day watching TV or videos
Physical Activity - Average hours a day using computer
Physical Functioning - People having limitations keeping them from working (%)
Physical Functioning - People limited in amount of work they can do (%)
Physical Functioning - People that need special equipment to walk (%)
Physical Functioning - People experiencing confusion/memory problems (%)
Physical Functioning - People requiring special healthcare equipment (%)
Prescription Medications - Average number of prescription medicines taking
Preventive Aspirin Use - Adults 40+ taking low-dose aspirin (%)
Reproductive Health - Vaginal deliveries (%)
Reproductive Health - Cesarean deliveries (%)
Reproductive Health - Deliveries resulted in a live birth (%)
Reproductive Health - Pregnancies resulted in a delivery (%)
Reproductive Health - Women breastfeeding newborns (%)
Reproductive Health - Women that had a hysterectomy (%)
Reproductive Health - Women that had both ovaries removed (%)
Reproductive Health - Women that have ever taken birth control pills (%)
Reproductive Health - Women taking birth control pills (%)
Reproductive Health - Women that have ever used Depo-Provera or injectables (%)
Reproductive Health - Women that have ever used female hormones (%)
Sexual Behavior - People 18+ that ever had sex (vaginal, anal, or oral) (%)
Sexual Behavior - Males 18+ that ever had vaginal sex with a woman (%)
Sexual Behavior - Males 18+ that ever performed oral sex on a woman (%)
Sexual Behavior - Males 18+ that ever had anal sex with a woman (%)
Sexual Behavior - Males 18+ that ever had any sex with a man (%)
Sexual Behavior - Females 18+ that ever had vaginal sex with a man (%)
Sexual Behavior - Females 18+ that ever performed oral sex on a man (%)
Sexual Behavior - Females 18+ that ever had anal sex with a man (%)
Sexual Behavior - Females 18+ that ever had any kind of sex with a woman (%)
Sexual Behavior - Average age people first had sex
Sexual Behavior - Average number of female sex partners in lifetime (males 18+)
Sexual Behavior - Average number of female vaginal sex partners in lifetime (males 18+)
Sexual Behavior - Average age people first performed oral sex on a woman (18+)
Sexual Behavior - Average number of woman performed oral sex on in lifetime (18+)
Sexual Behavior - Average number of male sex partners in lifetime (males 18+)
Sexual Behavior - Average number of male anal sex partners in lifetime (males 18+)
Sexual Behavior - Average age people first performed oral sex on a man (18+)
Sexual Behavior - Average number of male oral sex partners in lifetime (18+)
Sexual Behavior - People using protection when performing oral sex (%)
Sexual Behavior - Average number of times people have vaginal or anal sex a year
Sexual Behavior - People having sex without condom (%)
Sexual Behavior - Average number of male sex partners in lifetime (females 18+)
Sexual Behavior - Average number of male vaginal sex partners in lifetime (females 18+)
Sexual Behavior - Average number of female sex partners in lifetime (females 18+)
Sexual Behavior - Circumcised males 18+ (%)
Sleep Disorders - Average hours sleeping at night
Sleep Disorders - People that has trouble sleeping (%)
Smoking-Cigarette Use - People smoking cigarettes (%)
Taste & Smell - People 40+ having problems with smell (%)
Taste & Smell - People 40+ having problems with taste (%)
Taste & Smell - People 40+ that ever had wisdom teeth removed (%)
Taste & Smell - People 40+ that ever had tonsils teeth removed (%)
Taste & Smell - People 40+ that ever had a loss of consciousness because of a head injury (%)
Taste & Smell - People 40+ that ever had a broken nose or other serious injury to face or skull (%)
Taste & Smell - People 40+ that ever had two or more sinus infections (%)
Weight - Average height (inches)
Weight - Average weight (pounds)
Weight - Average BMI
Weight - People that are obese (%)
Weight - People that ever were obese (%)
Weight - People trying to lose weight (%)
Officers per 1,000 residents here:
4.40Michigan average:
1.86
Latest news from South Haven, MI collected exclusively by city-data.com from local newspapers, TV, and radio stations
Ancestries: German (14.7%), Irish (13.1%), American (8.9%), English (7.1%), Dutch (5.7%), Polish (4.1%).
Current Local Time:
Land area: 3.46 square miles.
Population density: 1,153 people per square mile (low).
171 residents are foreign born (2.5% Latin America , 1.1% Asia ).
This city:
4.3%Michigan:
6.9%
Median real estate property taxes paid for housing units with mortgages in 2022: $3,261 (0.8%)Median real estate property taxes paid for housing units with no mortgage in 2022: $5,599 (1.6%)
Nearest city with pop. 50,000+: Kalamazoo, MI
Nearest city with pop. 200,000+: Chicago, IL
Nearest cities:
Latitude: 42.40 N, Longitude: 86.27 W
Nickname or alias (official or unofficial): Blueberry Capital of the World
Daytime population change due to commuting: +2,195 (+54.8%)Workers who live and work in this city: 1,161 (72.6%)
Single-family new house construction building permits:
2022: 29 buildings , average cost: $322,9002021: 35 buildings , average cost: $304,3002020: 25 buildings , average cost: $312,5002019: 11 buildings , average cost: $248,4002018: 6 buildings , average cost: $228,4002017: 6 buildings , average cost: $258,7002016: 8 buildings , average cost: $364,9002015: 14 buildings , average cost: $315,2002014: 11 buildings , average cost: $478,6002013: 12 buildings , average cost: $347,5002012: 10 buildings , average cost: $330,6002011: 9 buildings , average cost: $85,4002010: 7 buildings , average cost: $348,5002009: 6 buildings , average cost: $510,3002008: 11 buildings , average cost: $231,7002007: 33 buildings , average cost: $197,5002006: 12 buildings , average cost: $204,8002005: 30 buildings , average cost: $188,3002004: 25 buildings , average cost: $195,0002003: 21 buildings , average cost: $170,0002002: 17 buildings , average cost: $180,2002001: 12 buildings , average cost: $250,0002000: 21 buildings , average cost: $187,3001999: 23 buildings , average cost: $124,2001998: 22 buildings , average cost: $124,6001997: 14 buildings , average cost: $84,100Unemployment in December 2023:
Most common occupations in South Haven, MI (%)
Both Males Females
Other management occupations, except farmers and farm managers (6.4%)
Preschool, kindergarten, elementary, and middle school teachers (6.0%)
Other production occupations, including supervisors (5.8%)
Electrical equipment mechanics and other installation, maintenance, and repair workers, including supervisors (4.3%)
Other sales and related occupations, including supervisors (4.2%)
Metal workers and plastic workers (3.8%)
Material recording, scheduling, dispatching, and distributing workers (3.2%)
Electrical equipment mechanics and other installation, maintenance, and repair workers, including supervisors (7.9%)
Other production occupations, including supervisors (7.3%)
Other management occupations, except farmers and farm managers (6.8%)
Retail sales workers, except cashiers (4.5%)
Driver/sales workers and truck drivers (4.5%)
Metal workers and plastic workers (4.5%)
Other sales and related occupations, including supervisors (3.8%)
Preschool, kindergarten, elementary, and middle school teachers (8.7%)
Other management occupations, except farmers and farm managers (6.0%)
Registered nurses (4.8%)
Other sales and related occupations, including supervisors (4.5%)
Other production occupations, including supervisors (4.1%)
Secretaries and administrative assistants (4.0%)
Material recording, scheduling, dispatching, and distributing workers (3.6%)
Tornado activity:
South Haven-area historical tornado activity is near Michigan state average. It is 8% greater than the overall U.S. average.
On 4/3/1956, a category F5 (max. wind speeds 261-318 mph) tornado 18.9 miles away from the South Haven city center killed 18 people and injured 340 people and caused between $50,000 and $500,000 in damages.
On 4/3/1956, a category F3 (max. wind speeds 158-206 mph) tornado 11.5 miles away from the city center injured 12 people and caused between $500,000 and $5,000,000 in damages.
Earthquake activity:
South Haven-area historical earthquake activity is significantly above Michigan state average. It is 6% smaller than the overall U.S. average. On 5/2/2015 at 16:23:07, a magnitude 4.2 (4.2 MW, Depth: 2.8 mi, Class: Light, Intensity: IV - V) earthquake occurred 44.7 miles away from the city center On 4/18/2008 at 09:36:59, a magnitude 5.4 (5.1 MB, 4.8 MS, 5.4 MW, 5.2 MW, Class: Moderate, Intensity: VI - VII) earthquake occurred 285.9 miles away from South Haven center On 6/10/1987 at 23:48:54, a magnitude 5.1 (4.9 MB, 4.4 MS, 4.6 MS, 5.1 LG) earthquake occurred 261.5 miles away from the city center On 4/18/2008 at 09:36:59, a magnitude 5.2 (5.2 MW, Depth: 8.9 mi) earthquake occurred 285.9 miles away from the city center On 7/12/1986 at 08:19:37, a magnitude 4.5 (4.5 MB) earthquake occurred 162.2 miles away from the city center On 1/31/1986 at 16:46:43, a magnitude 5.0 (5.0 MB) earthquake occurred 268.5 miles away from South Haven center Magnitude types: regional Lg-wave magnitude (LG), body-wave magnitude (MB), surface-wave magnitude (MS), moment magnitude (MW) Natural disasters: The number of natural disasters in Van Buren County (11) is smaller than the US average (15).Major Disasters (Presidential) Declared: 5Emergencies Declared: 5Storms: 5, Floods: 4, Snowstorms: 2, Winter Storms: 2, Blizzard: 1, Hurricane: 1, Tornado: 1, Wind: 1, Other: 1 (Note: some incidents may be assigned to more than one category). Hospitals and medical centers in South Haven: SOUTH HAVEN AREA HOSPICE (05055 BLUE STAR HWY/PO BOX 990) SOUTH HAVEN COMMUNITY HOSPITAL (Government - Hospital District or Authority, 955 S BAILEY AVE) COUNTRYSIDE NURSING AND REHABILITATION COMMUNITY (120 BASELINE RD)
COUNTRYSIDE NURSING HOME (120 BASELINE RD)
SOUTH HAVEN NURSING AND REHABILITATION COMMUNITY (850 PHILLIPS)
FMC - SOUTH HAVEN (199 VETERANS BLVD)
SOUTH HAVEN HOMECARE (955 S BAILEY AVE)
Airports located in South Haven: Amtrak station near South Haven: 11 miles: BANGOR (541 RAILROAD ST.) Services: enclosed waiting area, public payphones, free short-term parking, free long-term parking.
Nuclear power plants: Colleges/universities with over 2000 students nearest to South Haven:
Lake Michigan College (about 22 miles; Benton Harbor, MI ; Full-time enrollment: 2,341)
Hope College (about 29 miles; Holland, MI ; FT enrollment: 3,535)
Andrews University (about 31 miles; Berrien Springs, MI ; FT enrollment: 3,103)
Kalamazoo Valley Community College (about 33 miles; Kalamazoo, MI ; FT enrollment: 7,369)
Western Michigan University (about 35 miles; Kalamazoo, MI ; FT enrollment: 20,840)
Grand Valley State University (about 44 miles; Allendale, MI ; FT enrollment: 21,982)
University of Notre Dame (about 49 miles; Notre Dame, IN ; FT enrollment: 12,214)
Public high schools in South Haven: SOUTH HAVEN HIGH SCHOOL Students: 747, Location: 600 ELKENBURG ST, Grades: 9-12)CAREER AND EARLY COLLEGE ACADEMY Location: 125 VETERANS DR, Grades: 6-12)
Public elementary/middle schools in South Haven:
Private elementary/middle schools in South Haven: ST PAUL LUTHERAN SCHOOL Students: 75, Location: 718 ARBOR CT, Grades: PK-8)
ST BASIL SCHOOL Students: 65, Location: 94 SUPERIOR ST, Grades: PK-8)
See full list of schools located in South Haven Library in South Haven: SOUTH HAVEN MEMORIAL LIBRARY Operating income: $331,031; Location: 314 BROADWAY STREET; 56,815 books ; 300 e-books ; 1,280 audio materials ; 704 video materials ; 120 print serial subscriptions ; 1 electronic serial subscriptions )
Notable locations in South Haven: (A) , South Haven Municipal Marina (B) , Pothole Marina (C) , Jensens Fishery (D) , North Beach Public Park (E) , River Bend Boat Club (F) , South Haven Marine (G) , Michigan State College South Haven Experiment Station (H) , Liberty Hyde Bailey Museum (I) , South Haven City Hall (J) , South Haven Memorial Library (K) , South Haven Area Emergency Services Station 3 Suite 2 (L) , South Haven Police Department (M) , Michigan Maritime Museum (N) . Display/hide their locations on the map
Churches in South Haven include: (A) , Saint Basil Church (B) , Saint Paul's Lutheran Church (C) , First Assembly of God (D) , Calvary Missionary Baptist Church (E) , Christian Science Church (F) , First Hebrew Congregation (G) , First Congregational Church (H) , First Church of God (I) . Display/hide their locations on the map
Cemeteries: (1) , Lake View Cemetery (2) . Display/hide their locations on the map
River: (A) . Display/hide its location on the map
Parks in South Haven include: (1) , Elkenburg Park (2) , Kids Corner Playground (3) , River Front Park (4) , Ellen Avery Park (5) , Hartman Park (6) , Tot Lot Park (7) , Stanley Johnson Park (8) , Packard Park (9) . Display/hide their locations on the map
Beaches: (A) , South Beach (B) , Woodman Beach (C) , Dyckman Beach (D) . Display/hide their locations on the map
Tourist attraction:
Hotels:
Birthplace of: Art Walker - Football player, Audrey Niffenegger - Novelist, Cindy Hill - Professional golfer, Charles Umlauf - Artist, Dave Gumpert - Baseball player, Liberty Hyde Bailey - (1858-1954).
Van Buren County has a predicted average indoor radon screening level less than 2 pCi/L (pico curies per liter) - Low Potential Drinking water stations with addresses in South Haven and their reported violations in the past:
KIBBIE CHRISTIAN REFORMED CHURCH (Population served: 180, Groundwater):
Past health violations:
MCL, Monthly (TCR) - In JUL-2010, Contaminant: Coliform. Follow-up actions: St Violation/Reminder Notice (JUL-23-2010), St Compliance achieved (AUG-10-2010)
Past monitoring violations:
One routine major monitoring violation
Population served: 125, Groundwater):
Past health violations:
MCL, Monthly (TCR) - In OCT-2013, Contaminant: Coliform. Follow-up actions: St Tech Assistance Visit (OCT-08-2013), St Public Notif issued (OCT-09-2013), St Violation/Reminder Notice (OCT-09-2013), St Tech Assistance Visit (APR-15-2014)
Population served: 80, Groundwater):
Past health violations:
MCL, Monthly (TCR) - In SEP-2006, Contaminant: Coliform. Follow-up actions: St Compliance achieved (SEP-22-2006)
Past monitoring violations:
One routine major monitoring violation
Population served: 72, Groundwater):
Past health violations:
MCL, Acute (TCR) - In NOV-2005, Contaminant: Coliform. Follow-up actions: St Boil Water Order (NOV-10-2005), St Public Notif requested (NOV-10-2005), St Public Notif received (NOV-10-2005), St Compliance achieved (NOV-13-2005), St Violation/Reminder Notice (NOV-17-2005)
MCL, Monthly (TCR) - In NOV-2005, Contaminant: Coliform. Follow-up actions: St Public Notif requested (NOV-09-2005), St Violation/Reminder Notice (NOV-09-2005), St Boil Water Order (NOV-10-2005), St Public Notif received (NOV-10-2005), St Compliance achieved (NOV-15-2005)
MCL, Monthly (TCR) - In OCT-2005, Contaminant: Coliform. Follow-up actions: St Compliance achieved (OCT-17-2005), St Public Notif received (OCT-23-2005), St Public Notif requested (OCT-26-2005), St Violation/Reminder Notice (OCT-26-2005)
Population served: 25, Groundwater):
Past monitoring violations:
2 routine major monitoring violations
Drinking water stations with addresses in South Haven that have no violations reported:
RIVERSIDE FOOD MART (Population served: 800, Primary Water Source Type: Groundwater)
HARTFORD SHELL FOOD MART (Population served: 200, Primary Water Source Type: Groundwater)
SINGING SANDS RV PARK (Population served: 145, Primary Water Source Type: Groundwater)
PHOENIX COUNTRY MARKET (Population served: 75, Primary Water Source Type: Groundwater)
HAMLIN 66TH ST CAMP 03-0025 (Population served: 67, Primary Water Source Type: Groundwater)
PHOENIX INN (Population served: 50, Primary Water Source Type: Groundwater)
HAMLIN 111TH AVE CAMP 03-0026 (Population served: 37, Primary Water Source Type: Groundwater)
THE INN AT HAWKSHEAD (Population served: 25, Primary Water Source Type: Groundwater)
M-89 SHELL (Population served: 25, Primary Water Source Type: Groundwater)
Average household size: This city:
2.2 peopleMichigan:
2.5 people
Percentage of family households: This city:
57.5%Whole state:
66.0%
Percentage of households with unmarried partners: This city:
7.2%Whole state:
6.4%
Likely homosexual households (counted as self-reported same-sex unmarried-partner households)
Lesbian couples: 0.3% of all households Gay men: 0.1% of all households
155 people in nursing facilities/skilled-nursing facilities in 2010people in nursing homes in 2000people in other nonhousehold living situations in 2000
Banks with branches in South Haven (2011 data):
Sturgis Bank & Trust Company: South Haven Banking Center at 1121 Lagrange Street, branch established on 1980/03/03; South Haven (Center Street) Branch at 365 Center Street, branch established on 2008/04/16. Info updated 2006/11/03: Bank assets: $314.3 mil, Deposits: $234.6 mil, headquarters in Sturgis, MI, positive income , Commercial Lending Specialization, 11 total offices , Holding Company: Sturgis Bancorp, Inc.
Chemical Bank: South Haven-Downtown Branch at 433 Phoenix Street, branch established on 1892/11/03; South Haven-Suburban Branch at 73881 M-43, branch established on 1972/12/13. Info updated 2010/07/30: Bank assets: $5,331.9 mil, Deposits: $4,367.1 mil, headquarters in Midland, MI, positive income , Commercial Lending Specialization, 146 total offices , Holding Company: Chemical Financial Corporation
Fifth Third Bank: South Haven Branch at 601 Phoenix Street, branch established on 1973/10/01. Info updated 2009/10/05: Bank assets: $114,540.4 mil, Deposits: $89,689.1 mil, headquarters in Cincinnati, OH, positive income , Commercial Lending Specialization, 1378 total offices , Holding Company: Fifth Third Bancorp
Flagstar Bank, FSB: South Haven Banking Center at 201 73rd Street, branch established on 2002/03/27. Info updated 2011/07/21: Bank assets: $13,623.5 mil, Deposits: $7,802.8 mil, headquarters in Troy, MI, negative income in the last year , Mortgage Lending Specialization, 135 total offices
For population 15 years and over in South Haven:
Never married: 19.0%Now married: 58.1%Separated: 0.6%Widowed: 10.2%Divorced: 12.1% For population 25 years and over in South Haven:
High school or higher: 91.5%Bachelor's degree or higher: 40.9%Graduate or professional degree: 19.0%Unemployed: 3.0%Mean travel time to work (commute): 14.9 minutes
Education Gini index (Inequality in education) Here:
13.6Michigan average:
11.0
Religion statistics for South Haven, MI (based on Van Buren County data)
Religion Adherents Congregations Catholic 12,943 7 Evangelical Protestant 7,575 68 Mainline Protestant 5,337 29 Other 577 9 Black Protestant 494 4 None 49,332 -
Source: Clifford Grammich, Kirk Hadaway, Richard Houseal, Dale E.Jones, Alexei Krindatch, Richie Stanley and Richard H.Taylor. 2012. 2010 U.S.Religion Census: Religious Congregations & Membership Study. Association of Statisticians of American Religious Bodies. Jones, Dale E., et al. 2002. Congregations and Membership in the United States 2000. Nashville, TN: Glenmary Research Center. Graphs represent county-level data
Food Environment Statistics: Number of grocery stores : 16This county :
2.06 / 10,000 pop.Michigan :
2.34 / 10,000 pop.
Number of supercenters and club stores : 1Van Buren County :
0.13 / 10,000 pop.State :
0.18 / 10,000 pop.
Number of convenience stores (no gas) : 16Van Buren County :
2.06 / 10,000 pop.Michigan :
1.52 / 10,000 pop.
Number of convenience stores (with gas) : 40Van Buren County :
5.14 / 10,000 pop.Michigan :
2.99 / 10,000 pop.
Number of full-service restaurants : 61Van Buren County :
7.84 / 10,000 pop.Michigan :
6.80 / 10,000 pop.
Adult obesity rate : Van Buren County :
28.5%Michigan :
29.7%
Low-income preschool obesity rate : Health and Nutrition: Healthy diet rate : South Haven:
50.4%Michigan:
50.3%
Average overall health of teeth and gums : South Haven:
46.6%State:
47.9%
Average BMI : This city:
28.9Michigan:
28.7
People feeling badly about themselves : People not drinking alcohol at all : South Haven:
11.0%Michigan:
10.4%
Average hours sleeping at night : General health condition : South Haven:
54.9%Michigan:
57.0%
Average condition of hearing : This city:
76.9%Michigan:
79.6%
More about Health and Nutrition of South Haven, MI Residents
Local government employment and payroll (March 2022)
Function
Full-time employees
Monthly full-time payroll
Average yearly full-time wage
Part-time employees
Monthly part-time payroll
Police Protection - Officers
19 $130,312 $82,302 0 $0 Streets and Highways
16 $91,658 $68,744 0 $0 Financial Administration
12 $53,096 $53,096 2 $5,866 Electric Power
11 $67,309 $73,428 0 $0 Other Government Administration
7 $38,236 $65,547 7 $22,586 Housing and Community Development (Local)
6 $35,632 $71,264 0 $0 Police - Other
5 $19,662 $47,189 5 $4,137 Water Supply
4 $25,695 $77,085 0 $0 Sewerage
4 $25,569 $76,707 0 $0 Local Libraries
3 $10,504 $42,016 15 $12,318 Parks and Recreation
3 $15,900 $63,600 2 $1,119
Totals for Government
90 $513,573 $68,476 31 $46,025
South Haven government finances - Expenditure in 2021 (per resident):
Construction - Regular Highways: $756,000 ($189.57)
Housing and Community Development: $50,000 ($12.54)Current Operations - General - Other: $15,903,000 ($3987.71)
Sewerage: $4,535,000 ($1137.16)Police Protection: $2,543,000 ($637.66)Regular Highways: $1,969,000 ($493.73)Parks and Recreation: $1,089,000 ($273.07)Housing and Community Development: $690,000 ($173.02)Local Fire Protection: $612,000 ($153.46)Protective Inspection and Regulation - Other: $524,000 ($131.39)Health - Other: $480,000 ($120.36)Libraries: $336,000 ($84.25)Financial Administration: $328,000 ($82.25)General Public Buildings: $251,000 ($62.94)Central Staff Services: $235,000 ($58.93)Judicial and Legal Services: $193,000 ($48.40)General - Interest on Debt: $871,000 ($218.41)
Intergovernmental to Local - Other - Local Fire Protection: $612,000 ($153.46)
Other Capital Outlay - Parks and Recreation: $2,845,000 ($713.39)
Electric Utilities: $556,000 ($139.42)Water Utilities: $502,000 ($125.88)General - Other: $355,000 ($89.02)Housing and Community Development: $62,000 ($15.55)Sewerage: $20,000 ($5.02)Police Protection: $14,000 ($3.51)Total Salaries and Wages: $6,245,000 ($1565.95)
Water Utilities - Interest on Debt: $545,000 ($136.66)
South Haven government finances - Revenue in 2021 (per resident):
Charges - Sewerage: $3,011,000 ($755.02)
Parks and Recreation: $1,404,000 ($352.06)Other: $577,000 ($144.68)Housing and Community Development: $502,000 ($125.88)Federal Intergovernmental - Housing and Community Development: $294,000 ($73.72)
Other: $258,000 ($64.69)Local Intergovernmental - Other: $651,000 ($163.24)
Miscellaneous - Donations From Private Sources: $1,585,000 ($397.44)
General Revenue - Other: $800,000 ($200.60)Rents: $629,000 ($157.72)Interest Earnings: $232,000 ($58.17)Fines and Forfeits: $12,000 ($3.01)Special Assessments: $1,000 ($0.25)Revenue - Electric Utilities: $17,348,000 ($4350.05)
Water Utilities: $4,383,000 ($1099.05)State Intergovernmental - Highways: $752,000 ($188.57)
General Local Government Support: $508,000 ($127.38)Other: $272,000 ($68.20)Tax - Property: $8,147,000 ($2042.88)
Occupation and Business License - Other: $528,000 ($132.40)
South Haven government finances - Debt in 2021 (per resident):
Long Term Debt - Beginning Outstanding - Unspecified Public Purpose: $44,985,000 ($11280.09)
Outstanding Unspecified Public Purpose: $42,846,000 ($10743.73)Retired Unspecified Public Purpose: $2,362,000 ($592.28)Issue, Unspecified Public Purpose: $224,000 ($56.17)Short Term Debt Outstanding - End of Fiscal Year: $43,000 ($10.78)
Beginning: $40,000 ($10.03)
South Haven government finances - Cash and Securities in 2021 (per resident):
Other Funds - Cash and Securities: $29,168,000 ($7313.94)
Businesses in South Haven, MI
Name Count Name Count
Burger King 1 McDonald's 2 Chevrolet 1 Menards 1 Comfort Suites 1 Penske 1 Curves 1 Pizza Hut 1 DHL 1 Quiznos 1 Dairy Queen 1 RadioShack 1 FedEx 1 Ramada 1 Ford 1 Subway 1 H&R Block 1 Taco Bell 1 Holiday Inn 1 U-Haul 1 La-Z-Boy 1 UPS 3 Lane Furniture 1 Walgreens 1 Little Caesars Pizza 1 Walmart 1 MasterBrand Cabinets 4
Strongest AM radio stations in South Haven:
WGMY (940 AM; 1 kW; SOUTH HAVEN, MI; Owner: WSJM INC)
WPNW (1260 AM; 10 kW; ZEELAND, MI; Owner: LANSER BROADCASTING CORPORATION)
WTMJ (620 AM; 50 kW; MILWAUKEE, WI; Owner: JOURNAL BROADCAST CORPORATION)
WHFB (1060 AM; 5 kW; BENTON HARBOR-ST. JO, MI; Owner: WHFB B/CST ASSOCIATES LTD PARTNERSHP)
WOOD (1300 AM; 20 kW; GRAND RAPIDS, MI; Owner: CLEAR CHANNEL BROADCASTING LICENSES, INC.)
WGN (720 AM; 50 kW; CHICAGO, IL; Owner: WGN CONTINENTAL BROADCASTING CO.)
WSCR (670 AM; 50 kW; CHICAGO, IL; Owner: INFINITY BROADCASTING OPERATIONS, INC.)
WBBM (780 AM; 50 kW; CHICAGO, IL; Owner: INFINITY BROADCASTING OPERATIONS, INC.)
WKZO (590 AM; 5 kW; KALAMAZOO, MI; Owner: FAIRFIELD BROADCASTING COMPANY)
WLS (890 AM; 50 kW; CHICAGO, IL; Owner: WLS, INC.)
WMVP (1000 AM; 50 kW; CHICAGO, IL; Owner: ABC, INC.)
WKLZ (1470 AM; 10 kW; KALAMAZOO, MI; Owner: FAIRFIELD BROADCASTING COMPANY)
WISN (1130 AM; 50 kW; MILWAUKEE, WI; Owner: CAPSTAR TX LIMITED PARTNERSHIP)
Strongest FM radio stations in South Haven:
WCSY-FM (98.3 FM; SOUTH HAVEN, MI; Owner: WSJM INC)
WZBL (103.7 FM; HARTFORD, MI; Owner: WSJM INC)
WIRX (107.1 FM; ST. JOSEPH, MI; Owner: WSJM, INC.)
WYVN (92.7 FM; SAUGATUCK, MI; Owner: MIDWEST COMMUNICATIONS, INC.)
WZUU (92.3 FM; ALLEGAN, MI; Owner: FORUM COMMUNICATIONS, INC.)
WHFB-FM (99.9 FM; BENTON HARBOR, MI; Owner: WHFB BROADCAST ASSOCIATES L P)
WCNF (94.9 FM; BENTON HARBOR, MI; Owner: WSJM, INC.)
WAUS (90.7 FM; BERRIEN SPRINGS, MI; Owner: ANDREWS BROADCASTING CORP.)
TV broadcast stations around South Haven:
WWMT (Channel 3; KALAMAZOO, MI; Owner: FREEDOM BROADCASTING OF MICHIGAN, INC.)
WRDY-LP (Channel 69; SOUTH BEND, IN; Owner: WEIGEL BROADCASTING COMPANY)
WLLA (Channel 64; KALAMAZOO, MI; Owner: CHRISTIAN FAITH BROADCAST, INC.)
WXMI (Channel 17; GRAND RAPIDS, MI; Owner: TRIBUNE TELEVISION HOLDINGS, INC.)
WTLJ (Channel 54; MUSKEGON, MI; Owner: TCT OF MICHIGAN, INC.)
WOOD-TV (Channel 8; GRAND RAPIDS, MI; Owner: WOOD LICENSE COMPANY, LLC)
WOTV (Channel 41; BATTLE CREEK, MI; Owner: WOOD LICENSE COMPANY, LLC)
National Bridge Inventory (NBI) Statistics 39 Number of bridges358ft / 109m Total length $780,000 Total costs243,214 Total average daily traffic51,569 Total average daily truck traffic
New bridges - historical statistics
2 1940-1949 1 1950-1959 17 1960-1969 6 1970-1979 4 1980-1989 2 1990-1999 2 2000-2009 5 2010-2019
See full National Bridge Inventory statistics for South Haven, MI
Home Mortgage Disclosure Act Aggregated Statistics For Year 2009(Based on 1 full and 1 partial tracts) A) FHA, FSA/RHS & VA B) Conventional C) Refinancings D) Home Improvement Loans F) Non-occupant Loans on G) Loans On Manufactured Number Average Value Number Average Value Number Average Value Number Average Value Number Average Value Number Average Value
LOANS ORIGINATED 11 $124,665 44 $184,170 165 $192,969 13 $96,108 108 $209,077 0 $0 APPLICATIONS APPROVED, NOT ACCEPTED 1 $47,000 3 $207,960 8 $201,578 1 $8,670 4 $197,405 0 $0 APPLICATIONS DENIED 1 $279,440 5 $277,710 43 $253,058 9 $42,537 27 $232,262 1 $55,950 APPLICATIONS WITHDRAWN 2 $156,150 4 $117,560 16 $196,852 1 $59,680 7 $240,184 0 $0 FILES CLOSED FOR INCOMPLETENESS 0 $0 1 $410,300 4 $121,505 1 $48,180 1 $509,520 0 $0
Aggregated Statistics For Year 2008(Based on 1 full and 1 partial tracts) A) FHA, FSA/RHS & VA B) Conventional C) Refinancings D) Home Improvement Loans F) Non-occupant Loans on G) Loans On Manufactured Number Average Value Number Average Value Number Average Value Number Average Value Number Average Value Number Average Value
LOANS ORIGINATED 3 $86,783 41 $220,650 84 $222,396 21 $67,552 56 $238,905 0 $0 APPLICATIONS APPROVED, NOT ACCEPTED 1 $70,120 5 $203,672 7 $188,726 1 $6,710 6 $233,712 0 $0 APPLICATIONS DENIED 3 $149,160 16 $164,862 43 $214,473 11 $141,904 21 $206,295 0 $0 APPLICATIONS WITHDRAWN 1 $25,360 6 $223,692 16 $152,586 2 $227,810 9 $180,171 1 $72,270 FILES CLOSED FOR INCOMPLETENESS 0 $0 1 $235,740 2 $291,285 0 $0 2 $110,380 0 $0
Aggregated Statistics For Year 2007(Based on 1 full and 1 partial tracts) A) FHA, FSA/RHS & VA B) Conventional C) Refinancings D) Home Improvement Loans F) Non-occupant Loans on G) Loans On Manufactured Number Average Value Number Average Value Number Average Value Number Average Value Number Average Value Number Average Value
LOANS ORIGINATED 2 $123,835 87 $220,299 90 $166,839 26 $56,718 91 $209,644 0 $0 APPLICATIONS APPROVED, NOT ACCEPTED 0 $0 11 $272,313 18 $172,352 3 $67,773 8 $318,744 0 $0 APPLICATIONS DENIED 1 $64,900 22 $218,228 62 $200,675 12 $59,248 24 $216,696 2 $76,090 APPLICATIONS WITHDRAWN 0 $0 6 $180,353 25 $189,156 2 $257,730 10 $181,479 0 $0 FILES CLOSED FOR INCOMPLETENESS 0 $0 2 $264,990 7 $191,933 1 $110,810 5 $214,180 0 $0
Aggregated Statistics For Year 2006(Based on 1 full and 1 partial tracts) A) FHA, FSA/RHS & VA B) Conventional C) Refinancings D) Home Improvement Loans F) Non-occupant Loans on G) Loans On Manufactured Number Average Value Number Average Value Number Average Value Number Average Value Number Average Value Number Average Value
LOANS ORIGINATED 4 $105,528 86 $202,353 107 $172,257 30 $59,474 85 $233,069 2 $64,935 APPLICATIONS APPROVED, NOT ACCEPTED 0 $0 9 $153,989 20 $201,514 1 $11,190 7 $419,049 0 $0 APPLICATIONS DENIED 0 $0 17 $347,910 64 $165,516 10 $93,362 23 $348,911 3 $46,003 APPLICATIONS WITHDRAWN 1 $113,700 5 $176,780 34 $173,551 4 $175,998 8 $320,638 0 $0 FILES CLOSED FOR INCOMPLETENESS 1 $52,220 3 $465,437 12 $166,818 0 $0 2 $625,860 0 $0
Aggregated Statistics For Year 2005(Based on 1 full and 1 partial tracts) A) FHA, FSA/RHS & VA B) Conventional C) Refinancings D) Home Improvement Loans E) Loans on Dwellings For 5+ Families F) Non-occupant Loans on G) Loans On Manufactured Number Average Value Number Average Value Number Average Value Number Average Value Number Average Value Number Average Value Number Average Value
LOANS ORIGINATED 6 $109,430 114 $190,772 144 $197,335 18 $118,032 2 $163,250 115 $225,744 1 $47,740 APPLICATIONS APPROVED, NOT ACCEPTED 0 $0 14 $141,446 23 $166,194 2 $100,335 0 $0 15 $216,795 0 $0 APPLICATIONS DENIED 0 $0 21 $106,895 74 $168,290 8 $218,550 0 $0 26 $172,447 4 $33,898 APPLICATIONS WITHDRAWN 1 $126,820 8 $180,246 47 $145,189 12 $129,572 0 $0 5 $264,436 0 $0 FILES CLOSED FOR INCOMPLETENESS 0 $0 2 $136,350 7 $125,227 1 $14,920 0 $0 1 $220,660 0 $0
Aggregated Statistics For Year 2004(Based on 1 full and 1 partial tracts) A) FHA, FSA/RHS & VA B) Conventional C) Refinancings D) Home Improvement Loans E) Loans on Dwellings For 5+ Families F) Non-occupant Loans on G) Loans On Manufactured Number Average Value Number Average Value Number Average Value Number Average Value Number Average Value Number Average Value Number Average Value
LOANS ORIGINATED 1 $59,680 112 $181,852 186 $159,874 25 $49,725 3 $148,073 125 $205,516 0 $0 APPLICATIONS APPROVED, NOT ACCEPTED 1 $83,830 14 $222,248 27 $157,758 2 $41,185 0 $0 10 $242,851 2 $70,265 APPLICATIONS DENIED 1 $86,720 14 $134,276 72 $151,152 8 $101,702 0 $0 18 $206,557 3 $91,707 APPLICATIONS WITHDRAWN 0 $0 7 $137,714 51 $185,878 3 $34,927 0 $0 10 $174,222 0 $0 FILES CLOSED FOR INCOMPLETENESS 0 $0 3 $136,510 17 $220,000 0 $0 0 $0 4 $153,475 0 $0
Aggregated Statistics For Year 2003(Based on 1 full and 1 partial tracts) A) FHA, FSA/RHS & VA B) Conventional C) Refinancings D) Home Improvement Loans F) Non-occupant Loans on Number Average Value Number Average Value Number Average Value Number Average Value Number Average Value
LOANS ORIGINATED 1 $133,530 102 $170,524 371 $146,692 24 $30,472 199 $181,344 APPLICATIONS APPROVED, NOT ACCEPTED 1 $133,530 14 $224,036 45 $156,411 2 $7,710 29 $209,626 APPLICATIONS DENIED 1 $37,300 10 $154,315 82 $243,384 9 $47,586 21 $255,174 APPLICATIONS WITHDRAWN 1 $167,100 10 $130,051 59 $159,436 2 $31,210 14 $195,533 FILES CLOSED FOR INCOMPLETENESS 0 $0 1 $192,720 14 $197,951 1 $14,920 4 $419,090
Aggregated Statistics For Year 2002(Based on 1 full and 1 partial tracts) A) FHA, FSA/RHS & VA B) Conventional C) Refinancings D) Home Improvement Loans E) Loans on Dwellings For 5+ Families F) Non-occupant Loans on Number Average Value Number Average Value Number Average Value Number Average Value Number Average Value Number Average Value
LOANS ORIGINATED 2 $76,605 100 $147,357 240 $146,612 30 $25,011 1 $55,890 138 $172,174 APPLICATIONS APPROVED, NOT ACCEPTED 0 $0 10 $113,872 22 $151,240 2 $36,615 0 $0 4 $131,468 APPLICATIONS DENIED 1 $88,770 9 $75,029 65 $93,258 7 $24,739 0 $0 9 $79,114 APPLICATIONS WITHDRAWN 0 $0 7 $157,523 23 $114,310 0 $0 0 $0 7 $135,593 FILES CLOSED FOR INCOMPLETENESS 0 $0 1 $53,710 11 $192,422 0 $0 0 $0 1 $61,920
Aggregated Statistics For Year 2001(Based on 1 full and 1 partial tracts) A) FHA, FSA/RHS & VA B) Conventional C) Refinancings D) Home Improvement Loans E) Loans on Dwellings For 5+ Families F) Non-occupant Loans on Number Average Value Number Average Value Number Average Value Number Average Value Number Average Value Number Average Value
LOANS ORIGINATED 11 $77,740 89 $159,930 226 $125,469 23 $29,909 2 $68,835 110 $162,468 APPLICATIONS APPROVED, NOT ACCEPTED 1 $82,060 9 $115,880 15 $101,565 4 $56,440 0 $0 4 $157,485 APPLICATIONS DENIED 2 $122,780 13 $54,427 73 $93,647 31 $21,015 0 $0 5 $162,612 APPLICATIONS WITHDRAWN 0 $0 7 $187,603 34 $86,346 2 $8,550 0 $0 3 $248,610 FILES CLOSED FOR INCOMPLETENESS 0 $0 1 $174,560 9 $111,207 0 $0 0 $0 2 $63,130
Aggregated Statistics For Year 2000(Based on 1 full and 1 partial tracts) A) FHA, FSA/RHS & VA B) Conventional C) Refinancings D) Home Improvement Loans F) Non-occupant Loans on Number Average Value Number Average Value Number Average Value Number Average Value Number Average Value
LOANS ORIGINATED 5 $66,662 96 $113,309 75 $83,790 31 $33,045 64 $132,185 APPLICATIONS APPROVED, NOT ACCEPTED 0 $0 7 $55,857 12 $76,209 6 $9,693 3 $64,167 APPLICATIONS DENIED 2 $72,425 27 $56,950 52 $76,845 25 $18,298 10 $73,261 APPLICATIONS WITHDRAWN 0 $0 12 $120,349 13 $71,195 2 $42,400 4 $104,792 FILES CLOSED FOR INCOMPLETENESS 0 $0 0 $0 4 $65,385 0 $0 0 $0
Aggregated Statistics For Year 1999(Based on 2 partial tracts) A) FHA, FSA/RHS & VA B) Conventional C) Refinancings D) Home Improvement Loans E) Loans on Dwellings For 5+ Families F) Non-occupant Loans on Number Average Value Number Average Value Number Average Value Number Average Value Number Average Value Number Average Value
LOANS ORIGINATED 6 $82,955 96 $124,460 128 $93,939 48 $29,405 2 $72,365 59 $126,848 APPLICATIONS APPROVED, NOT ACCEPTED 0 $0 7 $180,701 27 $60,677 8 $28,689 0 $0 2 $212,860 APPLICATIONS DENIED 2 $53,205 15 $69,211 51 $75,640 13 $11,538 0 $0 11 $103,045 APPLICATIONS WITHDRAWN 2 $108,895 8 $100,820 26 $98,105 2 $55,265 0 $0 5 $90,266 FILES CLOSED FOR INCOMPLETENESS 0 $0 2 $59,325 10 $87,535 0 $0 0 $0 2 $51,970
Detailed HMDA statistics for the following Tracts:
0103.00
, 0104.00
Private Mortgage Insurance Companies Aggregated Statistics For Year 2009(Based on 1 full and 1 partial tracts) A) Conventional B) Refinancings C) Non-occupant Loans on Number Average Value Number Average Value Number Average Value
LOANS ORIGINATED 2 $152,250 1 $122,380 2 $152,250 APPLICATIONS APPROVED, NOT ACCEPTED 0 $0 0 $0 0 $0 APPLICATIONS DENIED 2 $150,165 1 $178,290 1 $67,140 APPLICATIONS WITHDRAWN 0 $0 0 $0 0 $0 FILES CLOSED FOR INCOMPLETENESS 0 $0 0 $0 0 $0
Aggregated Statistics For Year 2008(Based on 1 full and 1 partial tracts) A) Conventional B) Refinancings C) Non-occupant Loans on Number Average Value Number Average Value Number Average Value
LOANS ORIGINATED 5 $182,398 3 $187,000 2 $213,390 APPLICATIONS APPROVED, NOT ACCEPTED 3 $164,370 3 $152,080 2 $219,325 APPLICATIONS DENIED 1 $286,460 0 $0 1 $286,460 APPLICATIONS WITHDRAWN 1 $136,520 0 $0 1 $136,520 FILES CLOSED FOR INCOMPLETENESS 0 $0 1 $84,300 0 $0
Aggregated Statistics For Year 2007(Based on 1 full and 1 partial tracts) A) Conventional B) Refinancings C) Non-occupant Loans on Number Average Value Number Average Value Number Average Value
LOANS ORIGINATED 16 $137,389 3 $259,737 11 $192,064 APPLICATIONS APPROVED, NOT ACCEPTED 4 $147,655 0 $0 2 $217,775 APPLICATIONS DENIED 0 $0 0 $0 0 $0 APPLICATIONS WITHDRAWN 3 $168,630 0 $0 2 $193,200 FILES CLOSED FOR INCOMPLETENESS 0 $0 0 $0 0 $0
Aggregated Statistics For Year 2006(Based on 1 full and 1 partial tracts) A) Conventional B) Refinancings C) Non-occupant Loans on Number Average Value Number Average Value Number Average Value
LOANS ORIGINATED 10 $130,250 7 $181,017 5 $170,936 APPLICATIONS APPROVED, NOT ACCEPTED 2 $254,185 0 $0 2 $209,425 APPLICATIONS DENIED 0 $0 0 $0 0 $0 APPLICATIONS WITHDRAWN 0 $0 0 $0 0 $0 FILES CLOSED FOR INCOMPLETENESS 0 $0 0 $0 0 $0
Aggregated Statistics For Year 2005(Based on 1 full and 1 partial tracts) A) Conventional B) Refinancings C) Non-occupant Loans on Number Average Value Number Average Value Number Average Value
LOANS ORIGINATED 11 $162,922 3 $161,977 9 $175,116 APPLICATIONS APPROVED, NOT ACCEPTED 3 $189,870 1 $211,990 3 $238,650 APPLICATIONS DENIED 0 $0 0 $0 0 $0 APPLICATIONS WITHDRAWN 4 $109,515 0 $0 2 $139,055 FILES CLOSED FOR INCOMPLETENESS 1 $104,070 0 $0 1 $104,070
Aggregated Statistics For Year 2004(Based on 1 full and 1 partial tracts) A) Conventional B) Refinancings C) Non-occupant Loans on Number Average Value Number Average Value Number Average Value
LOANS ORIGINATED 16 $139,150 3 $147,057 10 $147,676 APPLICATIONS APPROVED, NOT ACCEPTED 2 $173,570 2 $172,935 3 $161,127 APPLICATIONS DENIED 0 $0 1 $115,630 0 $0 APPLICATIONS WITHDRAWN 1 $216,810 2 $189,640 1 $216,810 FILES CLOSED FOR INCOMPLETENESS 0 $0 0 $0 0 $0
Aggregated Statistics For Year 2003(Based on 1 full and 1 partial tracts) A) Conventional B) Refinancings C) Non-occupant Loans on Number Average Value Number Average Value Number Average Value
LOANS ORIGINATED 33 $142,859 14 $125,820 20 $166,988 APPLICATIONS APPROVED, NOT ACCEPTED 6 $132,313 6 $118,408 5 $143,384 APPLICATIONS DENIED 0 $0 0 $0 0 $0 APPLICATIONS WITHDRAWN 0 $0 0 $0 0 $0 FILES CLOSED FOR INCOMPLETENESS 0 $0 1 $76,840 0 $0
Aggregated Statistics For Year 2002(Based on 1 full and 1 partial tracts) A) Conventional B) Refinancings C) Non-occupant Loans on Number Average Value Number Average Value Number Average Value
LOANS ORIGINATED 24 $125,445 9 $109,418 10 $123,008 APPLICATIONS APPROVED, NOT ACCEPTED 4 $246,990 6 $128,412 1 $499,820 APPLICATIONS DENIED 0 $0 0 $0 0 $0 APPLICATIONS WITHDRAWN 1 $74,200 1 $87,690 0 $0 FILES CLOSED FOR INCOMPLETENESS 0 $0 0 $0 0 $0
Aggregated Statistics For Year 2001(Based on 1 full and 1 partial tracts) A) Conventional B) Refinancings C) Non-occupant Loans on Number Average Value Number Average Value Number Average Value
LOANS ORIGINATED 23 $139,310 11 $156,191 7 $155,829 APPLICATIONS APPROVED, NOT ACCEPTED 5 $134,374 5 $139,280 3 $89,677 APPLICATIONS DENIED 0 $0 1 $91,540 0 $0 APPLICATIONS WITHDRAWN 0 $0 1 $130,090 0 $0 FILES CLOSED FOR INCOMPLETENESS 0 $0 0 $0 0 $0
Aggregated Statistics For Year 2000(Based on 1 full and 1 partial tracts) A) Conventional B) Refinancings C) Non-occupant Loans on Number Average Value Number Average Value Number Average Value
LOANS ORIGINATED 12 $90,689 2 $101,285 6 $103,120 APPLICATIONS APPROVED, NOT ACCEPTED 6 $134,017 0 $0 2 $160,670 APPLICATIONS DENIED 0 $0 0 $0 0 $0 APPLICATIONS WITHDRAWN 0 $0 0 $0 0 $0 FILES CLOSED FOR INCOMPLETENESS 0 $0 0 $0 0 $0
Aggregated Statistics For Year 1999(Based on 2 partial tracts) A) Conventional B) Refinancings C) Non-occupant Loans on Number Average Value Number Average Value Number Average Value
LOANS ORIGINATED 21 $102,678 4 $79,918 4 $112,648 APPLICATIONS APPROVED, NOT ACCEPTED 0 $0 0 $0 0 $0 APPLICATIONS DENIED 1 $203,000 0 $0 0 $0 APPLICATIONS WITHDRAWN 0 $0 0 $0 0 $0 FILES CLOSED FOR INCOMPLETENESS 0 $0 0 $0 0 $0
Detailed PMIC statistics for the following Tracts:
0103.00
, 0104.00 Fire-safe hotels and motels in South Haven, Michigan:
Baymont Inn & Suites, 1555 Phoenix Rd, South Haven, Michigan 49090 Phone: (269) 639-9900, Fax: (269) 639-8068
Comfort Suites, 1743 Phoenix St, South Haven, Michigan 49090 Phone: (269) 639-2014, Fax: (269) 639-8961
Hampton Inn, 04299 Cecilia Dr, South Haven, Michigan 49090 Phone: (269) 639-8550, Fax: (269) 639-8555
All 3 fire-safe hotels and motels in South Haven, Michigan
Most common first names in South Haven, MI among deceased individuals Name Count Lived (average)
John 123 76.1 years Mary 109 78.6 years William 94 71.8 years Robert 94 72.8 years James 79 74.5 years Charles 79 73.9 years George 69 76.1 years Helen 56 81.2 years Frank 50 81.6 years Margaret 49 80.3 years
Most common last names in South Haven, MI among deceased individuals Last name Count Lived (average)
Smith 62 76.4 years Johnson 47 75.4 years Williams 39 68.0 years Brown 35 76.6 years Miller 24 74.8 years Davis 21 75.1 years Robinson 20 78.1 years Nelson 19 80.1 years Jones 19 74.8 years Anderson 18 76.0 years
South Haven compared to Michigan state average:
Median house value above state average. Unemployed percentage significantly below state average. Median age above state average. Foreign-born population percentage below state average. Length of stay since moving in significantly above state average. Institutionalized population percentage above state average. Number of college students below state average. Percentage of population with a bachelor's degree or higher above state average.
Top Patent Applicants
Joseph Lull (13)
Michael S. Seeley (10)
Matthew J. Petter (9)
Robert Tate (7)
Troy Molesworth (3)
Ryan W. Mill (2)
Kelley A. Mccloughan (2)
Vincent Brenner (2)
Bruce F. Linker (1)
Matthew Nibbelink (1)
Total of 63 patent applications in 2008-2024.
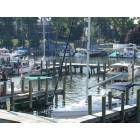
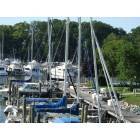
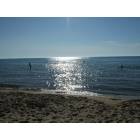
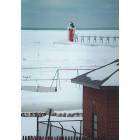
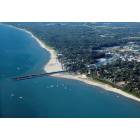

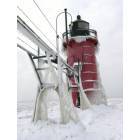
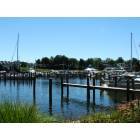
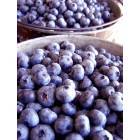
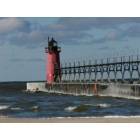
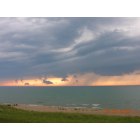
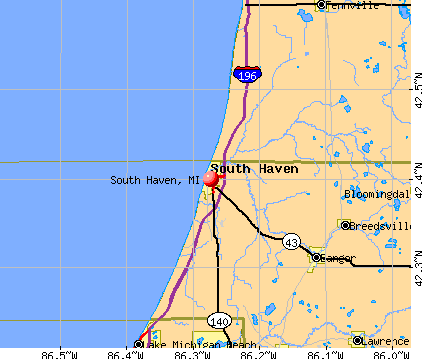


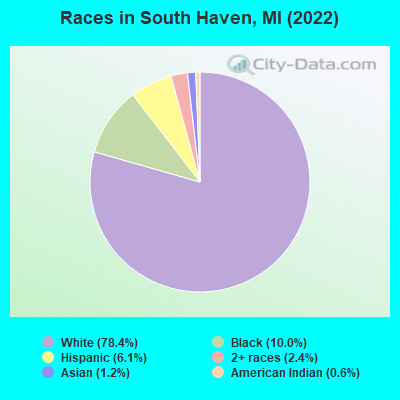
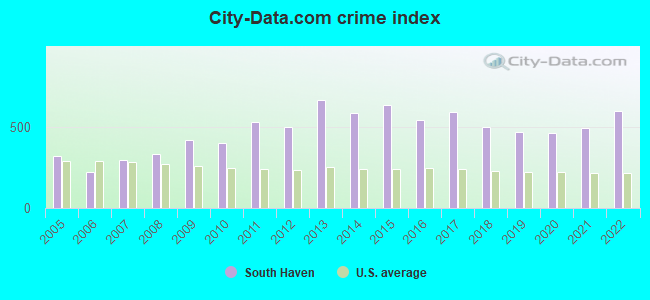
 Recent articles from our blog. Our writers, many of them Ph.D. graduates or candidates, create easy-to-read articles on a wide variety of topics.

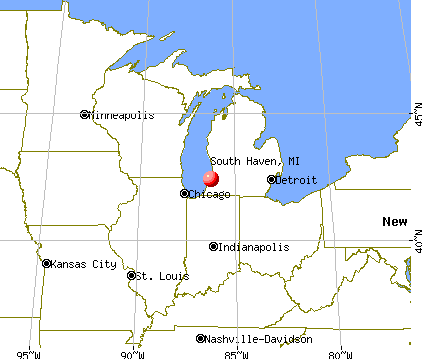
 (36.2 miles
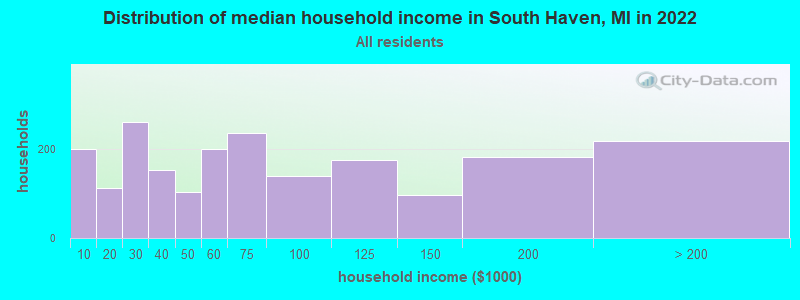
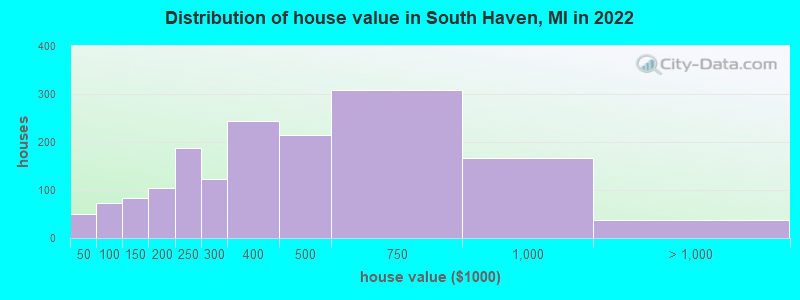
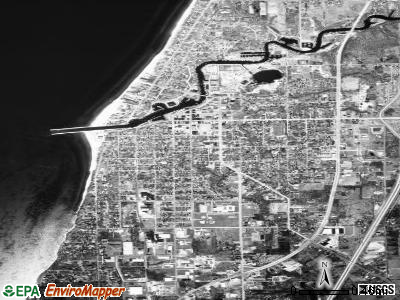
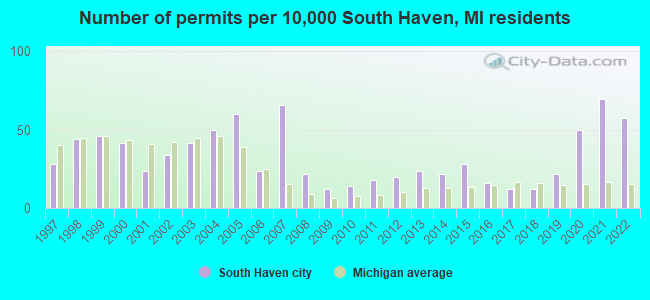
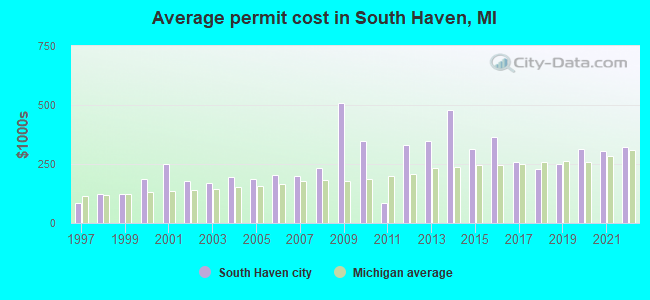
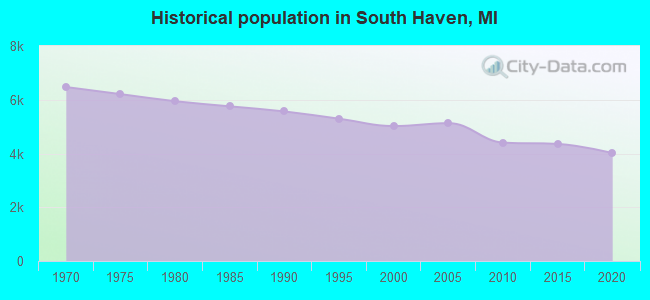
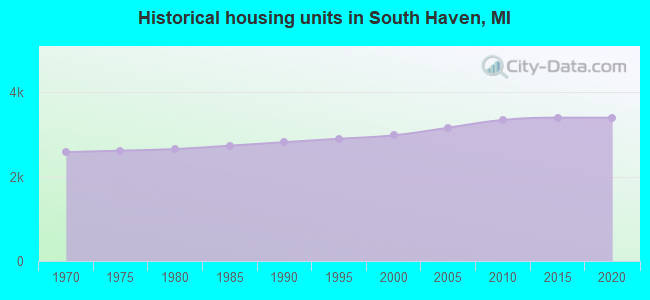
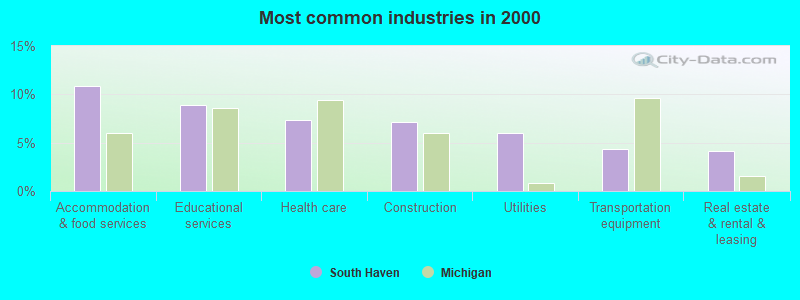
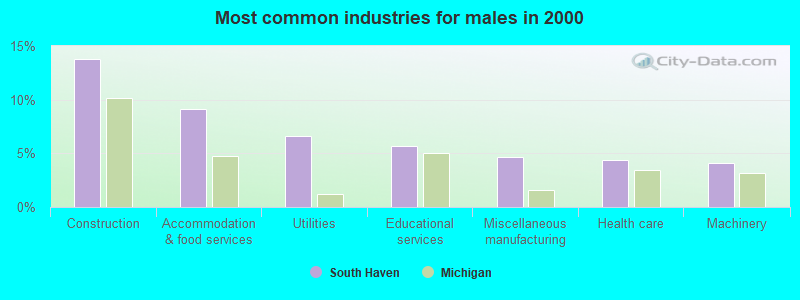
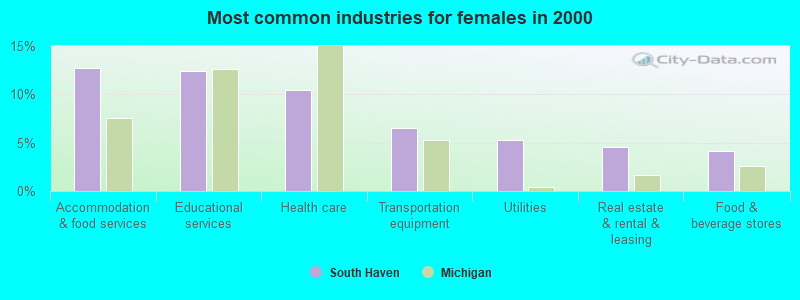
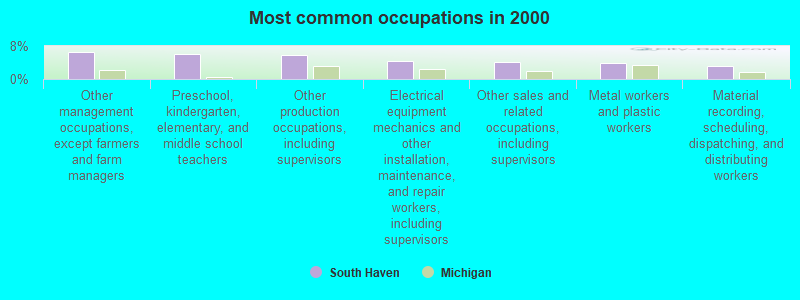
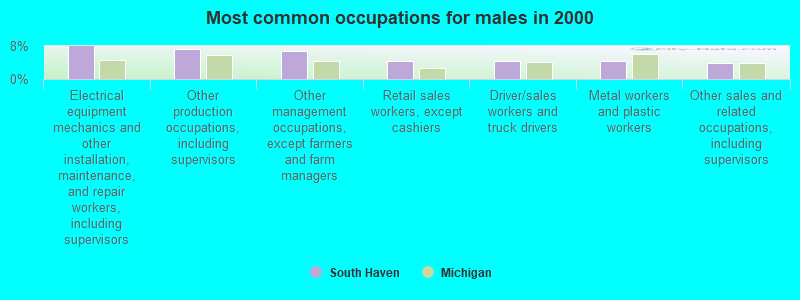
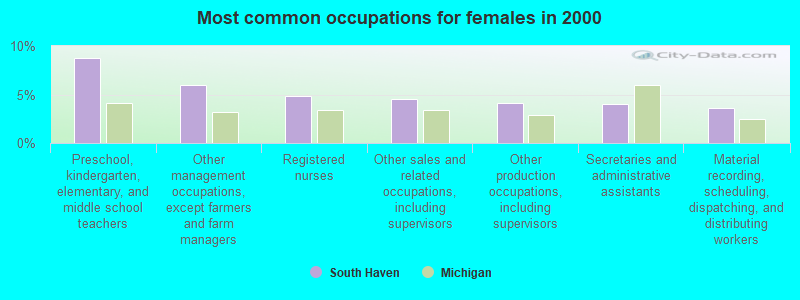
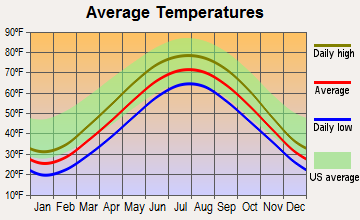
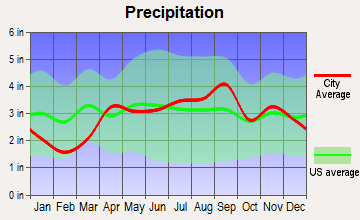
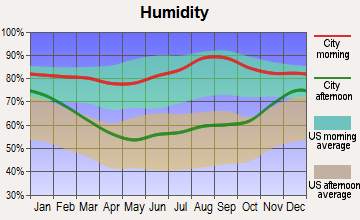
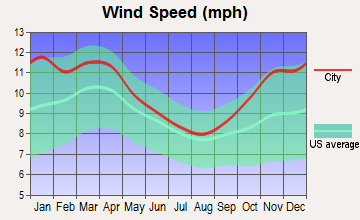
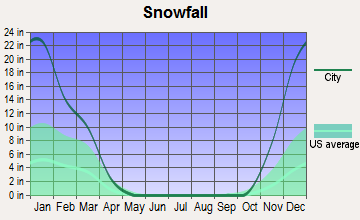
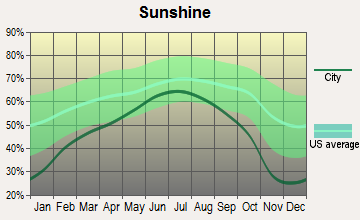
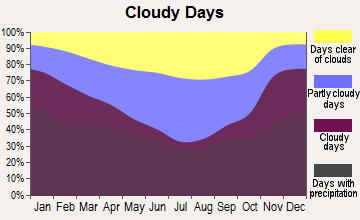


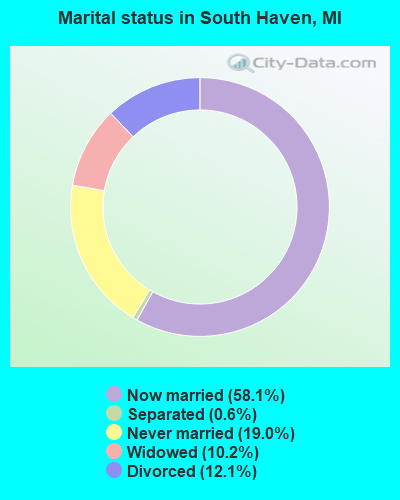
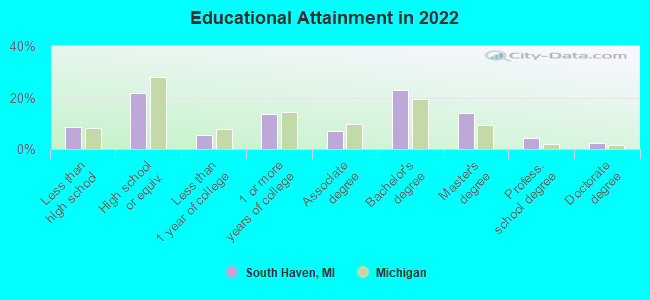
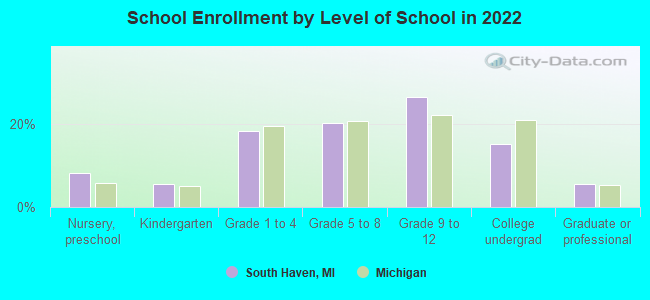
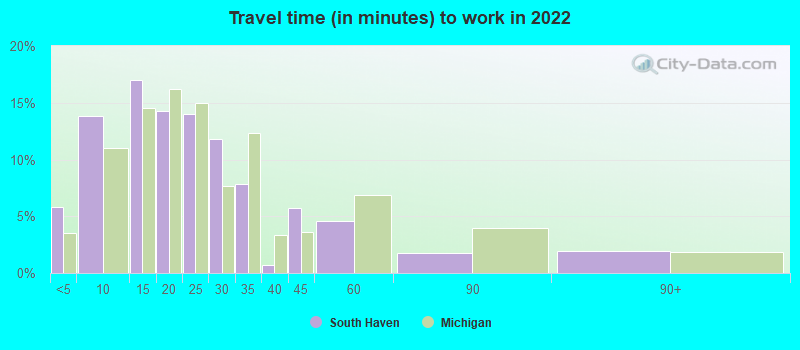
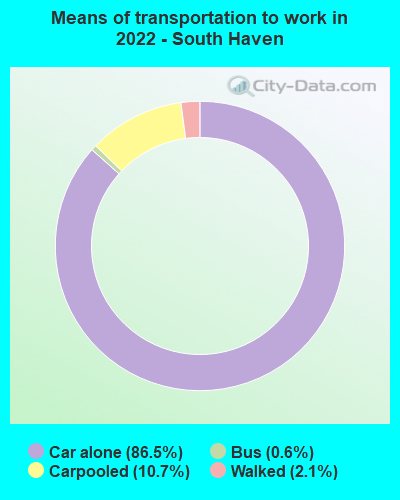
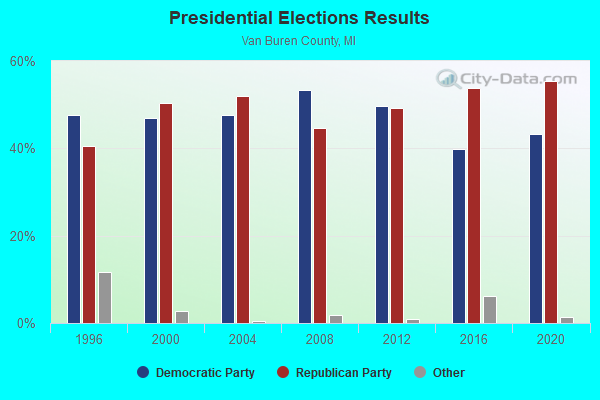
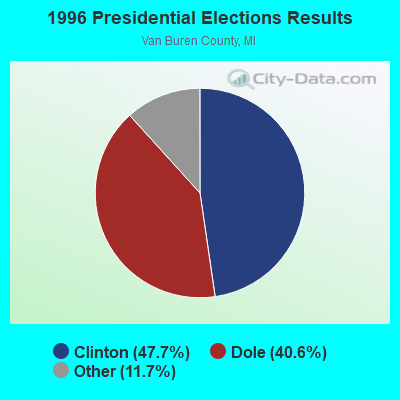
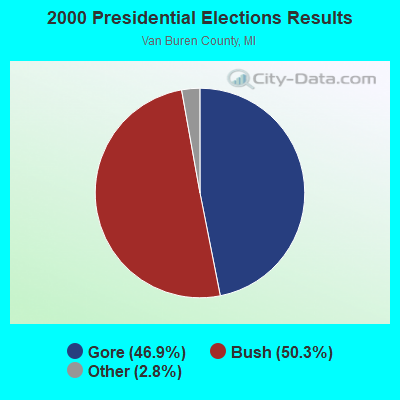
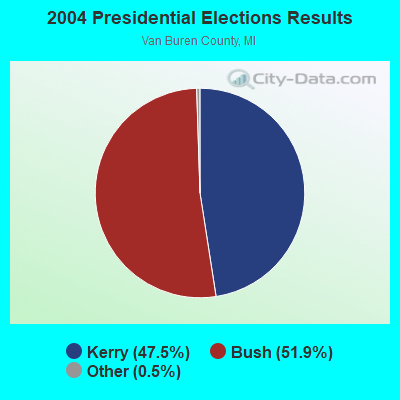
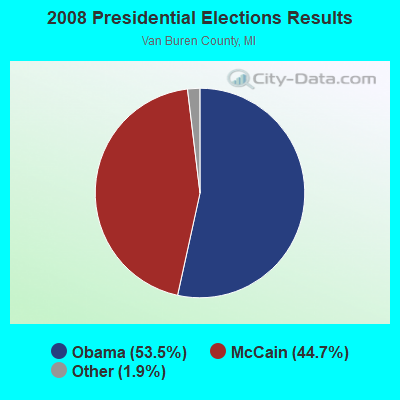
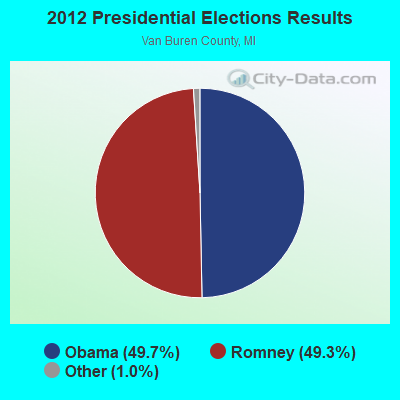
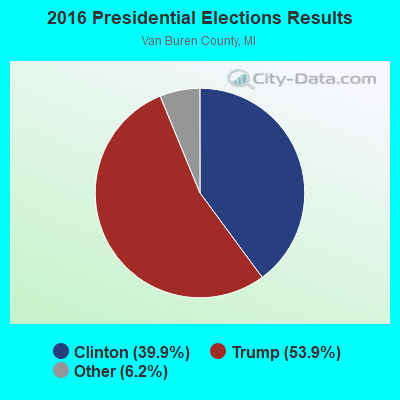
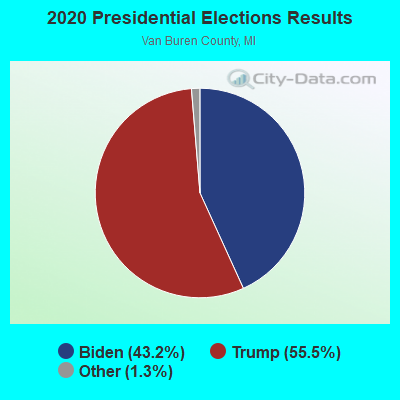
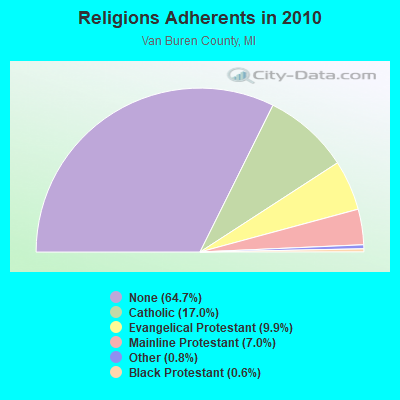
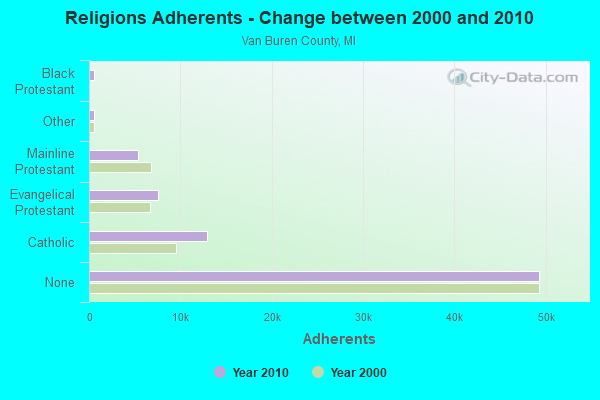
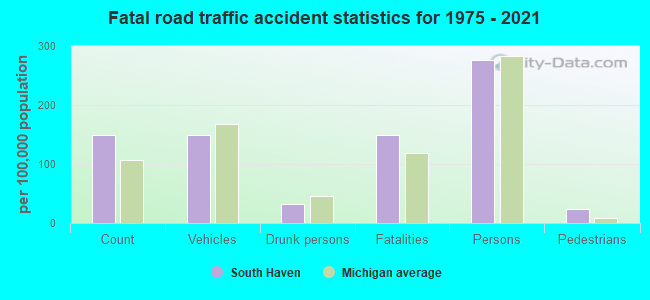
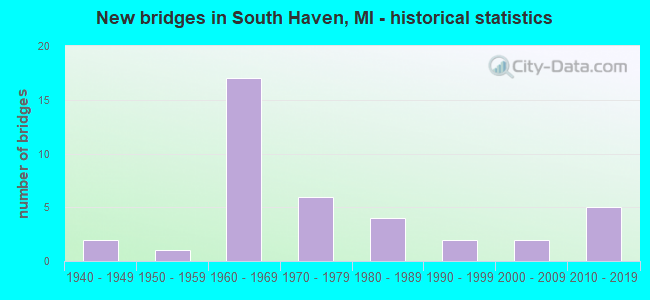
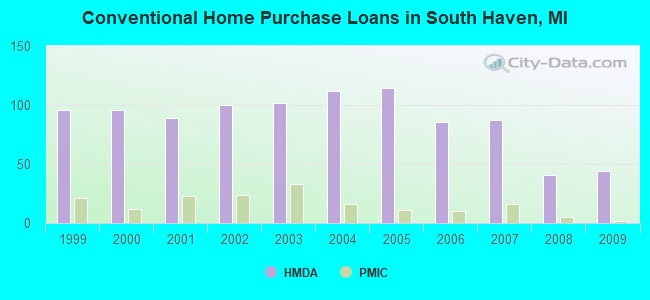
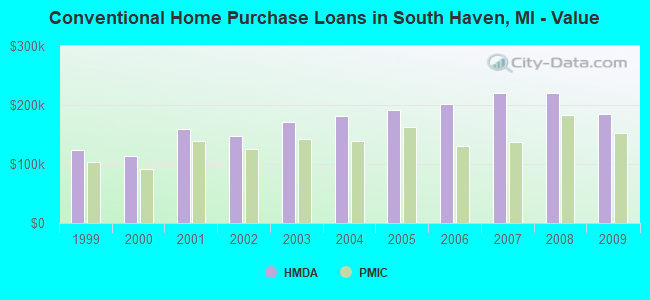
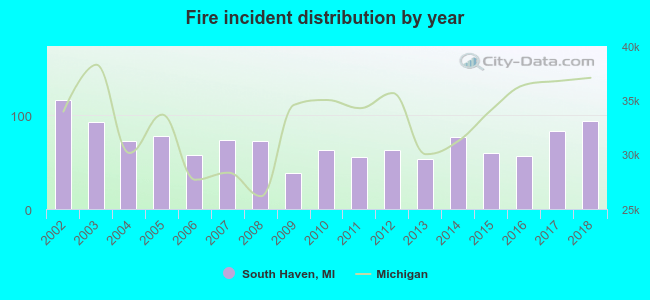 According to the data from the years 2002 - 2018 the average number of fires per year is 71. The highest number of fire incidents - 116 took place in 2002, and the least - 38 in 2009. The data has a dropping trend.
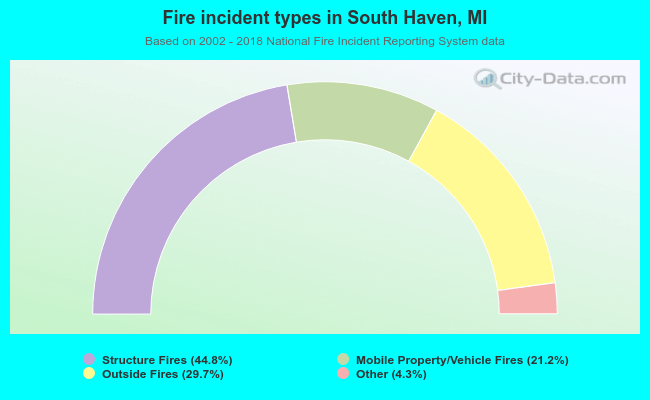 When looking into fire subcategories, the most reports belonged to: Structure Fires (44.8%), and Outside Fires (29.7%).