Estimated zip code population in 2022: 7,220 Zip code population in 2010: 7,248 Zip code population in 2000: 8,047
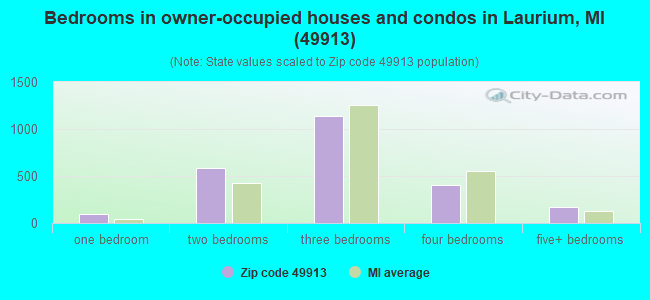
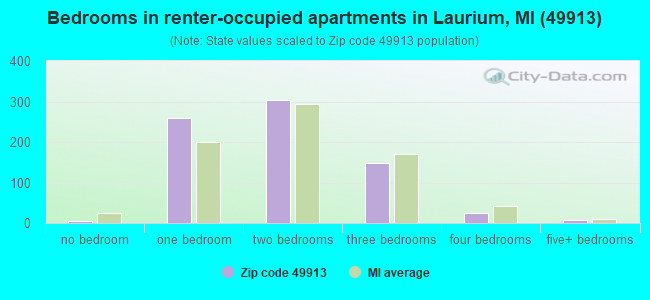
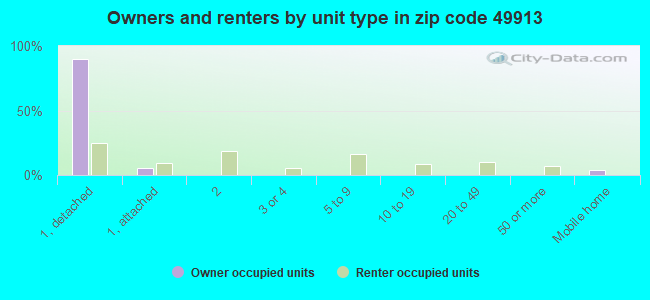
Houses and condos: 3,941 Renter-occupied apartments: 739
% of renters here:
24%
State:
27%
March 2022 cost of living index in zip code 49913: 74.2 (low, U.S. average is 100)
Land area: 70.1 sq. mi. Water area: 1.6 sq. mi.
Population density: 103 people per square mile
(very low).
OSM Map
General Map
Google Map
MSN Map
OSM Map
General Map
Google Map
MSN Map
OSM Map
General Map
Google Map
MSN Map
OSM Map
General Map
Google Map
MSN Map
Please wait while loading the map...
Real estate property taxes paid for housing units in 2022:
This zip code:
1.1% ($1,070)
Michigan:
1.2% ($2,746)
Median real estate property taxes paid for housing units with mortgages in 2022: $1,299 (1.3%) Median real estate property taxes paid for housing units with no mortgage in 2022: $920 (1.1%)
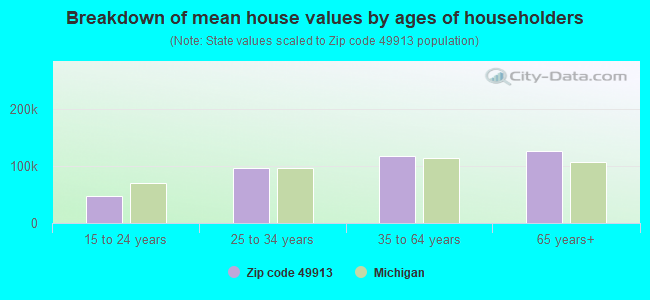
Estimated median house/condo value in 2022: $93,621
49913:
$93,621
Michigan:
$224,400
According to our research of Michigan and other state lists, there were 16 registered sex offenders living in 49913 zip code as of April 27, 2024. The ratio of all residents to sex offenders in zip code 49913 is 458 to 1. The ratio of registered sex offenders to all residents in this zip code is lower than the state average.
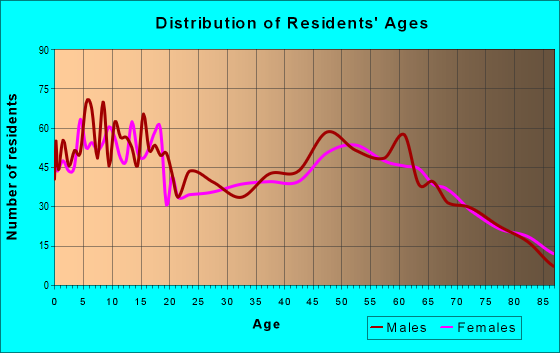
Median resident age:
This zip code:
43.1 years
Michigan median age:
40.3 years
Average household size:
This zip code:
2.3 people
Michigan:
2.4 people
Averages for the 2020 tax year for zip code 49913, filed in 2021:
Average Adjusted Gross Income (AGI) in 2020: $47,101 (Individual Income Tax Returns)
Here:
$47,101
State:
$68,945
Salary/wage: $39,222 (reported on 77.1% of returns)
Here:
$39,222
State:
$57,142
(% of AGI for various income ranges: 1050.8% for AGIs below $25k, 3208.1% for AGIs $25k-50k, 5781.4% for AGIs $50k-75k, 7898.1% for AGIs $75k-100k, 12636.5% for AGIs $100k-200k)
Taxable interest for individuals: $812 (reported on 27.3% of returns)
This zip code:
$812
Michigan:
$1,630
(% of AGI for various income ranges: 8.2% for AGIs below $25k, 21.1% for AGIs $25k-50k, 37.3% for AGIs $50k-75k, 40.0% for AGIs $75k-100k, 95.3% for AGIs $100k-200k)
Ordinary dividends: $4,395 (reported on 17.3% of returns)
Here:
$4,395
State:
$6,972
(% of AGI for various income ranges: 18.2% for AGIs below $25k, 31.2% for AGIs $25k-50k, 109.2% for AGIs $50k-75k, 302.4% for AGIs $75k-100k, 277.1% for AGIs $100k-200k)
Net capital gain/loss in AGI: +$9,904 (reported on 13.8% of returns)
Here:
+$9,904
State:
+$20,064
(% of AGI for various income ranges: 14.0% for AGIs below $25k, 33.5% for AGIs $25k-50k, 97.0% for AGIs $50k-75k, 147.6% for AGIs $75k-100k, 394.7% for AGIs $100k-200k)
Profit/loss from business: +$9,460 (reported on 11.7% of returns)
Here:
+$9,460
State:
+$11,172
(% of AGI for various income ranges: 70.6% for AGIs below $25k, 70.0% for AGIs $25k-50k, 224.6% for AGIs $50k-75k, 204.8% for AGIs $75k-100k, 574.1% for AGIs $100k-200k)
Taxable individual retirement arrangement distribution: $15,514 (reported on 10.6% of returns)
49913:
$15,514
Michigan:
$19,803
(% of AGI for various income ranges: 77.1% for AGIs below $25k, 141.9% for AGIs $25k-50k, 245.4% for AGIs $50k-75k, 436.7% for AGIs $75k-100k, 1165.9% for AGIs $100k-200k)
Total itemized deductions: $33,557 (reported on 2.1% of returns)
Here:
$33,557
State:
$34,117
(% of AGI for various income ranges: 140.8% for AGIs $25k-50k, 785.3% for AGIs $100k-200k)
Charity contributions: $9,800 (reported on 1.5% of returns)
Here:
$9,800
State:
$13,548
(% of AGI for various income ranges: 18.3% for AGIs below $25k, 182.9% for AGIs $100k-200k)
Taxes paid: $6,850 (reported on 1.8% of returns)
49913:
$6,850
State:
$7,972
(% of AGI for various income ranges: 19.9% for AGIs $25k-50k, 157.6% for AGIs $100k-200k)
Earned income credit: $1,993 (reported on 16.7% of returns)
Here:
$1,993
State:
$2,251
(% of AGI for various income ranges: 69.8% for AGIs below $25k, 62.8% for AGIs $25k-50k)
Percentage of individuals using paid preparers for their 2020 taxes: 93.0%
Here:
93%
State:
93%
(% for various income ranges: 92.0% for AGIs below $25k, 94.6% for AGIs $25k-50k, 90.2% for AGIs $50k-75k, 96.4% for AGIs $75k-100k, 92.3% for AGIs $100k-200k, 100.0% for AGIs over 200k)
Averages for the 2012 tax year for zip code 49913, filed in 2013:
Average Adjusted Gross Income (AGI) in 2012: $37,392 (Individual Income Tax Returns)
Here:
$37,392
State:
$55,609
Salary/wage: $31,572 (reported on 80.1% of returns)
Here:
$31,572
State:
$46,782
(% of AGI for various income ranges: 70.2% for AGIs below $25k, 70.2% for AGIs $25k-50k, 74.0% for AGIs $50k-75k, 67.4% for AGIs $75k-100k, 71.0% for AGIs $100k-200k, 39.7% for AGIs over 200k)
Taxable interest for individuals: $1,115 (reported on 37.6% of returns)
This zip code:
$1,115
Michigan:
$1,491
(% of AGI for various income ranges: 1.5% for AGIs below $25k, 1.3% for AGIs $25k-50k, 0.9% for AGIs $50k-75k, 1.0% for AGIs $75k-100k, 1.0% for AGIs $100k-200k, 0.8% for AGIs over 200k)
Ordinary dividends: $4,549 (reported on 19.6% of returns)
Here:
$4,549
State:
$6,225
(% of AGI for various income ranges: 1.5% for AGIs below $25k, 1.3% for AGIs $25k-50k, 1.9% for AGIs $50k-75k, 2.1% for AGIs $75k-100k, 2.7% for AGIs $100k-200k, 7.3% for AGIs over 200k)
Net capital gain/loss in AGI: +$5,630 (reported on 11.5% of returns)
Here:
+$5,630
State:
+$9,326
(% of AGI for various income ranges: 0.2% for AGIs $25k-50k, 0.8% for AGIs $50k-75k, 0.9% for AGIs $75k-100k, 10.7% for AGIs $100k-200k)
Profit/loss from business: +$8,717 (reported on 13.0% of returns)
Here:
+$8,717
State:
+$11,523
(% of AGI for various income ranges: 4.3% for AGIs below $25k, 3.6% for AGIs $25k-50k, 2.1% for AGIs $50k-75k, 3.2% for AGIs $75k-100k, 4.4% for AGIs $100k-200k)
Taxable individual retirement arrangement distribution: $9,950 (reported on 13.0% of returns)
49913:
$9,950
Michigan:
$15,298
(% of AGI for various income ranges: 3.8% for AGIs below $25k, 3.8% for AGIs $25k-50k, 3.0% for AGIs $50k-75k, 4.7% for AGIs $75k-100k, 4.6% for AGIs $100k-200k)
Total itemized deductions: $19,785 (20% of AGI, reported on 10.2% of returns)
Here:
$19,785
State:
$21,628
Here:
20.3% of AGI
State:
18.4% of AGI
(% of AGI for various income ranges: 4.1% for AGIs below $25k, 4.1% for AGIs $25k-50k, 4.0% for AGIs $50k-75k, 5.4% for AGIs $75k-100k, 7.8% for AGIs $100k-200k, 10.4% for AGIs over 200k)
Charity contributions: $3,044 (reported on 7.8% of returns)
Here:
$3,044
State:
$4,225
(% of AGI for various income ranges: 0.1% for AGIs below $25k, 0.6% for AGIs $25k-50k, 0.3% for AGIs $50k-75k, 0.7% for AGIs $75k-100k, 1.1% for AGIs $100k-200k, 1.4% for AGIs over 200k)
Taxes paid: $6,338 (reported on 9.9% of returns)
49913:
$6,338
State:
$8,327
(% of AGI for various income ranges: 0.5% for AGIs below $25k, 0.7% for AGIs $25k-50k, 1.3% for AGIs $50k-75k, 1.9% for AGIs $75k-100k, 3.4% for AGIs $100k-200k, 4.2% for AGIs over 200k)
Earned income credit: $1,889 (reported on 21.7% of returns)
Here:
$1,889
State:
$2,306
(% of AGI for various income ranges: 5.3% for AGIs below $25k, 1.2% for AGIs $25k-50k)
Percentage of individuals using paid preparers for their 2012 taxes: 43.8%
Here:
44%
State:
57%
(% for various income ranges: 38.1% for AGIs below $25k, 43.8% for AGIs $25k-50k, 52.3% for AGIs $50k-75k, 59.1% for AGIs $75k-100k, 53.8% for AGIs $100k-200k, 66.7% for AGIs over 200k)
Averages for the 2004 tax year for zip code 49913, filed in 2005:
Average Adjusted Gross Income (AGI) in 2004: $30,088 (Individual Income Tax Returns)
Here:
$30,088
State:
$48,204
Salary/wage: $26,259 (reported on 82.4% of returns)
Here:
$26,259
State:
$42,791
(% of AGI for various income ranges: 95.4% for AGIs below $10k, 71.9% for AGIs $10k-25k, 75.7% for AGIs $25k-50k, 76.7% for AGIs $50k-75k, 69.4% for AGIs $75k-100k, 50.5% for AGIs over 100k)
Taxable interest for individuals: $1,354 (reported on 47.9% of returns)
This zip code:
$1,354
Michigan:
$1,725
(% of AGI for various income ranges: 6.2% for AGIs below $10k, 2.7% for AGIs $10k-25k, 1.8% for AGIs $25k-50k, 1.7% for AGIs $50k-75k, 2.3% for AGIs $75k-100k, 1.8% for AGIs over 100k)
Taxable dividends: $3,314 (reported on 23.8% of returns)
Here:
$3,314
State:
$3,420
(% of AGI for various income ranges: 2.9% for AGIs below $10k, 1.9% for AGIs $10k-25k, 1.7% for AGIs $25k-50k, 1.8% for AGIs $50k-75k, 3.4% for AGIs $75k-100k, 6.3% for AGIs over 100k)
Net capital gain/loss: +$3,503 (reported on 15.8% of returns)
Here:
+$3,503
State:
+$8,532
(% of AGI for various income ranges: -0.5% for AGIs below $10k, 0.0% for AGIs $10k-25k, 0.8% for AGIs $25k-50k, 1.0% for AGIs $50k-75k, 2.6% for AGIs $75k-100k, 7.8% for AGIs over 100k)
Profit/loss from business: +$6,469 (reported on 13.1% of returns)
Here:
+$6,469
State:
+$9,547
(% of AGI for various income ranges: 0.9% for AGIs below $10k, 2.9% for AGIs $10k-25k, 2.7% for AGIs $25k-50k, 1.7% for AGIs $50k-75k, 3.1% for AGIs $75k-100k, 5.1% for AGIs over 100k)
Profit/loss from farming: +$400 (reported on 0.3% of returns)
Here:
+$400
State:
-$4,492
IRA payment deduction: $3,067 (reported on 3.3% of returns)
49913:
$3,067
Michigan:
$2,875
Self-employed pension: $6,688 (reported on 0.5% of returns)
Here:
$6,688
Michigan:
$13,826
Total itemized deductions: $16,802 (22% of AGI, reported on 9.5% of returns)
Here:
$16,802
State:
$18,509
Here:
21.5% of AGI
State:
20.7% of AGI
(% of AGI for various income ranges: 5.8% for AGIs below $10k, 2.0% for AGIs $10k-25k, 3.0% for AGIs $25k-50k, 4.7% for AGIs $50k-75k, 10.9% for AGIs $75k-100k, 10.6% for AGIs over 100k)
Charity contributions deductions: $3,462 (5% of AGI, reported on 8.2% of returns)
Here:
$3,462
State:
$3,365
Here:
4.5% of AGI
State:
3.6% of AGI
(% of AGI for various income ranges: 0.3% for AGIs $10k-25k, 0.4% for AGIs $25k-50k, 0.9% for AGIs $50k-75k, 2.4% for AGIs $75k-100k, 2.2% for AGIs over 100k)
Total tax: $3,619 (reported on 66.2% of returns)
49913:
$3,619
State:
$7,691
(% of AGI for various income ranges: 1.7% for AGIs below $10k, 3.7% for AGIs $10k-25k, 6.0% for AGIs $25k-50k, 8.1% for AGIs $50k-75k, 10.4% for AGIs $75k-100k, 16.9% for AGIs over 100k)
Earned income credit: $1,619 (reported on 18.1% of returns)
Here:
$1,619
State:
$1,737
Percentage of individuals using paid preparers for their 2004 taxes: 45.9%
Here:
46%
State:
60%
(% for various income ranges: 38.3% for AGIs below $10k, 46.7% for AGIs $10k-25k, 49.0% for AGIs $25k-50k, 47.1% for AGIs $50k-75k, 55.6% for AGIs $75k-100k, 68.5% for AGIs over 100k)
Household received Food Stamps/SNAP in the past 12 months: 546 Household did not receive Food Stamps/SNAP in the past 12 months: 2,599
Women who had a birth in the past 12 months: 47 (40 now married, 8 unmarried) Women who did not have a birth in the past 12 months: 1,535 (668 now married, 865 unmarried)
Housing units in zip code 49913 with a mortgage: 1,091 (99 second mortgage, 88 both second mortgage and home equity loan) Houses without a mortgage: 10
Median monthly owner costs for units with a mortgage: $870 Median monthly owner costs for units without a mortgage: $410
Residents with income below the poverty level in 2022:
This zip code:
16.6%
Whole state:
13.4%
Residents with income below 50% of the poverty level in 2022:
This zip code:
9.2%
Whole state:
6.9%
Median number of rooms in houses and condos:
Here:
6.4
State:
6.5
Median number of rooms in apartments:
Here:
4.6
State:
4.3
Notable locations in this zip code not listed on our city pages
Notable locations in zip code 49913: Calumet Golf Club (A), Tamarack Waterworks (B), Calumet Waterworks (C), Upper Peninsula Firefighters Museum (D), Laurium Village Police Station (E), Laurium Fire Department (F), Coppertown USA Mining Museum (G), Calumet Public Library (H), Calumet Police Department (I), Calumet Township Fire and Rescue (J), Mercy Emergency Medical Services Calumet (K). Display/hide their locations on the map
Churches in zip code 49913 include: Laurium United Methodist Church (A), Apostolic Lutheran Church (B), Saint Paul Lutheran Church (C), Lake Linden Avenue Gospel Hall (D), Grace Christian Fellowship (E), Sacred Heart Church (F), Faith Lutheran Church (G), Calumet United Methodist Church (H), Community Church of Christ (I). Display/hide their locations on the map
Cemeteries: Calvary Cemetery (1), Hecla Cemetery (2), Lakeview Cemetery (3), Centennial Cemetery (4), Maple Hill Cemetery (5). Display/hide their locations on the map
Creeks: Fulton Creek (A), Gardeners Creek (B), Begunn Creek (C), Finey Creek (D), Hills Creek (E), Black Creek (F), Brewery Creek (G), Slaughterhouse Creek (H), Sevenmile Creek (I). Display/hide their locations on the map
Parks in zip code 49913 include: Agassiz Park (1), Copper Country Historical Marker (2), Calumet Theater Historical Marker (3), Italian Hall Historical Marker (4), Saint Paul the Apostle Church Historical Marker (5), Suomi Synod Historical Marker (6). Display/hide their locations on the map
In group quarters: 23 (-1 institutionalized population)
Size of family households: 874 2-persons, 482 3-persons, 237 4-persons, 110 5-persons, 40 6-persons, 61 7-or-more-persons
Size of nonfamily households: 1,078 1-person, 256 2-persons, 2 4-persons
1,000 married couples with children.
421 single-parent households (76 men, 345 women).
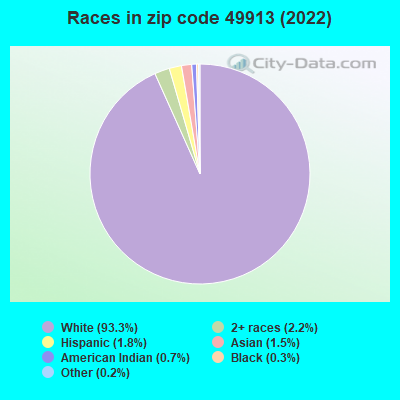
93.8% of residents of 49913 zip code speak English at home.
1.5% of residents speak Spanish at home (72% very well, 28% well).
1.8% of residents speak other Indo-European language at home (65% very well, 3% well, 32% not well).
1.5% of residents speak Asian or Pacific Island language at home (25% very well, 26% well, 48% not well).
1.5% of residents speak other language at home (44% very well, 30% well, 26% not at all).
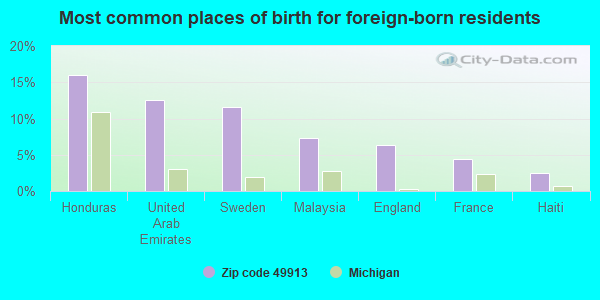
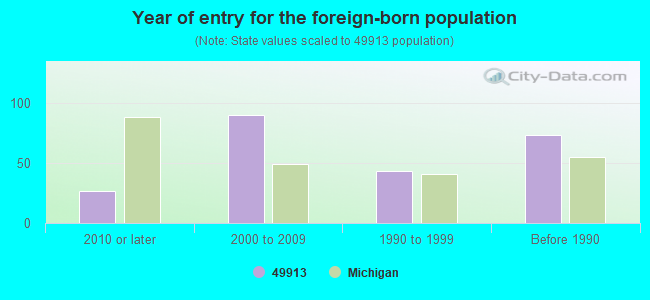
Foreign born population: 208 (2.9%) (66.9% of them are naturalized citizens)
This zip code:
2.9%
Whole state:
6.9%
16%Honduras
13%United Arab Emirates
12%Sweden
7%Malaysia
6%England
4%France
2%Haiti
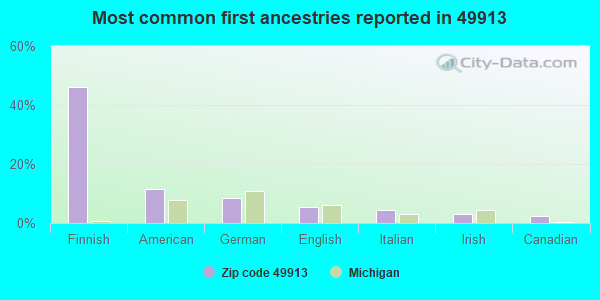
46%Finnish
11%American
9%German
5%English
4%Italian
3%Irish
2%Canadian
Year of entry for the foreign-born population
272010 or later
902000 to 2009
431990 to 1999
73Before 1990
Facilities with environmental interests located in this zip code:
AMERITECH CORP (USAF STATION 157 L R RADAR in CALUMET, MI)
(Resource Conservation and Recovery Act (tracking hazardous waste))
MI DEPT/MILITARY & VETERANS AFFAIRS (110 RED JACKET RD in CALUMET, MI) . Federal Facility. DEPARTMENT OF VETERANS AFFAIRS
Conditionally Exempt Small Quantity Generators, less than 100 kg/month of hazardous waste (Resource Conservation and Recovery Act (tracking hazardous waste)) Organizations: MICHIGAN STATE OF (CONTACT/OWNER)
Alternative names: CALUMET ARMORY, MI DEPT/MILITARY AFFAIRS CALUMET ARMORY
GASOLINE ALLEY (56 3RD ST in LAURIUM, MI)
(Resource Conservation and Recovery Act (tracking hazardous waste))
DISCOUNT AUTO REPAIR (412 PINE ST in CALUMET, MI)
Conditionally Exempt Small Quantity Generators, less than 100 kg/month of hazardous waste (Resource Conservation and Recovery Act (tracking hazardous waste)) - notification Organizations: CHRIS SHOOK (CONTACT/OWNER)
, RON WHITE (PROP OWNER) (CONTACT/OWNER)
AALTO WOODWORKING (26737 PEPIN ROAD in CALUMET, MI)
Conditionally Exempt Small Quantity Generators, less than 100 kg/month of hazardous waste (Resource Conservation and Recovery Act (tracking hazardous waste))
GASOLINE ALLEY SERVICES (300 ISLE ROYALE ST in LAURIUM, MI)
Conditionally Exempt Small Quantity Generators, less than 100 kg/month of hazardous waste (Resource Conservation and Recovery Act (tracking hazardous waste)) - notification Organizations: KURT HAMLIN (CONTACT/OWNER)
GENES ENGINE RPR (400 LAKE LINDEN AVE in LAURIUM, MI)
Conditionally Exempt Small Quantity Generators, less than 100 kg/month of hazardous waste (Resource Conservation and Recovery Act (tracking hazardous waste)) - notification
GREENLEE PRINTING (423 PINE ST in CALUMET, MI)
Conditionally Exempt Small Quantity Generators, less than 100 kg/month of hazardous waste (Resource Conservation and Recovery Act (tracking hazardous waste)) - notification Organizations: MARC NORTON (CONTACT/OWNER)
Housing units lacking complete plumbing facilities: 2.5% Housing units lacking complete kitchen facilities: 0.8%
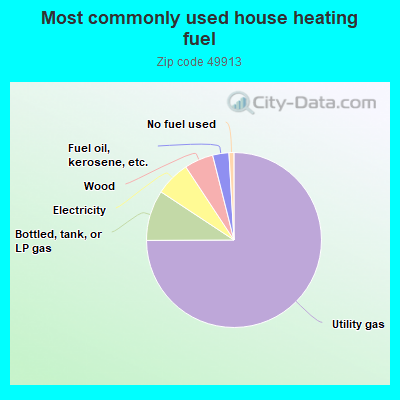
74.4%Utility gas
9.3%Bottled, tank, or LP gas
6.4%Electricity
5.3%Wood
3.0%Fuel oil, kerosene, etc.
0.9%No fuel used
Population in 1990: 7,656. Population change in the 1990s: +391 (+5.1%).
Place of birth for U.S.-born residents:
This state: 5,858
Northeast: 117
Midwest: 668
South: 169
West: 163
66% of the 49913 zip code residents lived in the same house 5 years ago. Out of people who lived in different houses, 54% lived in this county. Out of people who lived in different counties, 50% lived in Michigan.
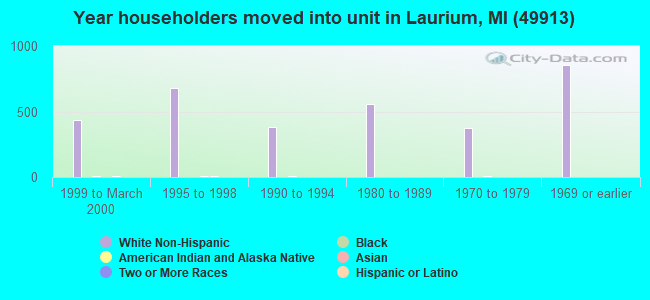
92% of the 49913 zip code residents lived in the same house 1 year ago. Out of people who lived in different houses, 35% moved from this county. Out of people who lived in different houses, 41% moved from different county within same state. Out of people who lived in different houses, 24% moved from different state. Out of people who lived in different houses, 3% moved from abroad.
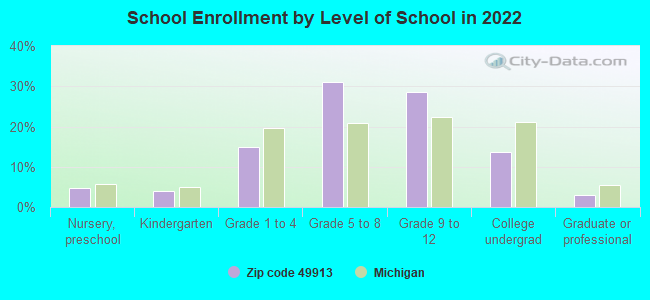
Private vs. public school enrollment:
Students in private schools in grades 1 to 8 (elementary and middle school): 79
Here:
11.7%
Michigan:
12.4%
Students in private schools in grades 9 to 12 (high school): 8
Here:
2.1%
Michigan:
9.8%
Students in private undergraduate colleges: 30
Here:
15.2%
Michigan:
14.9%
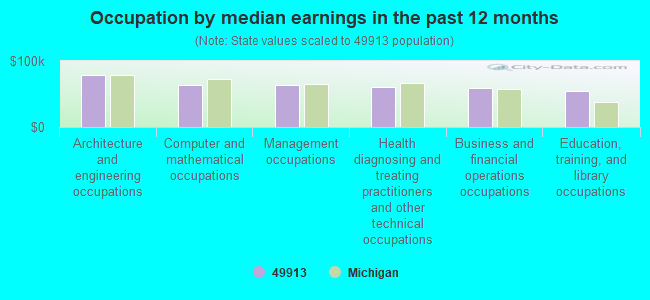
Occupation by median earnings in the past 12 months ($)
78,822Architecture and engineering occupations
63,751Computer and mathematical occupations
63,460Management occupations
60,681Health diagnosing and treating practitioners and other technical occupations
59,282Business and financial operations occupations
53,996Education, training, and library occupations
Companies with federal contracts located in this zip code:
THERMOANALYTICS, INC (23440 AIRPARK BLVD in CALUMET, MI; small business) : $17,514,591 in 88 contractsfrom 1999 to 2006
Contracts for Defense Tank - Automotive -- Basic Research (R&D), Other Defense -- Applied Research and Exploratory Development (R&D), Other Research and Development -- Basic Research (R&D), Defense Tank - Automotive -- Applied Research and Exploratory Development (R&D), and moreby Army, Navy, Air Force, NASA, and others Signed by year:2000: $404,921; 2001: $1,759,573; 2002: $2,938,746; 2003: $3,079,740; 2004: $5,550,966; 2005: $2,653,332; 2006: $682,478.
Biggest contracts:
$2,695,000 with Army for Defense Tank - Automotive -- Basic Research (R&D). Signed on 2004-03-31. Completion date: 2006-03-31.
$1,893,000, same as above.Signed on 2004-12-15. Completion date: 2004-03-11.
$760,730, same as above.Signed on 2003-08-22. Completion date: 2004-12-31.
$740,971 with Navy for Other Defense -- Applied Research and Exploratory Development (R&D). Signed on 2002-03-25. Completion date: 2004-03-31.
SIGNATURE RESEARCH, INC (56905 CALUMET AVE in CALUMET, MI; small business) : $4,325,284 in 43 contractsfrom 1999 to 2006
Contracts for Other Defense -- Applied Research and Exploratory Development (R&D), Guided Missile Components, Engineering and Technical Services, Other Research and Development -- Basic Research (R&D), and moreby Army, Federal Technology Service, Navy Signed by year:2000: $269,078; 2001: $0; 2002: $285,602; 2003: $471,804; 2004: $1,483,022; 2005: $845,556; 2006: $857,643.
Biggest contracts:
$645,000 with Army for Other Defense -- Applied Research and Exploratory Development (R&D). Signed on 2004-10-27. Completion date: 2004-09-30.
$480,000, same as above.Signed on 2006-03-09. Completion date: 2004-09-30.
$346,000, same as above.Signed on 2004-01-20. Completion date: 2004-09-30.
$305,000, same as above.Signed on 2006-03-13. Completion date: 2004-09-30.
GRIFFITH WILDLIFE BIOLOGY (304 M-203 in CALUMET, MI; small business) : $1,265,693 in 16 contractsfrom 2000 to 2004
Contracts for Endangered Species Studies - Plant and Animal, Invalid code: AH97, Other Environmental Services, Studies, and Analytical Support, Wildlife Studies, and moreby Navy, U.S. Fish and Wildlife Service, Bureau of Reclamation Signed by year:2000: $296,960; 2001: $190,140; 2002: $505,540; 2003: $87,400; 2004: $185,653; 2005: $0; 2006: $0.
Biggest contracts:
$275,000 with Navy for Endangered Species Studies - Plant and Animal. Taking place in CA. Signed on 2002-09-25. Completion date: 2003-09-30.
$143,140 with Navy for Invalid code: AH97. Taking place in CA. Signed on 2002-10-01. Completion date: 2004-03-31.
$143,140, same as above.Signed on 2001-05-03. Completion date: 2004-03-31.
$94,500, same as above.Signed on 2004-03-30. Completion date: 2005-03-31.
AEROPHYSICS, INC (30981 WOODBUSH ROAD in CALUMET, MI; small business) : $201,225 in 4 contractsfrom 2001 to 2004
$99,725 with Air Force for Defense Missile and Space Systems -- Applied Research and Exploratory Development (R&D). Signed on 2004-04-23. Completion date: 2005-01-26.
$75,000 with National Institute of Standards and Technology for Physical Sciences -- Advanced Development (R&D). Signed on 2003-07-15. Completion date: 2004-02-15.
$26,500 with Air Force for Switches. Signed on 2001-01-24. Completion date: 2001-01-04.
$0, same as above.Signed on 2001-01-24. Completion date: 2001-01-04.
M Q OPERATING COMPANY (416 6TH ST in CALUMET, MI; small business) : $7,030 in 2 contractsin 2005
$4,230 with National Park Service for Maintenance, Repair and Rebuilding of Equipment -- Ship and Marine Equipment. Signed on 2005-01-25. Completion date: 2005-04-15.
$2,800 with Defense Logistics Agency for Lubrication and Fuel Dispensing Equipment. Signed on 2005-02-03. Completion date: 2005-04-04.
CARLSON, DAYNA (59178 HWY US 41 in CALUMET, MI; small business)
$551 with Army for Other Housekeeping Services. Signed on 2004-01-01. Completion date: 2004-06-30.
INK TECHNOLOGIES INC (436 HECLA STREET in LAURIUM, MI; small business) : $1 in 2 contractsin 2004
$1 with Navy for Other Environmental Protection -- Advanced Development (R&D). Taking place in HI. Signed on 2004-05-03. Completion date: 2004-03-15.
$0, same as above.Signed on 2004-05-03. Completion date: 2004-03-15.
Top industries in this zip code by the number of employees in 2005:
Health Care and Social Assistance: General Medical and Surgical Hospitals (250-499 employees: 1 establishment)
Health Care and Social Assistance: Home Health Care Services (50-99: 1, 1-4: 1)
Health Care and Social Assistance: Vocational Rehabilitation Services (50-99: 1)
Health Care and Social Assistance: All Other Outpatient Care Centers (50-99: 1)
Health Care and Social Assistance: Homes for the Elderly (20-49: 2)
Professional, Scientific, and Technical Services: Research and Development in the Physical, Engineering, and Life Sciences (20-49: 2)
People in group quarters in 2010:
17 people in residential treatment centers for adults
7 people in group homes intended for adults
People in group quarters in 2000:
122 people in college dormitories (includes college quarters off campus)
50 people in other noninstitutional group quarters
43 people in local jails and other confinement facilities (including police lockups)
35 people in other group homes
13 people in homes or halfway houses for drug/alcohol abuse
Fatal accident statistics in 2012:
Fatal accident count: 1
Vehicles involved in fatal accidents: 1
Fatal accidents caused by drunken drivers: 1
Fatalities: 1
Persons involved in fatal accidents: 2
Pedestrians involved in fatal accidents: 0
2002 - 2018 National Fire Incident Reporting System (NFIRS) incidents
According to the data from the years 2002 - 2018 the average number of fires per year is 16. The highest number of reported fires - 39 took place in 2006, and the least - 1 in 2013. The data has a decreasing trend.
When looking into fire subcategories, the most incidents belonged to: Structure Fires (54.6%), and Outside Fires (30.0%).
Fire incident types reported to NFIRS in Zip Code 49913


+$400
-$4,492
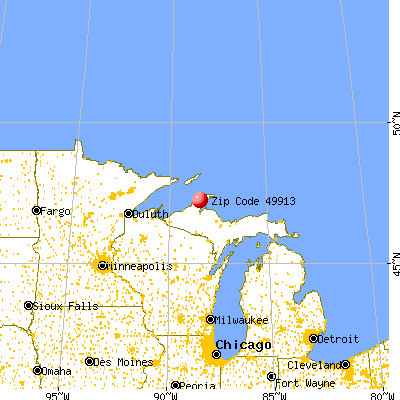
 Nearest zip codes: 49942, 49934, 49901, 49917, 49930, 49922.
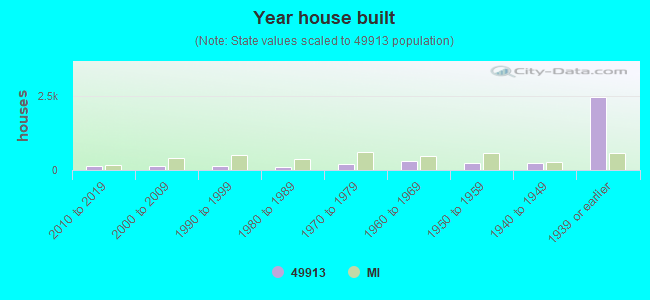


 According to the data from the years 2002 - 2018 the average number of fires per year is 16. The highest number of reported fires - 39 took place in 2006, and the least - 1 in 2013. The data has a decreasing trend.
 When looking into fire subcategories, the most incidents belonged to: Structure Fires (54.6%), and Outside Fires (30.0%).