Estimated zip code population in 2022: 1,254 Zip code population in 2010: 1,489 Zip code population in 2000: 1,514
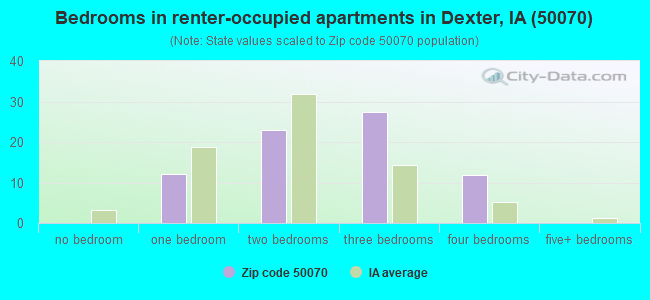
Houses and condos: 708 Renter-occupied apartments: 74
% of renters here:
14%
State:
28%
March 2022 cost of living index in zip code 50070: 83.3 (low, U.S. average is 100)
Land area: 65.9 sq. mi. Water area: 0.2 sq. mi.
Population density: 19 people per square mile
(very low).
OSM Map
General Map
Google Map
MSN Map
OSM Map
General Map
Google Map
MSN Map
OSM Map
General Map
Google Map
MSN Map
OSM Map
General Map
Google Map
MSN Map
Please wait while loading the map...
Real estate property taxes paid for housing units in 2022:
This zip code:
1.2% ($2,593)
Iowa:
1.4% ($2,724)
Median real estate property taxes paid for housing units with mortgages in 2022: $2,893 (1.2%) Median real estate property taxes paid for housing units with no mortgage in 2022: $2,385 (1.3%)
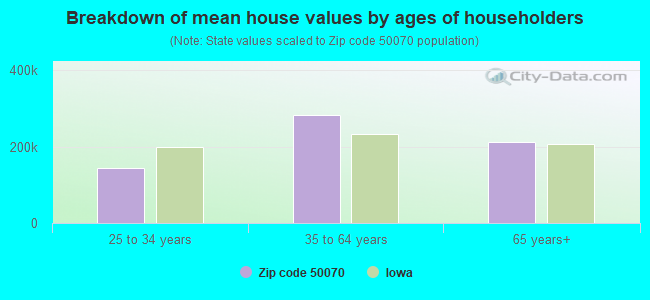
Estimated median house/condo value in 2022: $217,318
50070:
$217,318
Iowa:
$194,600
Median resident age:
This zip code:
47.7 years
Iowa median age:
38.9 years
Average household size:
This zip code:
2.3 people
Iowa:
2.3 people
Averages for the 2020 tax year for zip code 50070, filed in 2021:
Average Adjusted Gross Income (AGI) in 2020: $72,584 (Individual Income Tax Returns)
Here:
$72,584
State:
$71,087
Salary/wage: $62,231 (reported on 84.9% of returns)
Here:
$62,231
State:
$57,361
(% of AGI for various income ranges: 1226.4% for AGIs below $25k, 3640.0% for AGIs $25k-50k, 6672.2% for AGIs $50k-75k, 9284.3% for AGIs $75k-100k, 15068.0% for AGIs $100k-200k)
Taxable interest for individuals: $888 (reported on 34.2% of returns)
This zip code:
$888
Iowa:
$1,633
(% of AGI for various income ranges: 10.9% for AGIs below $25k, 17.7% for AGIs $25k-50k, 84.4% for AGIs $50k-75k, 14.3% for AGIs $75k-100k, 53.0% for AGIs $100k-200k)
Ordinary dividends: $2,007 (reported on 19.2% of returns)
Here:
$2,007
State:
$5,432
(% of AGI for various income ranges: 35.5% for AGIs below $25k, 42.2% for AGIs $50k-75k, 31.4% for AGIs $75k-100k, 146.0% for AGIs $100k-200k)
Net capital gain/loss in AGI: +$9,785 (reported on 17.8% of returns)
Here:
+$9,785
State:
+$15,243
(% of AGI for various income ranges: 39.1% for AGIs below $25k, 76.7% for AGIs $50k-75k, 1160.0% for AGIs $100k-200k)
Profit/loss from business: +$7,842 (reported on 16.4% of returns)
Here:
+$7,842
State:
+$11,763
(% of AGI for various income ranges: 222.7% for AGIs below $25k, 146.9% for AGIs $25k-50k, 247.1% for AGIs $75k-100k, 332.0% for AGIs $100k-200k)
Taxable individual retirement arrangement distribution: $14,911 (reported on 12.3% of returns)
50070:
$14,911
Iowa:
$17,324
(% of AGI for various income ranges: 240.0% for AGIs below $25k, 571.1% for AGIs $50k-75k, 564.0% for AGIs $100k-200k)
Total itemized deductions: $22,333 (reported on 4.1% of returns)
Here:
$22,333
State:
$33,775
(% of AGI for various income ranges: 670.0% for AGIs $100k-200k)
Taxes paid: $7,800 (reported on 4.1% of returns)
50070:
$7,800
State:
$7,704
(% of AGI for various income ranges: 234.0% for AGIs $100k-200k)
Earned income credit: $2,429 (reported on 9.6% of returns)
Here:
$2,429
State:
$2,195
(% of AGI for various income ranges: 93.6% for AGIs below $25k, 51.5% for AGIs $25k-50k)
Percentage of individuals using paid preparers for their 2020 taxes: 95.9%
Here:
96%
State:
95%
(% for various income ranges: 94.1% for AGIs below $25k, 94.1% for AGIs $25k-50k, 92.3% for AGIs $50k-75k, 100.0% for AGIs $75k-100k, 100.0% for AGIs $100k-200k, 100.0% for AGIs over 200k)
Averages for the 2012 tax year for zip code 50070, filed in 2013:
Average Adjusted Gross Income (AGI) in 2012: $60,577 (Individual Income Tax Returns)
Here:
$60,577
State:
$58,860
Salary/wage: $47,839 (reported on 85.5% of returns)
Here:
$47,839
State:
$46,659
(% of AGI for various income ranges: 65.5% for AGIs below $25k, 81.9% for AGIs $25k-50k, 80.3% for AGIs $50k-75k, 75.5% for AGIs $75k-100k, 54.2% for AGIs $100k-200k)
Taxable interest for individuals: $878 (reported on 33.3% of returns)
This zip code:
$878
Iowa:
$1,537
(% of AGI for various income ranges: 0.7% for AGIs below $25k, 0.8% for AGIs $25k-50k, 0.4% for AGIs $50k-75k, 0.2% for AGIs $75k-100k, 0.4% for AGIs $100k-200k)
Ordinary dividends: $1,192 (reported on 17.4% of returns)
Here:
$1,192
State:
$4,542
(% of AGI for various income ranges: 0.9% for AGIs below $25k, 0.4% for AGIs $25k-50k, 0.3% for AGIs $75k-100k, 0.4% for AGIs $100k-200k)
Net capital gain/loss in AGI: +$5,357 (reported on 10.1% of returns)
Here:
+$5,357
State:
+$11,802
(% of AGI for various income ranges: 1.7% for AGIs below $25k, 0.4% for AGIs $50k-75k, 1.7% for AGIs $100k-200k)
Profit/loss from business: +$8,092 (reported on 17.4% of returns)
Here:
+$8,092
State:
+$10,509
(% of AGI for various income ranges: 8.8% for AGIs below $25k, 1.4% for AGIs $25k-50k, 2.7% for AGIs $50k-75k, 6.3% for AGIs $75k-100k)
Taxable individual retirement arrangement distribution: $9,700 (reported on 10.1% of returns)
50070:
$9,700
Iowa:
$11,773
Total itemized deductions: $18,643 (18% of AGI, reported on 30.4% of returns)
Here:
$18,643
State:
$21,278
Here:
17.9% of AGI
State:
18.9% of AGI
(% of AGI for various income ranges: 9.3% for AGIs $25k-50k, 8.9% for AGIs $50k-75k, 9.3% for AGIs $75k-100k, 10.8% for AGIs $100k-200k)
Charity contributions: $2,338 (reported on 23.2% of returns)
Here:
$2,338
State:
$4,044
(% of AGI for various income ranges: 1.3% for AGIs below $25k, 0.6% for AGIs $50k-75k, 0.8% for AGIs $75k-100k, 1.3% for AGIs $100k-200k)
Taxes paid: $7,386 (reported on 30.4% of returns)
50070:
$7,386
State:
$8,846
(% of AGI for various income ranges: 2.0% for AGIs $25k-50k, 2.7% for AGIs $50k-75k, 3.6% for AGIs $75k-100k, 5.3% for AGIs $100k-200k)
Earned income credit: $2,000 (reported on 11.6% of returns)
Here:
$2,000
State:
$2,098
(% of AGI for various income ranges: 4.0% for AGIs below $25k, 1.0% for AGIs $25k-50k)
Percentage of individuals using paid preparers for their 2012 taxes: 62.3%
Here:
62%
State:
65%
(% for various income ranges: 55.0% for AGIs below $25k, 61.1% for AGIs $25k-50k, 66.7% for AGIs $50k-75k, 66.7% for AGIs $75k-100k, 70.0% for AGIs $100k-200k)
Averages for the 2004 tax year for zip code 50070, filed in 2005:
Average Adjusted Gross Income (AGI) in 2004: $40,788 (Individual Income Tax Returns)
Here:
$40,788
State:
$43,875
Salary/wage: $39,642 (reported on 85.1% of returns)
Here:
$39,642
State:
$38,265
(% of AGI for various income ranges: 128.3% for AGIs below $10k, 73.6% for AGIs $10k-25k, 80.6% for AGIs $25k-50k, 84.1% for AGIs $50k-75k, 85.7% for AGIs $75k-100k, 81.2% for AGIs over 100k)
Taxable interest for individuals: $1,184 (reported on 44.6% of returns)
This zip code:
$1,184
Iowa:
$1,768
(% of AGI for various income ranges: 8.3% for AGIs below $10k, 4.5% for AGIs $10k-25k, 0.8% for AGIs $25k-50k, 1.3% for AGIs $50k-75k, 0.2% for AGIs $75k-100k, 0.7% for AGIs over 100k)
Taxable dividends: $829 (reported on 18.6% of returns)
Here:
$829
State:
$2,510
(% of AGI for various income ranges: 1.9% for AGIs below $10k, 0.6% for AGIs $10k-25k, 0.2% for AGIs $25k-50k, 0.6% for AGIs $50k-75k, 0.2% for AGIs $75k-100k, 0.1% for AGIs over 100k)
Net capital gain/loss: +$4,171 (reported on 16.0% of returns)
Here:
+$4,171
State:
+$6,139
(% of AGI for various income ranges: 0.9% for AGIs below $10k, -0.5% for AGIs $10k-25k, 1.0% for AGIs $25k-50k, 0.9% for AGIs $50k-75k, 1.2% for AGIs $75k-100k, 5.5% for AGIs over 100k)
Profit/loss from business: +$4,230 (reported on 16.3% of returns)
Here:
+$4,230
State:
+$8,574
(% of AGI for various income ranges: -2.4% for AGIs below $10k, 8.8% for AGIs $10k-25k, 1.4% for AGIs $25k-50k, 1.8% for AGIs $50k-75k, 0.2% for AGIs $75k-100k)
IRA payment deduction: $2,917 (reported on 1.7% of returns)
50070:
$2,917
Iowa:
$2,970
Total itemized deductions: $14,790 (23% of AGI, reported on 32.3% of returns)
Here:
$14,790
State:
$16,976
Here:
22.6% of AGI
State:
20.8% of AGI
(% of AGI for various income ranges: 13.6% for AGIs $10k-25k, 9.4% for AGIs $25k-50k, 11.9% for AGIs $50k-75k, 13.1% for AGIs $75k-100k, 13.0% for AGIs over 100k)
Charity contributions deductions: $1,882 (3% of AGI, reported on 24.4% of returns)
Here:
$1,882
State:
$3,089
Here:
2.8% of AGI
State:
3.6% of AGI
(% of AGI for various income ranges: 2.2% for AGIs $10k-25k, 1.0% for AGIs $25k-50k, 0.9% for AGIs $50k-75k, 1.0% for AGIs $75k-100k, 1.4% for AGIs over 100k)
Total tax: $4,940 (reported on 79.1% of returns)
50070:
$4,940
State:
$6,177
(% of AGI for various income ranges: 3.8% for AGIs below $10k, 5.2% for AGIs $10k-25k, 7.3% for AGIs $25k-50k, 8.4% for AGIs $50k-75k, 10.5% for AGIs $75k-100k, 16.7% for AGIs over 100k)
Earned income credit: $1,424 (reported on 12.3% of returns)
Here:
$1,424
State:
$1,540
Percentage of individuals using paid preparers for their 2004 taxes: 67.2%
Here:
67%
State:
70%
(% for various income ranges: 58.1% for AGIs below $10k, 66.9% for AGIs $10k-25k, 65.7% for AGIs $25k-50k, 75.9% for AGIs $50k-75k, 70.5% for AGIs $75k-100k, 71.4% for AGIs over 100k)
Household received Food Stamps/SNAP in the past 12 months: 33 Household did not receive Food Stamps/SNAP in the past 12 months: 517
Women who had a birth in the past 12 months: 12 (3 now married, 8 unmarried) Women who did not have a birth in the past 12 months: 217 (102 now married, 115 unmarried)
Housing units in zip code 50070 with a mortgage: 266 (15 second mortgage, 15 both second mortgage and home equity loan) Median monthly owner costs for units with a mortgage: $1,578 Median monthly owner costs for units without a mortgage: $633
Residents with income below the poverty level in 2022:
This zip code:
3.7%
Whole state:
11.0%
Residents with income below 50% of the poverty level in 2022:
This zip code:
2.7%
Whole state:
5.5%
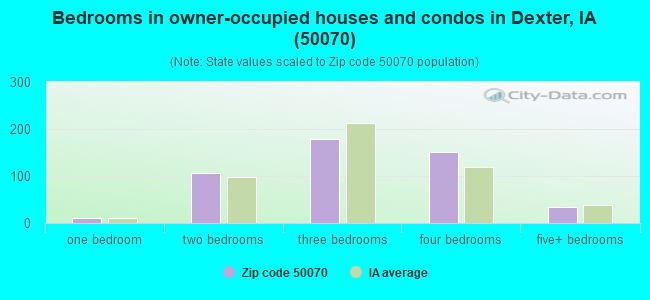
Median number of rooms in houses and condos:
Here:
6.7
State:
6.8
Median number of rooms in apartments:
Here:
6.0
State:
4.2
Notable locations in this zip code not listed on our city pages
Notable locations in zip code 50070: North River (A), South Raccoon River Access (B), Grainco Incorporated Elevator (C), Dexter (D), Beaver Lake Campground (E), Dexter Volunteer Fire and Rescue (F), Dexter Library (G), Dexter City Hall (H). Display/hide their locations on the map
Churches in zip code 50070 include: Zion Lutheran Church (A), First Presbyterian Church (B), Calvary Assembly of God Church (C). Display/hide their locations on the map
Size of family households: 223 2-persons, 53 3-persons, 52 4-persons, 20 5-persons, 15 6-persons
Size of nonfamily households: 152 1-person, 24 2-persons, 6 4-persons
165 married couples with children.
56 single-parent households (8 men, 48 women).
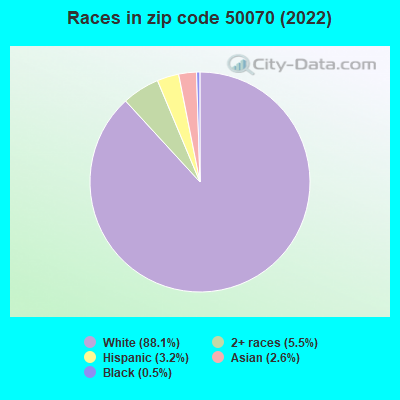
98.1% of residents of 50070 zip code speak English at home.
0.1% of residents speak Spanish at home (100% very well).
1.4% of residents speak Asian or Pacific Island language at home (100% very well).
Foreign born population: 1 (0.1%) (0.0% of them are naturalized citizens)
:
0.1%
Whole state:
6.0%
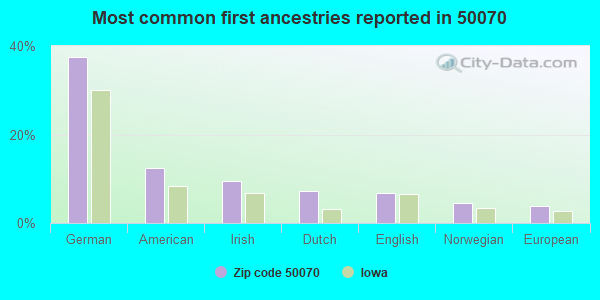
38%German
12%American
10%Irish
7%Dutch
7%English
4%Norwegian
4%European
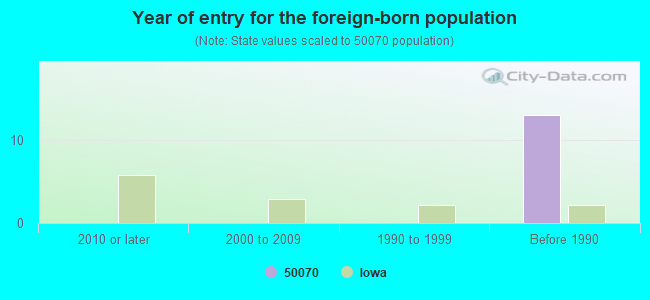
Year of entry for the foreign-born population
02010 or later
02000 to 2009
01990 to 1999
13Before 1990
Facilities with environmental interests located in this zip code:
DEXTER ELEMENTARY SCHOOL (803 WASHINGTON STREET in DEXTER, IA)
(National Center for Education Statistics) - STATE ID-396264 409 Organizations: WEST CENTRAL VALLEY COMM SCHOOL DISTRICT (SCHOOL DISTRICT)
DEXTER CITY OF STP (BEWEEN D AVENUE AND DEXFIELD W in DEXTER, IA)
National Pollutant Discharge Elimination System NON-MAJOR (Tracking pollutant discharge elimination systems) - permit Business SIC classification: SEWERAGE SYSTEMS Organizations: CITY OF DEXTER (CONTACT/OWNER)
DIAMOND HEAD LAKE (DIAMOND HEAD LAKE in DEXTER, IA)
National Pollutant Discharge Elimination System NON-MAJOR (Tracking pollutant discharge elimination systems) - permit Business SIC classification: SEWERAGE SYSTEMS Organizations: DIAMONDHEAD SANITARY DISTRICT (CONTACT/OWNER)
SMITH PAINTING INC (617 GRAHAM ST in DEXTER, IA)
ENFORCEMENT/COMPLIANCE ACTIVITY (Integrated Compliance Information System) Conditionally Exempt Small Quantity Generators, less than 100 kg/month of hazardous waste (Resource Conservation and Recovery Act (tracking hazardous waste)) Organizations: STEVE SMITH (CONTACT/OPERATOR)
BUNNELL RESIDENCE-FORMERLY KERWIN TRKNG (3687 F PLACE in DEXTER, IA)
(Resource Conservation and Recovery Act (tracking hazardous waste)) Business NAICS classification: FARM MANAGEMENT SERVICES.
RA-MARK INDUSTRIES INC (814 POLK ST in DEXTER, IA)
(Resource Conservation and Recovery Act (tracking hazardous waste)) Business NAICS classification: FABRICATED STRUCTURAL METAL MANUFACTURING.; ORNAMENTAL AND ARCHITECTURAL METAL WORK MANUFACTURING.
Housing units lacking complete plumbing facilities: 4.4% Housing units lacking complete kitchen facilities: 0.2%
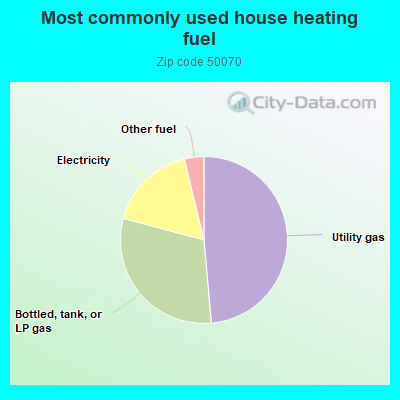
48.8%Utility gas
30.7%Bottled, tank, or LP gas
17.1%Electricity
3.8%Other fuel
Population in 1990: 824. Population change in the 1990s: +690 (+83.7%).
Place of birth for U.S.-born residents:
This state: 1,028
Northeast: 8
Midwest: 95
South: 63
West: 42
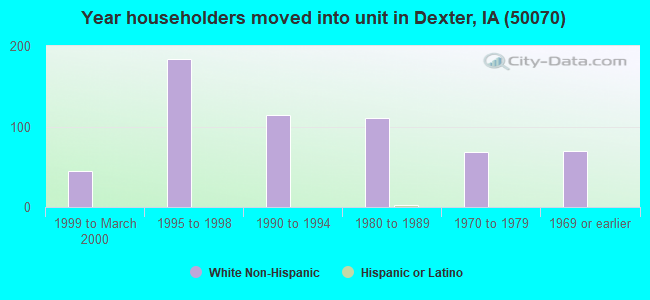
63% of the 50070 zip code residents lived in the same house 5 years ago. Out of people who lived in different houses, 31% lived in this county. Out of people who lived in different counties, 50% lived in Iowa.
86% of the 50070 zip code residents lived in the same house 1 year ago. Out of people who lived in different houses, 18% moved from this county. Out of people who lived in different houses, 83% moved from different county within same state. Out of people who lived in different houses, 1% moved from different state.
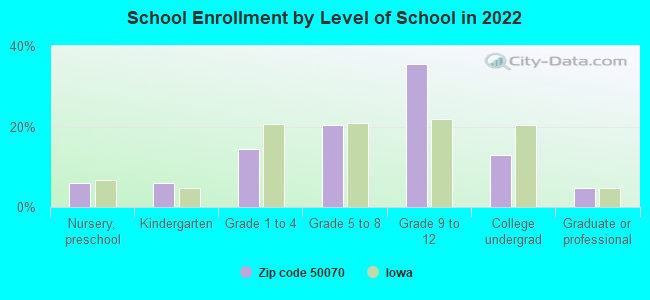
Private vs. public school enrollment:
Students in private schools in grades 1 to 8 (elementary and middle school): 10
Here:
13.0%
Iowa:
10.6%
Students in private schools in grades 9 to 12 (high school): 10
Here:
13.5%
Iowa:
7.9%
Students in private undergraduate colleges: 1
Here:
6.4%
Iowa:
23.9%
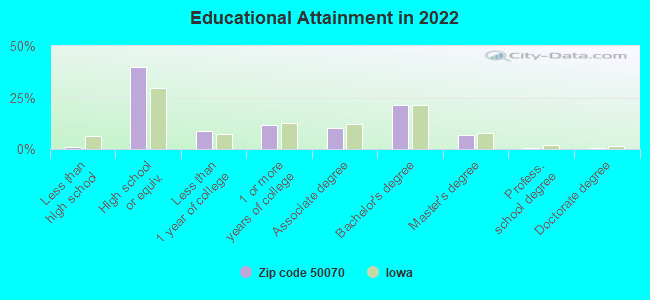
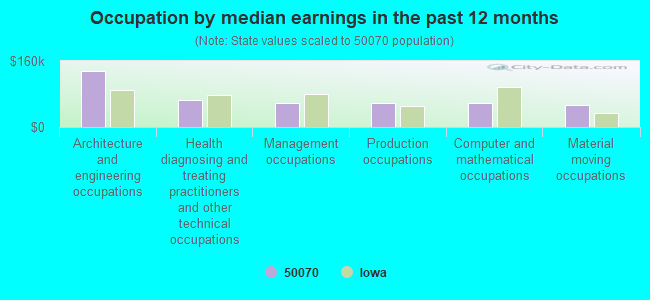
Occupation by median earnings in the past 12 months ($)
136,877Architecture and engineering occupations
64,331Health diagnosing and treating practitioners and other technical occupations
58,341Management occupations
57,776Production occupations
57,163Computer and mathematical occupations
53,413Material moving occupations
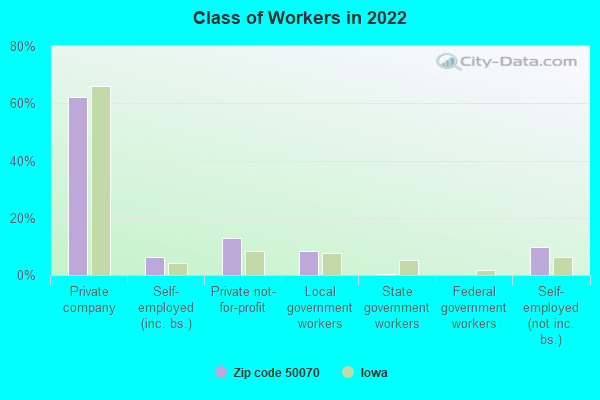
Top industries in this zip code by the number of employees in 2005:
Construction: Poured Concrete Foundation and Structure Contractors (20-49 employees: 1 establishment, 5-9 employees: 1 establishment)
Accommodation and Food Services: Full-Service Restaurants (10-19: 1)
Construction: Site Preparation Contractors (5-9: 1, 1-4: 1)
Administrative and Support and Waste Management and Remediation Services: Landscaping Services (5-9: 1, 1-4: 1)
Wholesale Trade: Grain and Field Bean Merchant Wholesalers (5-9: 1)
Construction: All Other Specialty Trade Contractors (5-9: 1)
Other Services (except Public Administration): Religious Organizations (1-4: 2)
Arts, Entertainment, and Recreation: Fitness and Recreational Sports Centers (1-4: 1)
Fatal accident statistics in 2014:
Fatal accident count: 1
Vehicles involved in fatal accidents: 1
Fatal accidents caused by drunken drivers: 1
Fatalities: 1
Persons involved in fatal accidents: 1
Pedestrians involved in fatal accidents: 0
Fatal accident statistics in 2013:
Fatal accident count: 1
Vehicles involved in fatal accidents: 2
Fatal accidents caused by drunken drivers: 0
Fatalities: 1
Persons involved in fatal accidents: 2
Pedestrians involved in fatal accidents: 0
Home Mortgage Disclosure Act Aggregated Statistics For Year 2009 (Based on 2 partial tracts)
A) FHA, FSA/RHS & VA Home Purchase Loans
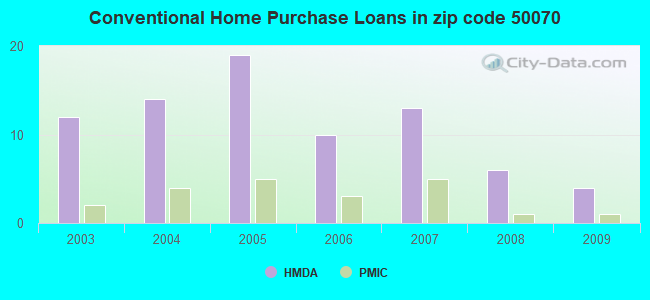
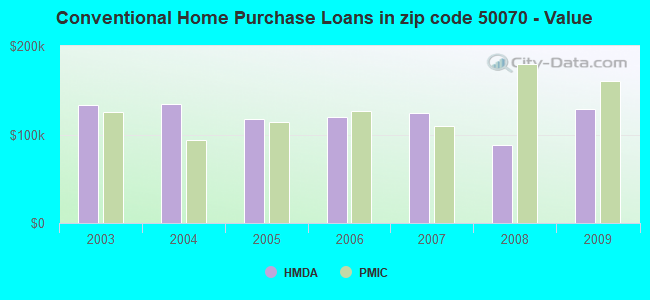
B) Conventional Home Purchase Loans
C) Refinancings
D) Home Improvement Loans
F) Non-occupant Loans on < 5 Family Dwellings (A B C & D)
G) Loans On Manufactured Home Dwelling (A B C & D)
Number
Average Value
Number
Average Value
Number
Average Value
Number
Average Value
Number
Average Value
Number
Average Value
LOANS ORIGINATED
4
$111,022
4
$128,738
23
$146,833
3
$16,427
2
$37,165
1
$73,530
APPLICATIONS APPROVED, NOT ACCEPTED
0
$0
1
$241,890
2
$114,420
0
$0
0
$0
0
$0
APPLICATIONS DENIED
0
$0
1
$55,410
6
$120,058
1
$38,360
0
$0
0
$0
APPLICATIONS WITHDRAWN
1
$54,880
0
$0
5
$124,942
0
$0
0
$0
0
$0
FILES CLOSED FOR INCOMPLETENESS
0
$0
1
$25,570
1
$195,800
0
$0
0
$0
0
$0
Aggregated Statistics For Year 2008 (Based on 2 partial tracts)
A) FHA, FSA/RHS & VA Home Purchase Loans
B) Conventional Home Purchase Loans
C) Refinancings
D) Home Improvement Loans
F) Non-occupant Loans on < 5 Family Dwellings (A B C & D)
Number
Average Value
Number
Average Value
Number
Average Value
Number
Average Value
Number
Average Value
LOANS ORIGINATED
1
$132,930
6
$88,400
14
$123,819
3
$58,077
2
$30,635
APPLICATIONS APPROVED, NOT ACCEPTED
1
$39,690
0
$0
4
$94,505
0
$0
0
$0
APPLICATIONS DENIED
0
$0
1
$38,890
10
$101,978
4
$88,112
1
$26,640
APPLICATIONS WITHDRAWN
0
$0
1
$78,850
4
$84,982
0
$0
1
$49,020
FILES CLOSED FOR INCOMPLETENESS
0
$0
0
$0
1
$207,260
1
$15,980
0
$0
Aggregated Statistics For Year 2007 (Based on 2 partial tracts)
A) FHA, FSA/RHS & VA Home Purchase Loans
B) Conventional Home Purchase Loans
C) Refinancings
D) Home Improvement Loans
F) Non-occupant Loans on < 5 Family Dwellings (A B C & D)
G) Loans On Manufactured Home Dwelling (A B C & D)
Number
Average Value
Number
Average Value
Number
Average Value
Number
Average Value
Number
Average Value
Number
Average Value
LOANS ORIGINATED
0
$0
13
$123,855
16
$128,089
6
$37,828
3
$115,440
1
$103,100
APPLICATIONS APPROVED, NOT ACCEPTED
0
$0
2
$90,045
4
$127,938
0
$0
1
$51,680
0
$0
APPLICATIONS DENIED
1
$33,830
2
$118,815
11
$111,283
3
$54,257
1
$71,930
0
$0
APPLICATIONS WITHDRAWN
0
$0
2
$98,435
2
$109,890
1
$21,310
1
$23,710
1
$41,290
FILES CLOSED FOR INCOMPLETENESS
0
$0
1
$47,950
1
$148,650
1
$76,460
0
$0
0
$0
Aggregated Statistics For Year 2006 (Based on 2 partial tracts)
A) FHA, FSA/RHS & VA Home Purchase Loans
B) Conventional Home Purchase Loans
C) Refinancings
D) Home Improvement Loans
F) Non-occupant Loans on < 5 Family Dwellings (A B C & D)
G) Loans On Manufactured Home Dwelling (A B C & D)
Number
Average Value
Number
Average Value
Number
Average Value
Number
Average Value
Number
Average Value
Number
Average Value
LOANS ORIGINATED
2
$104,030
10
$119,827
19
$112,056
5
$23,604
2
$63,935
1
$25,040
APPLICATIONS APPROVED, NOT ACCEPTED
0
$0
1
$113,490
6
$99,855
1
$13,590
0
$0
0
$0
APPLICATIONS DENIED
0
$0
2
$108,825
13
$129,532
3
$44,310
0
$0
1
$46,890
APPLICATIONS WITHDRAWN
0
$0
0
$0
5
$128,192
1
$28,770
0
$0
0
$0
FILES CLOSED FOR INCOMPLETENESS
0
$0
0
$0
2
$112,155
0
$0
0
$0
0
$0
Aggregated Statistics For Year 2005 (Based on 2 partial tracts)
A) FHA, FSA/RHS & VA Home Purchase Loans
B) Conventional Home Purchase Loans
C) Refinancings
D) Home Improvement Loans
F) Non-occupant Loans on < 5 Family Dwellings (A B C & D)
G) Loans On Manufactured Home Dwelling (A B C & D)
Number
Average Value
Number
Average Value
Number
Average Value
Number
Average Value
Number
Average Value
Number
Average Value
LOANS ORIGINATED
1
$59,140
19
$117,721
25
$127,936
4
$35,630
3
$42,800
1
$10,660
APPLICATIONS APPROVED, NOT ACCEPTED
1
$50,080
2
$132,935
3
$78,767
0
$0
0
$0
0
$0
APPLICATIONS DENIED
0
$0
1
$114,820
12
$118,104
2
$30,635
0
$0
0
$0
APPLICATIONS WITHDRAWN
0
$0
2
$102,430
9
$119,051
1
$48,750
1
$52,480
0
$0
FILES CLOSED FOR INCOMPLETENESS
0
$0
1
$168,360
2
$128,270
0
$0
0
$0
0
$0
Aggregated Statistics For Year 2004 (Based on 2 partial tracts)
A) FHA, FSA/RHS & VA Home Purchase Loans
B) Conventional Home Purchase Loans
C) Refinancings
D) Home Improvement Loans
F) Non-occupant Loans on < 5 Family Dwellings (A B C & D)
G) Loans On Manufactured Home Dwelling (A B C & D)
Number
Average Value
Number
Average Value
Number
Average Value
Number
Average Value
Number
Average Value
Number
Average Value
LOANS ORIGINATED
1
$97,500
14
$134,741
30
$111,915
5
$35,750
3
$76,367
1
$73,260
APPLICATIONS APPROVED, NOT ACCEPTED
0
$0
2
$135,730
4
$125,408
1
$13,850
0
$0
0
$0
APPLICATIONS DENIED
0
$0
4
$101,432
10
$109,704
2
$10,525
0
$0
1
$64,470
APPLICATIONS WITHDRAWN
0
$0
3
$129,560
4
$121,678
1
$17,320
0
$0
0
$0
FILES CLOSED FOR INCOMPLETENESS
0
$0
2
$49,950
2
$135,330
1
$29,300
0
$0
0
$0
Aggregated Statistics For Year 2003 (Based on 2 partial tracts)
A) FHA, FSA/RHS & VA Home Purchase Loans
B) Conventional Home Purchase Loans
C) Refinancings
D) Home Improvement Loans
F) Non-occupant Loans on < 5 Family Dwellings (A B C & D)
Detailed PMIC statistics for the following Tracts:0506.00
2003 - 2018 National Fire Incident Reporting System (NFIRS) incidents
Based on the data from the years 2003 - 2018 the average number of fires per year is 9. The highest number of fires - 26 took place in 2012, and the least - 0 in 2013. The data has a declining trend.
When looking into fire subcategories, the most reports belonged to: Outside Fires (60.3%), and Structure Fires (27.7%).
Fire incident types reported to NFIRS in Zip Code 50070

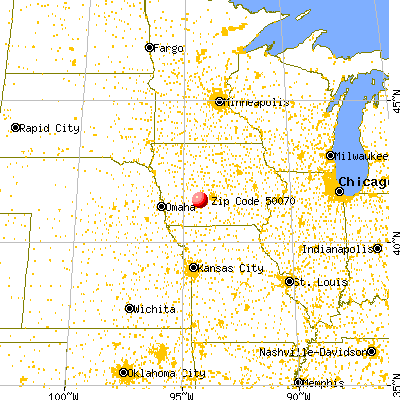


 Nearest zip codes: 50072, 50250, 50233, 50164, 50849, 50273.
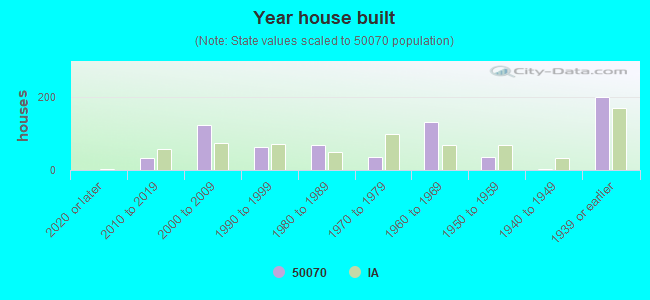


 Based on the data from the years 2003 - 2018 the average number of fires per year is 9. The highest number of fires - 26 took place in 2012, and the least - 0 in 2013. The data has a declining trend.
 When looking into fire subcategories, the most reports belonged to: Outside Fires (60.3%), and Structure Fires (27.7%).