Estimated zip code population in 2022: 1,789 Zip code population in 2010: 1,741 Zip code population in 2000: 1,810
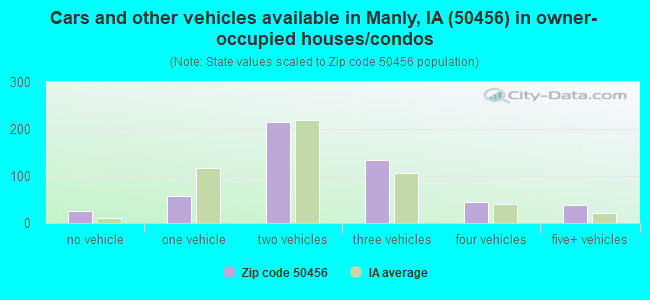
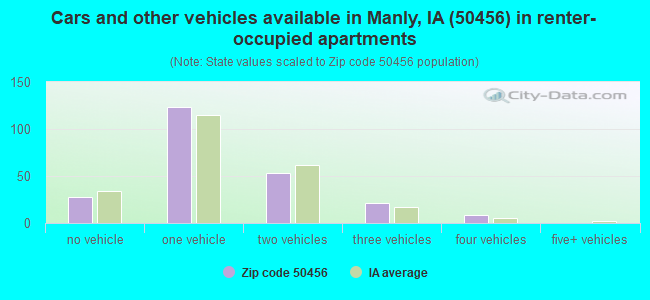
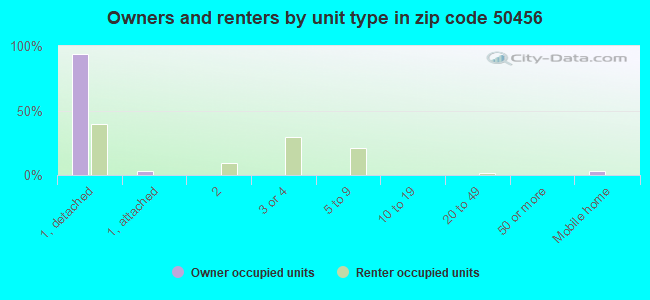
Houses and condos: 814 Renter-occupied apartments: 235
% of renters here:
31%
State:
28%
March 2022 cost of living index in zip code 50456: 81.4 (low, U.S. average is 100)
Land area: 46.5 sq. mi. Water area: 0.0 sq. mi.
Population density: 38 people per square mile
(very low).
OSM Map
General Map
Google Map
MSN Map
OSM Map
General Map
Google Map
MSN Map
OSM Map
General Map
Google Map
MSN Map
OSM Map
General Map
Google Map
MSN Map
Please wait while loading the map...
Real estate property taxes paid for housing units in 2022:
This zip code:
1.2% ($1,452)
Iowa:
1.4% ($2,724)
Median real estate property taxes paid for housing units with mortgages in 2022: $1,494 (1.2%) Median real estate property taxes paid for housing units with no mortgage in 2022: $1,420 (1.2%)
Averages for the 2020 tax year for zip code 50456, filed in 2021:
Average Adjusted Gross Income (AGI) in 2020: $57,827 (Individual Income Tax Returns)
Here:
$57,827
State:
$71,087
Salary/wage: $44,218 (reported on 82.7% of returns)
Here:
$44,218
State:
$57,361
(% of AGI for various income ranges: 1196.8% for AGIs below $25k, 3800.0% for AGIs $25k-50k, 5777.3% for AGIs $50k-75k, 10706.0% for AGIs $75k-100k, 17608.0% for AGIs $100k-200k)
Taxable interest for individuals: $910 (reported on 35.8% of returns)
This zip code:
$910
Iowa:
$1,633
(% of AGI for various income ranges: 20.0% for AGIs below $25k, 17.2% for AGIs $25k-50k, 52.7% for AGIs $50k-75k, 92.0% for AGIs $75k-100k, 182.0% for AGIs $100k-200k)
Ordinary dividends: $2,640 (reported on 18.5% of returns)
Here:
$2,640
State:
$5,432
(% of AGI for various income ranges: 15.3% for AGIs below $25k, 14.4% for AGIs $25k-50k, 119.1% for AGIs $50k-75k, 96.0% for AGIs $75k-100k, 324.0% for AGIs $100k-200k)
Net capital gain/loss in AGI: +$6,608 (reported on 14.8% of returns)
Here:
+$6,608
State:
+$15,243
(% of AGI for various income ranges: 30.0% for AGIs below $25k, 73.6% for AGIs $50k-75k, 1310.0% for AGIs $100k-200k)
Profit/loss from business: +$7,956 (reported on 11.1% of returns)
Here:
+$7,956
State:
+$11,763
(% of AGI for various income ranges: 167.2% for AGIs $25k-50k, 259.1% for AGIs $50k-75k, 260.0% for AGIs $100k-200k)
Taxable individual retirement arrangement distribution: $12,438 (reported on 9.9% of returns)
50456:
$12,438
Iowa:
$17,324
(% of AGI for various income ranges: 259.4% for AGIs $25k-50k, 1056.0% for AGIs $75k-100k)
Earned income credit: $2,164 (reported on 13.6% of returns)
Here:
$2,164
State:
$2,195
(% of AGI for various income ranges: 79.5% for AGIs below $25k, 48.3% for AGIs $25k-50k)
Percentage of individuals using paid preparers for their 2020 taxes: 97.5%
Here:
98%
State:
95%
(% for various income ranges: 96.0% for AGIs below $25k, 95.7% for AGIs $25k-50k, 100.0% for AGIs $50k-75k, 100.0% for AGIs $75k-100k, 100.0% for AGIs $100k-200k)
Averages for the 2012 tax year for zip code 50456, filed in 2013:
Average Adjusted Gross Income (AGI) in 2012: $44,988 (Individual Income Tax Returns)
Here:
$44,988
State:
$58,860
Salary/wage: $34,898 (reported on 86.8% of returns)
Here:
$34,898
State:
$46,659
(% of AGI for various income ranges: 75.6% for AGIs below $25k, 75.6% for AGIs $25k-50k, 76.0% for AGIs $50k-75k, 77.5% for AGIs $75k-100k, 44.9% for AGIs $100k-200k)
Taxable interest for individuals: $972 (reported on 38.2% of returns)
This zip code:
$972
Iowa:
$1,537
(% of AGI for various income ranges: 1.8% for AGIs below $25k, 0.8% for AGIs $25k-50k, 0.6% for AGIs $50k-75k, 1.3% for AGIs $75k-100k, 0.4% for AGIs $100k-200k)
Ordinary dividends: $1,729 (reported on 22.4% of returns)
Here:
$1,729
State:
$4,542
(% of AGI for various income ranges: 0.8% for AGIs below $25k, 0.5% for AGIs $25k-50k, 0.7% for AGIs $50k-75k, 1.1% for AGIs $75k-100k, 1.1% for AGIs $100k-200k)
Net capital gain/loss in AGI: +$1,391 (reported on 14.5% of returns)
Here:
+$1,391
State:
+$11,802
(% of AGI for various income ranges: 0.9% for AGIs $50k-75k, 0.9% for AGIs $100k-200k)
Profit/loss from business: +$6,050 (reported on 13.2% of returns)
Here:
+$6,050
State:
+$10,509
(% of AGI for various income ranges: 5.7% for AGIs below $25k, 2.8% for AGIs $25k-50k, 2.2% for AGIs $50k-75k, 0.5% for AGIs $75k-100k)
Taxable individual retirement arrangement distribution: $7,671 (reported on 9.2% of returns)
50456:
$7,671
Iowa:
$11,773
(% of AGI for various income ranges: 2.5% for AGIs below $25k, 2.9% for AGIs $25k-50k, 4.0% for AGIs $75k-100k)
Total itemized deductions: $16,421 (22% of AGI, reported on 18.4% of returns)
Here:
$16,421
State:
$21,278
Here:
21.8% of AGI
State:
18.9% of AGI
(% of AGI for various income ranges: 11.9% for AGIs $25k-50k, 6.1% for AGIs $50k-75k, 5.3% for AGIs $75k-100k, 7.2% for AGIs $100k-200k)
Charity contributions: $2,150 (reported on 13.2% of returns)
Here:
$2,150
State:
$4,044
(% of AGI for various income ranges: 1.0% for AGIs $25k-50k, 0.9% for AGIs $50k-75k, 0.8% for AGIs $100k-200k)
Taxes paid: $5,479 (reported on 18.4% of returns)
50456:
$5,479
State:
$8,846
(% of AGI for various income ranges: 1.9% for AGIs $25k-50k, 1.9% for AGIs $50k-75k, 2.3% for AGIs $75k-100k, 3.6% for AGIs $100k-200k)
Earned income credit: $2,306 (reported on 21.1% of returns)
Here:
$2,306
State:
$2,098
(% of AGI for various income ranges: 7.1% for AGIs below $25k, 1.4% for AGIs $25k-50k)
Percentage of individuals using paid preparers for their 2012 taxes: 71.1%
Here:
71%
State:
65%
(% for various income ranges: 59.4% for AGIs below $25k, 77.8% for AGIs $25k-50k, 75.0% for AGIs $50k-75k, 85.7% for AGIs $75k-100k, 85.7% for AGIs $100k-200k)
Averages for the 2004 tax year for zip code 50456, filed in 2005:
Average Adjusted Gross Income (AGI) in 2004: $35,272 (Individual Income Tax Returns)
Here:
$35,272
State:
$43,875
Salary/wage: $31,188 (reported on 86.5% of returns)
Here:
$31,188
State:
$38,265
(% of AGI for various income ranges: 83.5% for AGIs below $10k, 77.6% for AGIs $10k-25k, 78.4% for AGIs $25k-50k, 83.1% for AGIs $50k-75k, 73.6% for AGIs $75k-100k, 42.5% for AGIs over 100k)
Taxable interest for individuals: $1,043 (reported on 50.1% of returns)
This zip code:
$1,043
Iowa:
$1,768
(% of AGI for various income ranges: 3.0% for AGIs below $10k, 2.4% for AGIs $10k-25k, 1.5% for AGIs $25k-50k, 1.3% for AGIs $50k-75k, 1.1% for AGIs $75k-100k, 0.4% for AGIs over 100k)
Taxable dividends: $889 (reported on 25.5% of returns)
Here:
$889
State:
$2,510
(% of AGI for various income ranges: 0.8% for AGIs below $10k, 0.7% for AGIs $10k-25k, 0.6% for AGIs $25k-50k, 0.4% for AGIs $50k-75k, 1.4% for AGIs $75k-100k)
Net capital gain/loss: +$1,507 (reported on 18.5% of returns)
Here:
+$1,507
State:
+$6,139
(% of AGI for various income ranges: -2.6% for AGIs below $10k, 0.5% for AGIs $10k-25k, 0.9% for AGIs $25k-50k, 0.7% for AGIs $50k-75k, 1.8% for AGIs $75k-100k)
Profit/loss from business: +$4,972 (reported on 14.5% of returns)
Here:
+$4,972
State:
+$8,574
(% of AGI for various income ranges: 8.3% for AGIs below $10k, 3.0% for AGIs $10k-25k, 3.9% for AGIs $25k-50k, 0.9% for AGIs $50k-75k, -0.1% for AGIs $75k-100k)
Profit/loss from farming: +$3,527 (reported on 7.4% of returns)
Here:
+$3,527
State:
-$74
IRA payment deduction: $2,958 (reported on 3.2% of returns)
50456:
$2,958
Iowa:
$2,970
Total itemized deductions: $12,015 (22% of AGI, reported on 18.1% of returns)
Here:
$12,015
State:
$16,976
Here:
21.5% of AGI
State:
20.8% of AGI
(% of AGI for various income ranges: 8.5% for AGIs $10k-25k, 3.8% for AGIs $25k-50k, 6.4% for AGIs $50k-75k, 7.5% for AGIs $75k-100k, 9.3% for AGIs over 100k)
Charity contributions deductions: $1,717 (3% of AGI, reported on 15.1% of returns)
Here:
$1,717
State:
$3,089
Here:
3.0% of AGI
State:
3.6% of AGI
(% of AGI for various income ranges: 0.8% for AGIs $10k-25k, 0.4% for AGIs $25k-50k, 1.0% for AGIs $50k-75k, 1.3% for AGIs $75k-100k)
Total tax: $3,644 (reported on 76.0% of returns)
50456:
$3,644
State:
$6,177
(% of AGI for various income ranges: 2.5% for AGIs below $10k, 3.7% for AGIs $10k-25k, 6.7% for AGIs $25k-50k, 7.9% for AGIs $50k-75k, 10.2% for AGIs $75k-100k, 17.2% for AGIs over 100k)
Earned income credit: $1,661 (reported on 15.8% of returns)
Here:
$1,661
State:
$1,540
Percentage of individuals using paid preparers for their 2004 taxes: 75.6%
Here:
76%
State:
70%
(% for various income ranges: 61.7% for AGIs below $10k, 71.8% for AGIs $10k-25k, 85.8% for AGIs $25k-50k, 74.0% for AGIs $50k-75k, 86.8% for AGIs $75k-100k, 78.6% for AGIs over 100k)
Household received Food Stamps/SNAP in the past 12 months: 58 Household did not receive Food Stamps/SNAP in the past 12 months: 693
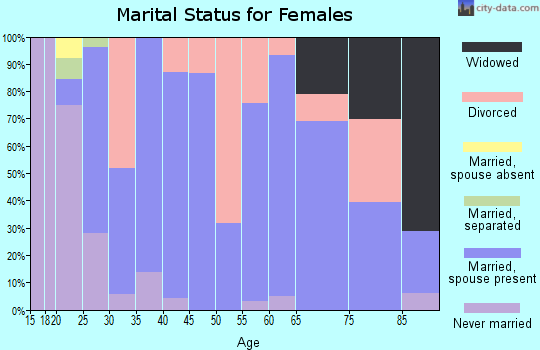
Women who had a birth in the past 12 months: 12 (9 now married, 2 unmarried) Women who did not have a birth in the past 12 months: 377 (191 now married, 185 unmarried)
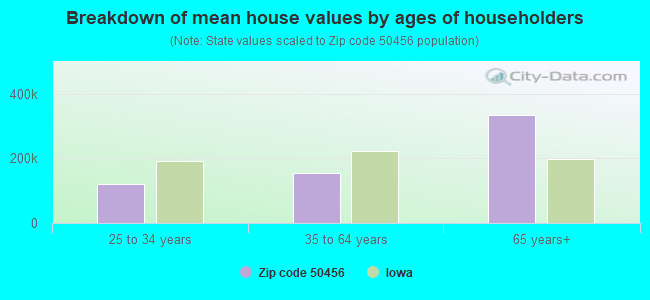
Housing units in zip code 50456 with a mortgage: 273 (40 second mortgage, 18 both second mortgage and home equity loan) Houses without a mortgage: 17
Median monthly owner costs for units with a mortgage: $1,035 Median monthly owner costs for units without a mortgage: $500
Residents with income below the poverty level in 2022:
This zip code:
12.4%
Whole state:
11.0%
Residents with income below 50% of the poverty level in 2022:
This zip code:
3.1%
Whole state:
5.5%
Median number of rooms in houses and condos:
Here:
6.5
State:
6.8
Median number of rooms in apartments:
Here:
4.1
State:
4.2
Notable locations in this zip code not listed on our city pages
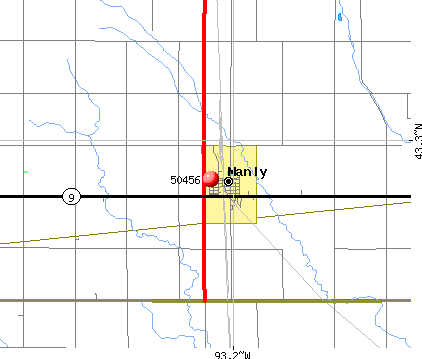
Notable locations in zip code 50456: Manly (A), Pioneer Town and Country Club (B), Farmers Co-op Elevator (C), Manly Volunteer Fire Department (D), Manly Police Department (E), Manly City Hall (F), Manly Public Library (G), Manly Caboose Museum (H). Display/hide their locations on the map
Churches in zip code 50456 include: Bethel United Methodist Church (A), Sacred Heart Catholic Church (B), Bethlehem Lutheran Church (C). Display/hide their locations on the map
In group quarters: 49 (-1 institutionalized population)
Size of family households: 240 2-persons, 77 3-persons, 99 4-persons, 53 5-persons, 10 6-persons, 3 7-or-more-persons
Size of nonfamily households: 210 1-person, 54 2-persons
266 married couples with children.
133 single-parent households (59 men, 74 women).
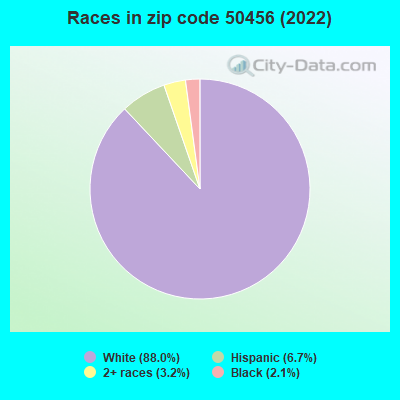
99.5% of residents of 50456 zip code speak English at home.
0.2% of residents speak Spanish at home (100% very well).
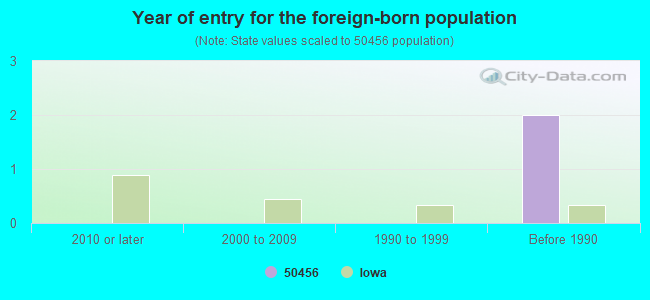
Foreign born population: 0 (0.0%)
:
0.0%
Whole state:
6.0%
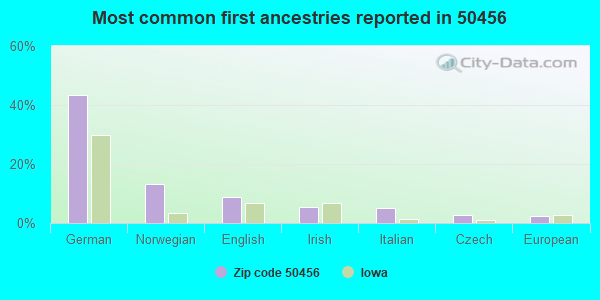
43%German
13%Norwegian
9%English
5%Irish
5%Italian
3%Czech
2%European
Year of entry for the foreign-born population
02010 or later
02000 to 2009
01990 to 1999
2Before 1990
Facilities with environmental interests located in this zip code:
NORTH CENTRAL ELEMENTARY SCHOOL (105 S EAST ST in MANLY, IA)
(National Center for Education Statistics) - STATE ID-984772 409 Organizations: NORTH CENTRAL COMM SCHOOL DISTRICT (SCHOOL DISTRICT)
NORTH CENTRAL JR-SR HIGH SCHOOL (105 S EAST ST in MANLY, IA)
(National Center for Education Statistics) - STATE ID-984772 172 Organizations: NORTH CENTRAL COMM SCHOOL DISTRICT (SCHOOL DISTRICT)
NORTH CENTRAL COMMUNITY SCHOOL DISTRICT (105 SOUTH EAST STREET in MANLY, IA)
COMPLIANCE ACTIVITY (Tracking inspections of insecticide, fungicide, and rodenticide, and toxic substances) Alternative names: NORTH CENTRAL C S D, NORTH CENTRAL CSD
RANDALL TRANSIT MIX (1527 370TH STREET in MANLY, IA)
AIR MINOR (AIRS/AFS) Business SIC classification: READY-MIXED CONCRETE
HOYT REPAIR (801 S BROADWAY in MANLY, IA)
Conditionally Exempt Small Quantity Generators, less than 100 kg/month of hazardous waste (Resource Conservation and Recovery Act (tracking hazardous waste)) USED OIL PROGRAM (Resource Conservation and Recovery Act (tracking hazardous waste)) Business NAICS classification: GENERAL AUTOMOTIVE REPAIR.
Housing units lacking complete plumbing facilities: 7.0% Housing units lacking complete kitchen facilities: 6.3%
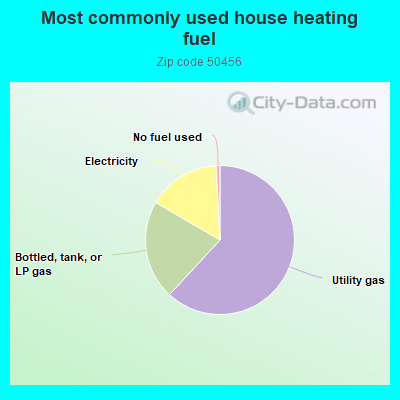
62.0%Utility gas
21.6%Bottled, tank, or LP gas
15.8%Electricity
0.8%No fuel used
Population in 1990: 1,757. Population change in the 1990s: +53 (+3.0%).
Place of birth for U.S.-born residents:
This state: 1,351
Northeast: 14
Midwest: 325
South: 12
West: 76
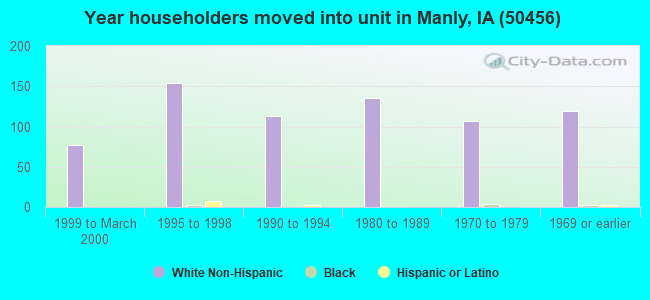
63% of the 50456 zip code residents lived in the same house 5 years ago. Out of people who lived in different houses, 42% lived in this county. Out of people who lived in different counties, 50% lived in Iowa.
95% of the 50456 zip code residents lived in the same house 1 year ago. Out of people who lived in different houses, 34% moved from this county. Out of people who lived in different houses, 34% moved from different county within same state. Out of people who lived in different houses, 36% moved from different state.
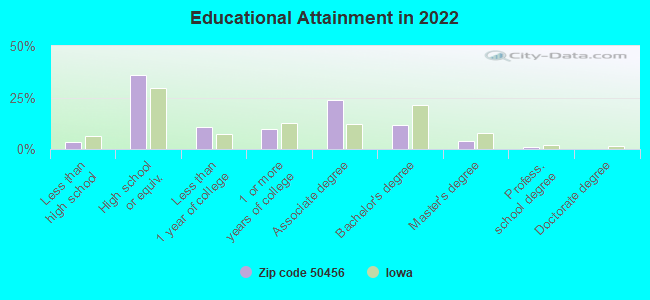
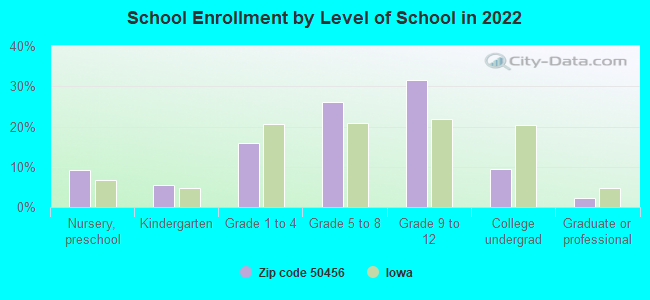
Private vs. public school enrollment:
Students in private schools in grades 1 to 8 (elementary and middle school): 2
Here:
1.2%
Iowa:
10.6%
Students in private schools in grades 9 to 12 (high school): 12
Here:
8.1%
Iowa:
7.9%
Students in private undergraduate colleges:
Here:
0.0%
Iowa:
23.9%
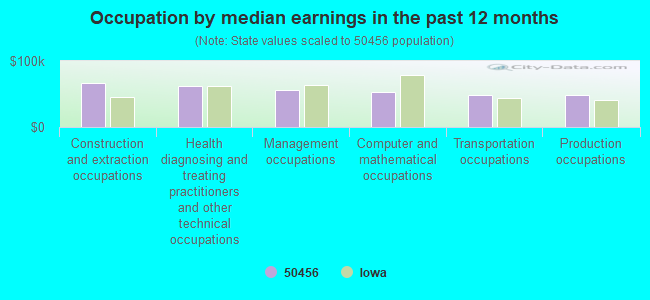
Occupation by median earnings in the past 12 months ($)
66,441Construction and extraction occupations
62,609Health diagnosing and treating practitioners and other technical occupations
55,715Management occupations
52,766Computer and mathematical occupations
48,868Transportation occupations
48,773Production occupations
Top industries in this zip code by the number of employees in 2005:
Health Care and Social Assistance: Nursing Care Facilities (20-49 employees: 1 establishment)
Accommodation and Food Services: Full-Service Restaurants (10-19: 1, 1-4: 1)
Wholesale Trade: Grain and Field Bean Merchant Wholesalers (10-19: 1)
Other Services (except Public Administration): Religious Organizations (1-4: 4)
Finance and Insurance: Commercial Banking (5-9: 1)
Construction: New Single-Family Housing Construction (except Operative Builders) (5-9: 1)
Health Care and Social Assistance: Community Food Services (5-9: 1)
People in group quarters in 2010:
37 people in nursing facilities/skilled-nursing facilities
People in group quarters in 2000:
30 people in nursing homes
Fatal accident statistics in 2011:
Fatal accident count: 1
Vehicles involved in fatal accidents: 1
Fatal accidents caused by drunken drivers: 0
Fatalities: 1
Persons involved in fatal accidents: 4
Pedestrians involved in fatal accidents: 0
2003 - 2018 National Fire Incident Reporting System (NFIRS) incidents
According to the data from the years 2003 - 2018 the average number of fire incidents per year is 7. The highest number of fire incidents - 19 took place in 2007, and the least - 1 in 2003. The data has a constant trend.
When looking into fire subcategories, the most reports belonged to: Structure Fires (41.7%), and Outside Fires (38.0%).
Fire incident types reported to NFIRS in Zip Code 50456


+$3,527
-$74
 Nearest zip codes: 50448, 50401, 50464, 50440, 50467, 50444.


 According to the data from the years 2003 - 2018 the average number of fire incidents per year is 7. The highest number of fire incidents - 19 took place in 2007, and the least - 1 in 2003. The data has a constant trend.
 When looking into fire subcategories, the most reports belonged to: Structure Fires (41.7%), and Outside Fires (38.0%).