Estimated zip code population in 2022: 20,894 Zip code population in 2010: 19,970 Zip code population in 2000: 19,299
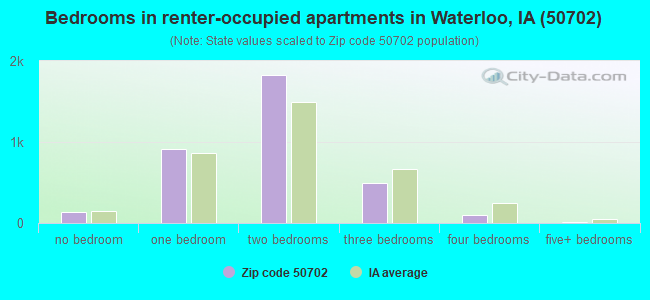
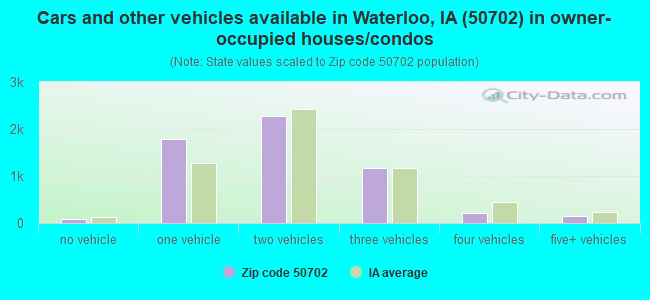
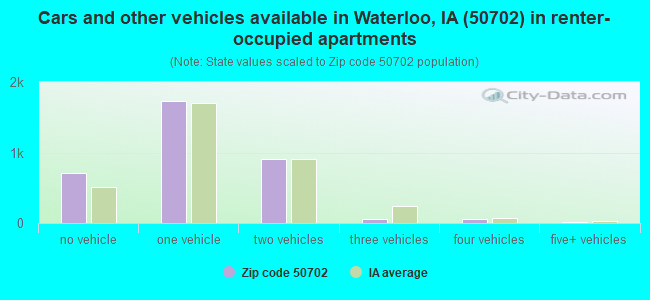
Houses and condos: 9,691 Renter-occupied apartments: 3,458
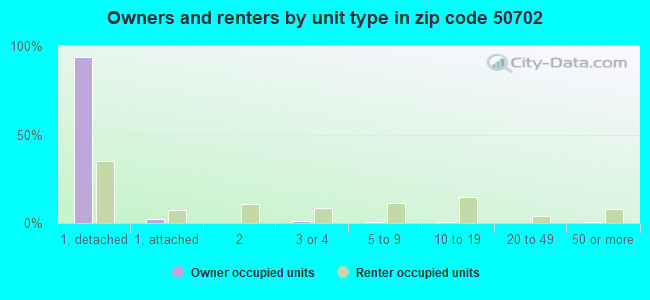
% of renters here:
38%
State:
28%
March 2022 cost of living index in zip code 50702: 84.2 (less than average, U.S. average is 100)
Land area: 9.4 sq. mi. Water area: 0.5 sq. mi.
Population density: 2,227 people per square mile
(low).
OSM Map
General Map
Google Map
MSN Map
OSM Map
General Map
Google Map
MSN Map
OSM Map
General Map
Google Map
MSN Map
OSM Map
General Map
Google Map
MSN Map
Please wait while loading the map...
Real estate property taxes paid for housing units in 2022:
This zip code:
1.6% ($2,444)
Iowa:
1.4% ($2,724)
Median real estate property taxes paid for housing units with mortgages in 2022: $2,417 (1.7%) Median real estate property taxes paid for housing units with no mortgage in 2022: $2,499 (1.6%)
Averages for the 2020 tax year for zip code 50702, filed in 2021:
Average Adjusted Gross Income (AGI) in 2020: $45,949 (Individual Income Tax Returns)
Here:
$45,949
State:
$71,087
Salary/wage: $40,908 (reported on 84.2% of returns)
Here:
$40,908
State:
$57,361
(% of AGI for various income ranges: 1163.3% for AGIs below $25k, 3675.6% for AGIs $25k-50k, 6611.6% for AGIs $50k-75k, 9952.2% for AGIs $75k-100k, 14691.6% for AGIs $100k-200k)
Taxable interest for individuals: $926 (reported on 28.6% of returns)
This zip code:
$926
Iowa:
$1,633
(% of AGI for various income ranges: 16.7% for AGIs below $25k, 15.4% for AGIs $25k-50k, 51.3% for AGIs $50k-75k, 79.3% for AGIs $75k-100k, 123.0% for AGIs $100k-200k)
Ordinary dividends: $3,932 (reported on 13.4% of returns)
Here:
$3,932
State:
$5,432
(% of AGI for various income ranges: 21.8% for AGIs below $25k, 22.8% for AGIs $25k-50k, 84.2% for AGIs $50k-75k, 130.3% for AGIs $75k-100k, 382.0% for AGIs $100k-200k)
Net capital gain/loss in AGI: +$5,949 (reported on 11.1% of returns)
Here:
+$5,949
State:
+$15,243
(% of AGI for various income ranges: 7.2% for AGIs below $25k, 15.4% for AGIs $25k-50k, 45.6% for AGIs $50k-75k, 118.8% for AGIs $75k-100k, 591.8% for AGIs $100k-200k)
Profit/loss from business: +$10,618 (reported on 10.6% of returns)
Here:
+$10,618
State:
+$11,763
(% of AGI for various income ranges: 84.9% for AGIs below $25k, 90.1% for AGIs $25k-50k, 191.8% for AGIs $50k-75k, 368.0% for AGIs $75k-100k, 485.0% for AGIs $100k-200k)
Taxable individual retirement arrangement distribution: $13,723 (reported on 8.3% of returns)
50702:
$13,723
Iowa:
$17,324
(% of AGI for various income ranges: 49.4% for AGIs below $25k, 71.1% for AGIs $25k-50k, 190.2% for AGIs $50k-75k, 267.5% for AGIs $75k-100k, 976.8% for AGIs $100k-200k)
Total itemized deductions: $26,534 (reported on 3.2% of returns)
Here:
$26,534
State:
$33,775
(% of AGI for various income ranges: 44.4% for AGIs below $25k, 63.1% for AGIs $25k-50k, 154.4% for AGIs $50k-75k, 222.3% for AGIs $75k-100k, 556.4% for AGIs $100k-200k)
Charity contributions: $6,939 (reported on 2.3% of returns)
Here:
$6,939
State:
$13,075
(% of AGI for various income ranges: 3.1% for AGIs below $25k, 7.7% for AGIs $25k-50k, 33.1% for AGIs $50k-75k, 47.0% for AGIs $75k-100k, 142.0% for AGIs $100k-200k)
Taxes paid: $4,838 (reported on 3.2% of returns)
50702:
$4,838
State:
$7,704
(% of AGI for various income ranges: 4.6% for AGIs below $25k, 8.4% for AGIs $25k-50k, 23.5% for AGIs $50k-75k, 51.3% for AGIs $75k-100k, 138.9% for AGIs $100k-200k)
Earned income credit: $2,299 (reported on 19.6% of returns)
Here:
$2,299
State:
$2,195
(% of AGI for various income ranges: 103.3% for AGIs below $25k, 68.8% for AGIs $25k-50k, 1.7% for AGIs $50k-75k)
Percentage of individuals using paid preparers for their 2020 taxes: 93.2%
Here:
93%
State:
95%
(% for various income ranges: 92.6% for AGIs below $25k, 93.5% for AGIs $25k-50k, 92.9% for AGIs $50k-75k, 93.3% for AGIs $75k-100k, 94.4% for AGIs $100k-200k, 100.0% for AGIs over 200k)
Averages for the 2012 tax year for zip code 50702, filed in 2013:
Average Adjusted Gross Income (AGI) in 2012: $39,865 (Individual Income Tax Returns)
Here:
$39,865
State:
$58,860
Salary/wage: $36,057 (reported on 85.1% of returns)
Here:
$36,057
State:
$46,659
(% of AGI for various income ranges: 74.0% for AGIs below $25k, 79.9% for AGIs $25k-50k, 78.6% for AGIs $50k-75k, 79.7% for AGIs $75k-100k, 74.7% for AGIs $100k-200k, 43.5% for AGIs over 200k)
Taxable interest for individuals: $955 (reported on 37.3% of returns)
This zip code:
$955
Iowa:
$1,537
(% of AGI for various income ranges: 1.5% for AGIs below $25k, 0.8% for AGIs $25k-50k, 0.8% for AGIs $50k-75k, 0.8% for AGIs $75k-100k, 0.9% for AGIs $100k-200k, 0.4% for AGIs over 200k)
Ordinary dividends: $3,197 (reported on 16.0% of returns)
Here:
$3,197
State:
$4,542
(% of AGI for various income ranges: 1.6% for AGIs below $25k, 0.8% for AGIs $25k-50k, 1.2% for AGIs $50k-75k, 1.4% for AGIs $75k-100k, 1.8% for AGIs $100k-200k, 2.5% for AGIs over 200k)
Net capital gain/loss in AGI: +$2,668 (reported on 11.5% of returns)
Here:
+$2,668
State:
+$11,802
(% of AGI for various income ranges: 0.2% for AGIs $25k-50k, 0.6% for AGIs $50k-75k, 0.8% for AGIs $75k-100k, 3.3% for AGIs $100k-200k)
Profit/loss from business: +$9,987 (reported on 11.2% of returns)
Here:
+$9,987
State:
+$10,509
(% of AGI for various income ranges: 5.8% for AGIs below $25k, 3.1% for AGIs $25k-50k, 2.7% for AGIs $50k-75k, 1.4% for AGIs $75k-100k, 1.7% for AGIs $100k-200k)
Taxable individual retirement arrangement distribution: $8,968 (reported on 9.8% of returns)
50702:
$8,968
Iowa:
$11,773
(% of AGI for various income ranges: 2.7% for AGIs below $25k, 1.8% for AGIs $25k-50k, 2.1% for AGIs $50k-75k, 2.2% for AGIs $75k-100k, 3.1% for AGIs $100k-200k)
Total itemized deductions: $15,445 (23% of AGI, reported on 23.3% of returns)
Here:
$15,445
State:
$21,278
Here:
23.0% of AGI
State:
18.9% of AGI
(% of AGI for various income ranges: 6.9% for AGIs below $25k, 7.5% for AGIs $25k-50k, 8.6% for AGIs $50k-75k, 9.2% for AGIs $75k-100k, 12.9% for AGIs $100k-200k, 17.1% for AGIs over 200k)
Charity contributions: $2,767 (reported on 17.0% of returns)
Here:
$2,767
State:
$4,044
(% of AGI for various income ranges: 0.7% for AGIs below $25k, 0.7% for AGIs $25k-50k, 1.0% for AGIs $50k-75k, 1.3% for AGIs $75k-100k, 2.1% for AGIs $100k-200k, 4.5% for AGIs over 200k)
Taxes paid: $5,365 (reported on 23.3% of returns)
50702:
$5,365
State:
$8,846
(% of AGI for various income ranges: 1.2% for AGIs below $25k, 2.2% for AGIs $25k-50k, 2.9% for AGIs $50k-75k, 3.8% for AGIs $75k-100k, 5.9% for AGIs $100k-200k, 5.9% for AGIs over 200k)
Earned income credit: $2,124 (reported on 20.0% of returns)
Here:
$2,124
State:
$2,098
(% of AGI for various income ranges: 5.9% for AGIs below $25k, 1.0% for AGIs $25k-50k)
Percentage of individuals using paid preparers for their 2012 taxes: 63.4%
Here:
63%
State:
65%
(% for various income ranges: 58.5% for AGIs below $25k, 63.8% for AGIs $25k-50k, 68.6% for AGIs $50k-75k, 72.0% for AGIs $75k-100k, 68.9% for AGIs $100k-200k, 100.0% for AGIs over 200k)
Averages for the 2004 tax year for zip code 50702, filed in 2005:
Average Adjusted Gross Income (AGI) in 2004: $33,837 (Individual Income Tax Returns)
Here:
$33,837
State:
$43,875
Salary/wage: $30,890 (reported on 83.0% of returns)
Here:
$30,890
State:
$38,265
(% of AGI for various income ranges: 87.9% for AGIs below $10k, 70.9% for AGIs $10k-25k, 78.8% for AGIs $25k-50k, 80.6% for AGIs $50k-75k, 79.0% for AGIs $75k-100k, 57.0% for AGIs over 100k)
Taxable interest for individuals: $1,515 (reported on 51.9% of returns)
This zip code:
$1,515
Iowa:
$1,768
(% of AGI for various income ranges: 4.2% for AGIs below $10k, 4.0% for AGIs $10k-25k, 1.9% for AGIs $25k-50k, 2.0% for AGIs $50k-75k, 2.0% for AGIs $75k-100k, 1.9% for AGIs over 100k)
Taxable dividends: $2,647 (reported on 23.3% of returns)
Here:
$2,647
State:
$2,510
(% of AGI for various income ranges: 3.1% for AGIs below $10k, 2.0% for AGIs $10k-25k, 1.3% for AGIs $25k-50k, 1.5% for AGIs $50k-75k, 1.4% for AGIs $75k-100k, 4.0% for AGIs over 100k)
Net capital gain/loss: +$4,148 (reported on 17.5% of returns)
Here:
+$4,148
State:
+$6,139
(% of AGI for various income ranges: -1.2% for AGIs below $10k, 0.0% for AGIs $10k-25k, 0.6% for AGIs $25k-50k, 0.6% for AGIs $50k-75k, 0.9% for AGIs $75k-100k, 14.5% for AGIs over 100k)
Profit/loss from business: +$7,201 (reported on 10.9% of returns)
Here:
+$7,201
State:
+$8,574
(% of AGI for various income ranges: 1.1% for AGIs below $10k, 3.0% for AGIs $10k-25k, 2.5% for AGIs $25k-50k, 1.3% for AGIs $50k-75k, 2.4% for AGIs $75k-100k, 3.5% for AGIs over 100k)
IRA payment deduction: $2,484 (reported on 2.2% of returns)
50702:
$2,484
Iowa:
$2,970
(% of AGI for various income ranges: 0.2% for AGIs $10k-25k, 0.3% for AGIs $25k-50k, 0.1% for AGIs $50k-75k, 0.2% for AGIs $75k-100k)
Self-employed pension: $9,917 (reported on 0.3% of returns)
Here:
$9,917
Iowa:
$11,928
Total itemized deductions: $13,580 (24% of AGI, reported on 28.9% of returns)
Here:
$13,580
State:
$16,976
Here:
24.4% of AGI
State:
20.8% of AGI
(% of AGI for various income ranges: 7.3% for AGIs below $10k, 10.4% for AGIs $10k-25k, 10.8% for AGIs $25k-50k, 11.9% for AGIs $50k-75k, 13.0% for AGIs $75k-100k, 13.9% for AGIs over 100k)
Charity contributions deductions: $2,780 (5% of AGI, reported on 24.9% of returns)
Here:
$2,780
State:
$3,089
Here:
4.8% of AGI
State:
3.6% of AGI
(% of AGI for various income ranges: 1.0% for AGIs below $10k, 1.3% for AGIs $10k-25k, 1.6% for AGIs $25k-50k, 1.7% for AGIs $50k-75k, 2.4% for AGIs $75k-100k, 4.8% for AGIs over 100k)
Total tax: $3,669 (reported on 73.9% of returns)
50702:
$3,669
State:
$6,177
(% of AGI for various income ranges: 2.0% for AGIs below $10k, 3.6% for AGIs $10k-25k, 6.6% for AGIs $25k-50k, 8.1% for AGIs $50k-75k, 10.6% for AGIs $75k-100k, 16.0% for AGIs over 100k)
Earned income credit: $1,628 (reported on 16.6% of returns)
Here:
$1,628
State:
$1,540
Percentage of individuals using paid preparers for their 2004 taxes: 67.4%
Here:
67%
State:
70%
(% for various income ranges: 59.6% for AGIs below $10k, 67.1% for AGIs $10k-25k, 69.2% for AGIs $25k-50k, 71.7% for AGIs $50k-75k, 72.4% for AGIs $75k-100k, 71.7% for AGIs over 100k)
Likely homosexual households (counted as self-reported same-sex unmarried-partner households)
Lesbian couples: 0.0% of all households
Gay men: 1.0% of all households
Household received Food Stamps/SNAP in the past 12 months: 1,351 Household did not receive Food Stamps/SNAP in the past 12 months: 7,722
Women who had a birth in the past 12 months: 399 (263 now married, 132 unmarried) Women who did not have a birth in the past 12 months: 4,555 (1,851 now married, 2,705 unmarried)
Housing units in zip code 50702 with a mortgage: 3,813 (728 second mortgage, 15 home equity loan, 573 both second mortgage and home equity loan) Houses without a mortgage: 181
Median monthly owner costs for units with a mortgage: $1,137 Median monthly owner costs for units without a mortgage: $503
Residents with income below the poverty level in 2022:
This zip code:
12.6%
Whole state:
11.0%
Residents with income below 50% of the poverty level in 2022:
This zip code:
6.6%
Whole state:
5.5%
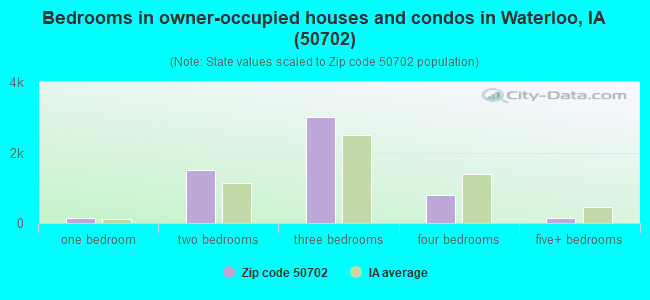
Median number of rooms in houses and condos:
Here:
5.8
State:
6.8
Median number of rooms in apartments:
Here:
4.1
State:
4.2
Notable locations in this zip code not listed on our city pages
Churches in zip code 50702 include: Christian Fellowship Baptist Church (A), Grace Lutheran Church (B), Saint Ansgars Lutheran Church (C), Ambassadors for Christ Church (D), First Evangelical Free Church (E), Kimball Avenue United Methodist Church (F), Westminister Presbyterian Church (G), Saint Edwards Church (H), Central Christian Church (I). Display/hide their locations on the map
Parks in zip code 50702 include: Bontrager Park (1), Cedar Terrace Park (2), Lloyd Randall Park (3), Leavitt Park (4), Rooff Park (5), Riverview Recreation Area (6), Liberty Park (7), Miller Park (8), Morris Park (9). Display/hide their locations on the map
In group quarters: 228 (-1 institutionalized population)
Size of family households: 2,147 2-persons, 1,388 3-persons, 828 4-persons, 425 5-persons, 278 6-persons, 118 7-or-more-persons
Size of nonfamily households: 3,234 1-person, 695 2-persons, 31 3-persons
3,005 married couples with children.
1,422 single-parent households (455 men, 967 women).
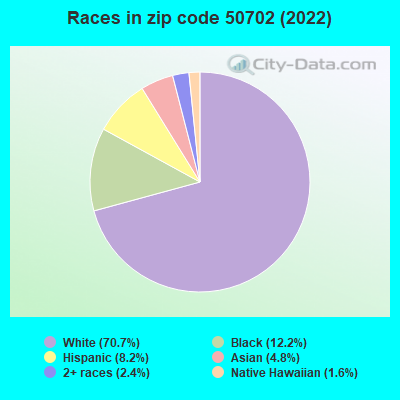
79.4% of residents of 50702 zip code speak English at home.
6.1% of residents speak Spanish at home (51% very well, 35% well, 13% not well, 1% not at all).
9.5% of residents speak other Indo-European language at home (37% very well, 26% well, 31% not well, 6% not at all).
4.1% of residents speak Asian or Pacific Island language at home (28% very well, 29% well, 22% not well, 22% not at all).
0.7% of residents speak other language at home (93% very well, 7% well).
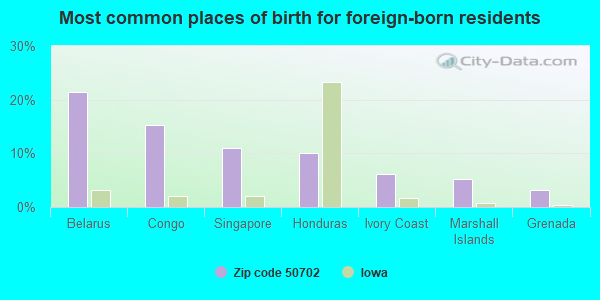
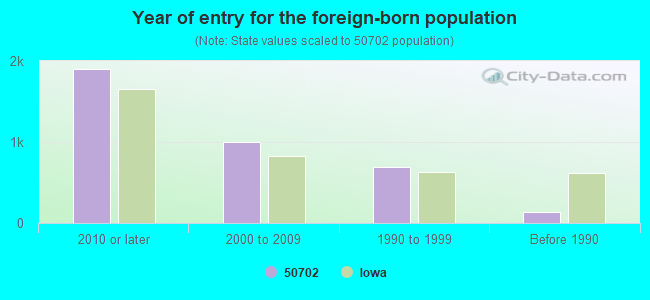
Foreign born population: 3,404 (16.3%) (38.2% of them are naturalized citizens)
Major facilities with environmental interests located in this zip code:
BERTCH CABINET MANUFACTURING INC (4747 CRESTWOOD DRIVE in WATERLOO, IA)
AIR MAJOR (AIRS/AFS) CRITERIA AND HAZARDOUS AIR POLLUTANT INVENTORY (Inventory of air pollution sources) HAZARDOUS WASTE BIENNIAL REPORTER (Resource Conservation and Recovery Act (tracking hazardous waste)) - ICIS-, ENFORCEMENT/COMPLIANCE ACTIVITY Large Quantity Generators, more that 1000 kg of hazardous waste/month (Resource Conservation and Recovery Act (tracking hazardous waste)) - notification - ICIS-, ENFORCEMENT/COMPLIANCE ACTIVITY TSD (Resource Conservation and Recovery Act (tracking hazardous waste)) - ICIS-, ENFORCEMENT/COMPLIANCE ACTIVITY TRI REPORTER (Tracking of toxic chemicals releasing facilities) Business SIC classification: WOOD KITCHEN CABINETS Business NAICS classification: WOOD KITCHEN CABINET AND COUNTERTOP MANUFACTURING. Organizations: BERTCH CABINET MFG (CONTACT/OPERATOR)
Alternative names: BERTCH CABINET MFG. INC.
TIRES PLUS (2710 CROSSROADS BOULEVARD in WATERLOO, IA)
AIR MINOR (AIRS/AFS) (Integrated Compliance Information System) - ICIS-07-1998-0240, FORMAL ENFORCEMENT ACTION Conditionally Exempt Small Quantity Generators, less than 100 kg/month of hazardous waste (Resource Conservation and Recovery Act (tracking hazardous waste)) - ICIS-, ENFORCEMENT/COMPLIANCE ACTIVITY Business SIC classification: GENERAL AUTOMOTIVE REPAIR SHOPS Business NAICS classification: ALL OTHER AUTOMOTIVE REPAIR AND MAINTENANCE. Alternative names: TIRES PLUS WATERLOO
AIR MAJOR (AIRS/AFS) (Integrated Compliance Information System) - ICIS-07-1995-0057, FORMAL ENFORCEMENT ACTION HAZARDOUS WASTE BIENNIAL REPORTER (Resource Conservation and Recovery Act (tracking hazardous waste)) Large Quantity Generators, more that 1000 kg of hazardous waste/month (Resource Conservation and Recovery Act (tracking hazardous waste)) TSD (Resource Conservation and Recovery Act (tracking hazardous waste)) Business SIC classification: WOOD KITCHEN CABINETS Alternative names: BERTCH CABINET OASIS DIVISION
COVENANT MEDICAL CENTER (3421 WEST 9TH STREET in WATERLOO, IA)
AIR SYNTHETIC MINOR (AIRS/AFS) COMPLIANCE ACTIVITY (Tracking inspections of insecticide, fungicide, and rodenticide, and toxic substances) National Pollutant Discharge Elimination System NON-MAJOR (Tracking pollutant discharge elimination systems) - permit Small Quantity Generators, between 100 kg and 1000 kg of hazardous waste/month (Resource Conservation and Recovery Act (tracking hazardous waste)) - notification - ICIS-, ENFORCEMENT/COMPLIANCE ACTIVITY Business SIC classification: COMBINATION UTILITIES; GENERAL MEDICAL AND SURGICAL HOSPITALS Alternative names: CONVENANT MEDICAL CENTER, COVENANT MEDICAL CENTER-COOLIN
RYDELL CHEVROLET INC (1325 EAST SAN MARNAN DRIVE in WATERLOO, IA)
AIR SYNTHETIC MINOR (AIRS/AFS) AIR MINOR (AIRS/AFS) Small Quantity Generators, between 100 kg and 1000 kg of hazardous waste/month (Resource Conservation and Recovery Act (tracking hazardous waste)) - ICIS-07-2005-0294, ENFORCEMENT/COMPLIANCE ACTIVITY Business SIC classification: MOTOR VEHICLE DEALERS (NEW AND USED); TOP, BODY, AND UPHOLSTERY REPAIR SHOPS AND PAINT SHOPS; GENERAL AUTOMOTIVE REPAIR SHOPS
COMMUNITY AUTO PLAZA (1045 EAST SAN MARNAN DRIVE in WATERLOO, IA)
AIR MINOR (AIRS/AFS) (Resource Conservation and Recovery Act (tracking hazardous waste)) - ICIS-, ENFORCEMENT/COMPLIANCE ACTIVITY Business SIC classification: MOTOR VEHICLE DEALERS (NEW AND USED) Business NAICS classification: AUTOMOTIVE BODY, PAINT, AND INTERIOR REPAIR AND MAINTENANCE.
TANDEM TIRE & AUTO (2915 CROSSROADS BLVD in WATERLOO, IA)
(Integrated Compliance Information System) - ICIS-07-1998-0245, FORMAL ENFORCEMENT ACTION (Resource Conservation and Recovery Act (tracking hazardous waste)) Business NAICS classification: GENERAL AUTOMOTIVE REPAIR. Organizations: GERALD SCHOENFELDER (CONTACT/OWNER)
Alternative names: TANDEM TIRE & AUTO - FORMER SITE OF
CONVENANT MEDICAL CTR-KIMBLE RIDGE CTR (2101 KIMBALL AVENUE in WATERLOO, IA)
AIR SYNTHETIC MINOR (AIRS/AFS) Conditionally Exempt Small Quantity Generators, less than 100 kg/month of hazardous waste (Resource Conservation and Recovery Act (tracking hazardous waste)) - ICIS-, ENFORCEMENT/COMPLIANCE ACTIVITY Business SIC classification: COMBINATION UTILITIES; GENERAL MEDICAL AND SURGICAL HOSPITALS Organizations: COVENANT HEALTH SYSTEM KIMBERLY RIDGE (CONTACT/OPERATOR)
, WHEATON FRANCISCAN (CONTACT/OWNER)
, COVENANT HEALTH SYSTEMS (CONTACT/OWNER)
Alternative names: CONVENANT MEDICAL CENTER, COVENANT MEDICAL CENTER
DAN DEERY MOTOR CO. (3900 ALEXANDER DR in WATERLOO, IA)
(Integrated Compliance Information System) - ICIS-07-1998-0237, FORMAL ENFORCEMENT ACTION
SODERBERG INCORPORATED (923 W 5TH ST in WATERLOO, IA)
AIR MINOR (AIRS/AFS) (Resource Conservation and Recovery Act (tracking hazardous waste)) Business SIC classification: OPHTHALMIC GOODS Alternative names: CLOSED FACILITY -- SODERBERG INCORPORATED, SODERBERG OPTICAL CO
CROSSROADS FORD, INC. (2030 LAPORTE in WATERLOO, IA)
(Integrated Compliance Information System) - ICIS-07-1998-0247, FORMAL ENFORCEMENT ACTION
CHASE AUTO PARTS COMPANY (1041 SHEFFIELD AVENUE in WATERLOO, IA)
Small Quantity Generators, between 100 kg and 1000 kg of hazardous waste/month (Resource Conservation and Recovery Act (tracking hazardous waste)) - notification (Resource Conservation and Recovery Act (tracking hazardous waste)) Organizations: GARY WENDEL (OWNER OF CHASE AUTO PARTS) (CONTACT/OWNER)
Alternative names: CHASE AUTO BODY
Housing units lacking complete plumbing facilities: 1.2% Housing units lacking complete kitchen facilities: 0.8%
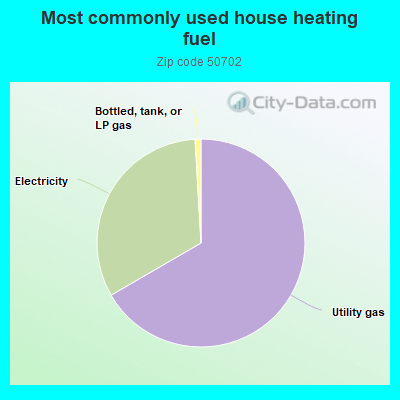
66.5%Utility gas
32.4%Electricity
0.9%Bottled, tank, or LP gas
Population in 1990: 18,939. Population change in the 1990s: +360 (+1.9%).
Place of birth for U.S.-born residents:
This state: 13,653
Northeast: 264
Midwest: 1,644
South: 1,016
West: 772
61% of the 50702 zip code residents lived in the same house 5 years ago. Out of people who lived in different houses, 68% lived in this county. Out of people who lived in different counties, 50% lived in Iowa.
89% of the 50702 zip code residents lived in the same house 1 year ago. Out of people who lived in different houses, 68% moved from this county. Out of people who lived in different houses, 10% moved from different county within same state. Out of people who lived in different houses, 18% moved from different state. Out of people who lived in different houses, 2% moved from abroad.
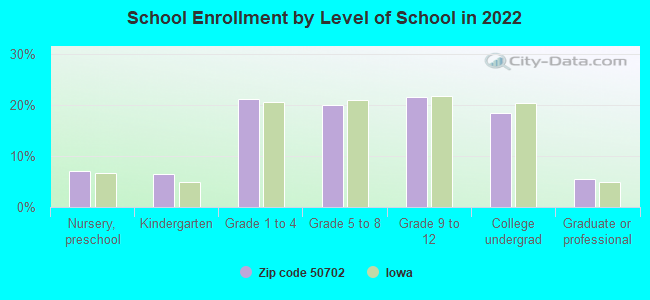
Private vs. public school enrollment:
Students in private schools in grades 1 to 8 (elementary and middle school): 285
Here:
14.4%
Iowa:
10.6%
Students in private schools in grades 9 to 12 (high school): 96
Here:
9.4%
Iowa:
7.9%
Students in private undergraduate colleges: 59
Here:
6.7%
Iowa:
23.9%
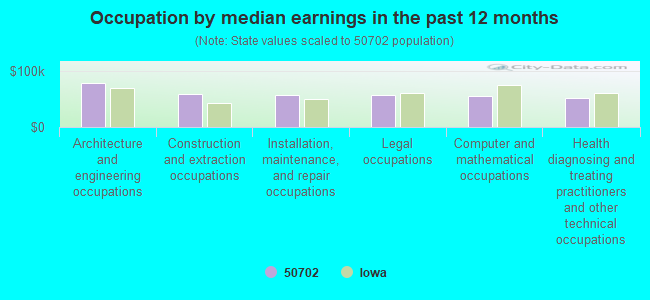
Occupation by median earnings in the past 12 months ($)
78,777Architecture and engineering occupations
58,246Construction and extraction occupations
56,954Installation, maintenance, and repair occupations
56,938Legal occupations
55,947Computer and mathematical occupations
52,245Health diagnosing and treating practitioners and other technical occupations
Companies with federal contracts located in this zip code:
VANDORNS JANITORIAL SERVICE (800 BOURLAND AVE in WATERLOO, IA; small business) : $8,760 in 7 contractsfrom 2000 to 2001
Contracts for Custodial Janitorial Services by Army Signed by year:2000: $4,620; 2001: $4,140; 2002: $0; 2003: $0; 2004: $0; 2005: $0; 2006: $0.
Biggest contracts:
$3,480 with Army for Custodial Janitorial Services. Signed on 2001-11-05. Completion date: 2002-09-30.
$3,480, same as above.Signed on 2000-11-13. Completion date: 2002-09-30.
$1,140, same as above.Signed on 2000-11-06. Completion date: 2002-09-30.
$900, same as above.Signed on 2001-11-05. Completion date: 2002-09-30.
HY-VEE, INC (1422 FLAMMANG DR in WATERLOO, IA)
$4,577 with Army for Food Services. Signed on 2004-07-23. Completion date: 2004-08-21.
Top industries in this zip code by the number of employees in 2005:
Health Care and Social Assistance: General Medical and Surgical Hospitals (over 1000 employees: 1 establishment)
2003 - 2018 National Fire Incident Reporting System (NFIRS) incidents
Based on the data from the years 2003 - 2018 the average number of fires per year is 30. The highest number of reported fires - 64 took place in 2018, and the least - 0 in 2004. The data has a growing trend.
When looking into fire subcategories, the most reports belonged to: Structure Fires (42.9%), and Outside Fires (29.0%).
Fire incident types reported to NFIRS in Zip Code 50702

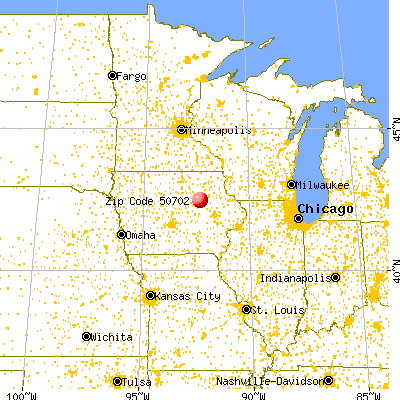


 Nearest zip codes: 50701, 50707, 50667, 50703, 50634, 50643.


 Based on the data from the years 2003 - 2018 the average number of fires per year is 30. The highest number of reported fires - 64 took place in 2018, and the least - 0 in 2004. The data has a growing trend.
 When looking into fire subcategories, the most reports belonged to: Structure Fires (42.9%), and Outside Fires (29.0%).