Estimated zip code population in 2022: 4,875 Zip code population in 2010: 5,245 Zip code population in 2000: 5,518
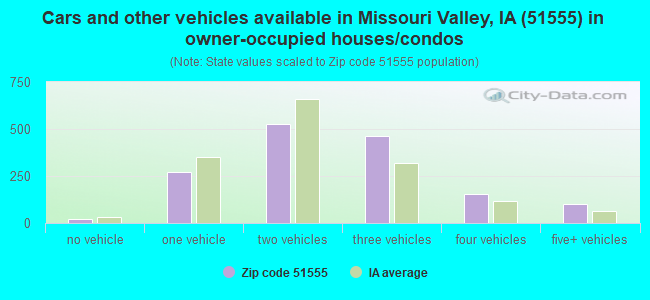
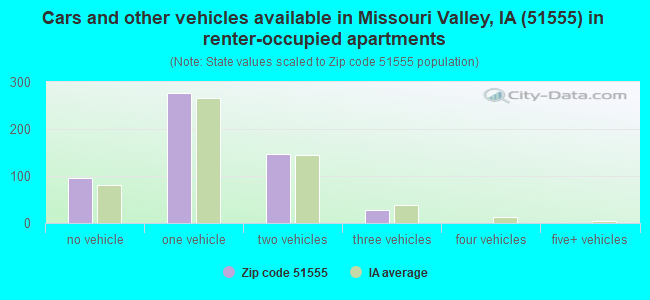
Houses and condos: 2,271 Renter-occupied apartments: 544
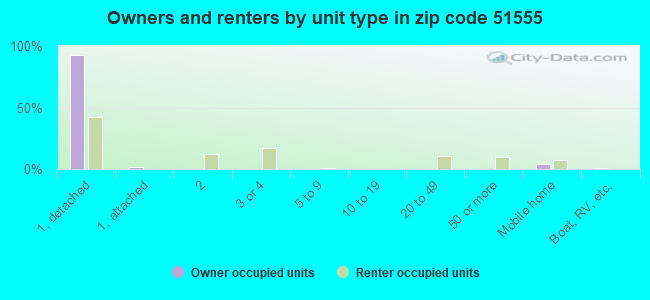
% of renters here:
26%
State:
28%
March 2022 cost of living index in zip code 51555: 87.5 (less than average, U.S. average is 100)
Land area: 155.9 sq. mi. Water area: 2.4 sq. mi.
Population density: 31 people per square mile
(very low).
OSM Map
General Map
Google Map
MSN Map
OSM Map
General Map
Google Map
MSN Map
OSM Map
General Map
Google Map
MSN Map
OSM Map
General Map
Google Map
MSN Map
Please wait while loading the map...
Real estate property taxes paid for housing units in 2022:
This zip code:
1.4% ($2,411)
Iowa:
1.4% ($2,724)
Median real estate property taxes paid for housing units with mortgages in 2022: $2,448 (1.4%) Median real estate property taxes paid for housing units with no mortgage in 2022: $2,347 (1.6%)
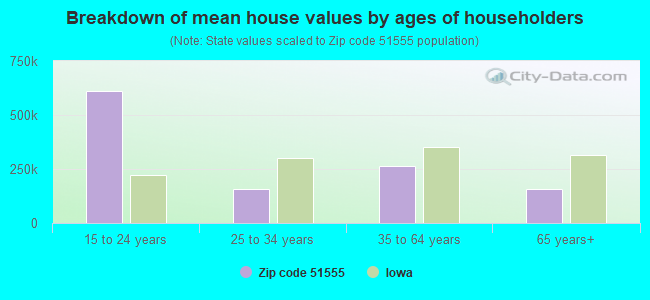
Estimated median house/condo value in 2022: $168,453
51555:
$168,453
Iowa:
$194,600
According to our research of Iowa and other state lists, there were 5 registered sex offenders living in 51555 zip code as of April 27, 2024. The ratio of all residents to sex offenders in zip code 51555 is 1,037 to 1. The ratio of registered sex offenders to all residents in this zip code is lower than the state average.
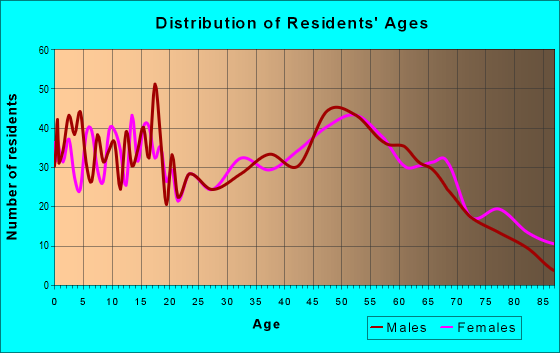
Median resident age:
This zip code:
42.6 years
Iowa median age:
38.9 years
Average household size:
This zip code:
2.3 people
Iowa:
2.3 people
Averages for the 2020 tax year for zip code 51555, filed in 2021:
Average Adjusted Gross Income (AGI) in 2020: $65,030 (Individual Income Tax Returns)
Here:
$65,030
State:
$71,087
Salary/wage: $56,206 (reported on 82.3% of returns)
Here:
$56,206
State:
$57,361
(% of AGI for various income ranges: 1264.8% for AGIs below $25k, 3655.0% for AGIs $25k-50k, 6207.9% for AGIs $50k-75k, 9597.2% for AGIs $75k-100k, 17880.9% for AGIs $100k-200k, 50460.0% for AGIs over 200k)
Taxable interest for individuals: $1,485 (reported on 32.5% of returns)
This zip code:
$1,485
Iowa:
$1,633
(% of AGI for various income ranges: 13.3% for AGIs below $25k, 22.5% for AGIs $25k-50k, 30.0% for AGIs $50k-75k, 122.2% for AGIs $75k-100k, 194.5% for AGIs $100k-200k, 900.0% for AGIs over 200k)
Ordinary dividends: $5,112 (reported on 17.3% of returns)
Here:
$5,112
State:
$5,432
(% of AGI for various income ranges: 16.0% for AGIs below $25k, 31.1% for AGIs $25k-50k, 71.0% for AGIs $50k-75k, 138.9% for AGIs $75k-100k, 274.5% for AGIs $100k-200k, 2890.0% for AGIs over 200k)
Net capital gain/loss in AGI: +$9,295 (reported on 16.5% of returns)
Here:
+$9,295
State:
+$15,243
(% of AGI for various income ranges: 16.5% for AGIs below $25k, 22.0% for AGIs $25k-50k, 118.6% for AGIs $50k-75k, 214.4% for AGIs $75k-100k, 548.6% for AGIs $100k-200k, 5326.7% for AGIs over 200k)
Profit/loss from business: +$5,939 (reported on 13.6% of returns)
Here:
+$5,939
State:
+$11,763
(% of AGI for various income ranges: 85.4% for AGIs below $25k, 70.5% for AGIs $25k-50k, 112.4% for AGIs $50k-75k, 210.6% for AGIs $75k-100k, 290.5% for AGIs $100k-200k)
Taxable individual retirement arrangement distribution: $17,240 (reported on 10.3% of returns)
51555:
$17,240
Iowa:
$17,324
(% of AGI for various income ranges: 57.5% for AGIs below $25k, 120.7% for AGIs $25k-50k, 177.2% for AGIs $50k-75k, 405.6% for AGIs $75k-100k, 1016.4% for AGIs $100k-200k)
Total itemized deductions: $33,942 (reported on 4.9% of returns)
Here:
$33,942
State:
$33,775
(% of AGI for various income ranges: 249.1% for AGIs $25k-50k, 268.9% for AGIs $75k-100k, 618.6% for AGIs $100k-200k, 3773.3% for AGIs over 200k)
Charity contributions: $7,644 (reported on 3.7% of returns)
Here:
$7,644
State:
$13,075
(% of AGI for various income ranges: 62.8% for AGIs $50k-75k, 230.0% for AGIs $100k-200k)
Taxes paid: $7,567 (reported on 4.9% of returns)
51555:
$7,567
State:
$7,704
(% of AGI for various income ranges: 35.2% for AGIs $25k-50k, 98.3% for AGIs $75k-100k, 161.8% for AGIs $100k-200k, 733.3% for AGIs over 200k)
Earned income credit: $2,027 (reported on 13.6% of returns)
Here:
$2,027
State:
$2,195
(% of AGI for various income ranges: 83.1% for AGIs below $25k, 53.9% for AGIs $25k-50k)
Percentage of individuals using paid preparers for their 2020 taxes: 95.9%
Here:
96%
State:
95%
(% for various income ranges: 94.4% for AGIs below $25k, 96.4% for AGIs $25k-50k, 97.4% for AGIs $50k-75k, 96.3% for AGIs $75k-100k, 97.5% for AGIs $100k-200k, 88.9% for AGIs over 200k)
Averages for the 2012 tax year for zip code 51555, filed in 2013:
Average Adjusted Gross Income (AGI) in 2012: $55,334 (Individual Income Tax Returns)
Here:
$55,334
State:
$58,860
Salary/wage: $44,643 (reported on 84.6% of returns)
Here:
$44,643
State:
$46,659
(% of AGI for various income ranges: 75.4% for AGIs below $25k, 74.4% for AGIs $25k-50k, 77.3% for AGIs $50k-75k, 75.7% for AGIs $75k-100k, 71.9% for AGIs $100k-200k, 34.1% for AGIs over 200k)
Taxable interest for individuals: $1,073 (reported on 34.4% of returns)
This zip code:
$1,073
Iowa:
$1,537
(% of AGI for various income ranges: 1.3% for AGIs below $25k, 0.6% for AGIs $25k-50k, 0.7% for AGIs $50k-75k, 0.4% for AGIs $75k-100k, 0.8% for AGIs $100k-200k, 0.4% for AGIs over 200k)
Ordinary dividends: $6,442 (reported on 17.8% of returns)
Here:
$6,442
State:
$4,542
(% of AGI for various income ranges: 1.3% for AGIs below $25k, 0.6% for AGIs $25k-50k, 0.7% for AGIs $50k-75k, 0.8% for AGIs $75k-100k, 1.3% for AGIs $100k-200k, 8.4% for AGIs over 200k)
Net capital gain/loss in AGI: +$13,406 (reported on 13.3% of returns)
Here:
+$13,406
State:
+$11,802
(% of AGI for various income ranges: 0.3% for AGIs $25k-50k, 1.0% for AGIs $50k-75k, 1.1% for AGIs $75k-100k, 2.4% for AGIs $100k-200k, 14.0% for AGIs over 200k)
Profit/loss from business: +$7,846 (reported on 15.4% of returns)
Here:
+$7,846
State:
+$10,509
(% of AGI for various income ranges: 5.1% for AGIs below $25k, 4.4% for AGIs $25k-50k, 2.5% for AGIs $50k-75k, 2.9% for AGIs $75k-100k, 0.6% for AGIs $100k-200k)
Taxable individual retirement arrangement distribution: $9,808 (reported on 10.4% of returns)
51555:
$9,808
Iowa:
$11,773
(% of AGI for various income ranges: 2.6% for AGIs below $25k, 2.6% for AGIs $25k-50k, 1.5% for AGIs $50k-75k, 1.2% for AGIs $75k-100k, 2.8% for AGIs $100k-200k)
Total itemized deductions: $19,364 (20% of AGI, reported on 33.2% of returns)
Here:
$19,364
State:
$21,278
Here:
20.4% of AGI
State:
18.9% of AGI
(% of AGI for various income ranges: 12.1% for AGIs below $25k, 9.3% for AGIs $25k-50k, 10.7% for AGIs $50k-75k, 11.9% for AGIs $75k-100k, 13.4% for AGIs $100k-200k, 11.3% for AGIs over 200k)
Charity contributions: $2,834 (reported on 25.3% of returns)
Here:
$2,834
State:
$4,044
(% of AGI for various income ranges: 0.7% for AGIs below $25k, 0.8% for AGIs $25k-50k, 1.0% for AGIs $50k-75k, 1.0% for AGIs $75k-100k, 1.6% for AGIs $100k-200k, 2.2% for AGIs over 200k)
Taxes paid: $7,639 (reported on 33.2% of returns)
51555:
$7,639
State:
$8,846
(% of AGI for various income ranges: 2.0% for AGIs below $25k, 2.5% for AGIs $25k-50k, 3.5% for AGIs $50k-75k, 4.9% for AGIs $75k-100k, 6.5% for AGIs $100k-200k, 5.6% for AGIs over 200k)
Earned income credit: $2,081 (reported on 15.4% of returns)
Here:
$2,081
State:
$2,098
(% of AGI for various income ranges: 5.4% for AGIs below $25k, 0.9% for AGIs $25k-50k)
Percentage of individuals using paid preparers for their 2012 taxes: 71.4%
Here:
71%
State:
65%
(% for various income ranges: 62.8% for AGIs below $25k, 70.7% for AGIs $25k-50k, 76.3% for AGIs $50k-75k, 80.0% for AGIs $75k-100k, 82.1% for AGIs $100k-200k, 83.3% for AGIs over 200k)
Averages for the 2004 tax year for zip code 51555, filed in 2005:
Average Adjusted Gross Income (AGI) in 2004: $40,211 (Individual Income Tax Returns)
Here:
$40,211
State:
$43,875
Salary/wage: $37,024 (reported on 85.0% of returns)
Here:
$37,024
State:
$38,265
(% of AGI for various income ranges: 144.4% for AGIs below $10k, 72.5% for AGIs $10k-25k, 78.1% for AGIs $25k-50k, 81.2% for AGIs $50k-75k, 81.6% for AGIs $75k-100k, 69.7% for AGIs over 100k)
Taxable interest for individuals: $1,589 (reported on 48.2% of returns)
This zip code:
$1,589
Iowa:
$1,768
(% of AGI for various income ranges: 7.4% for AGIs below $10k, 2.8% for AGIs $10k-25k, 1.9% for AGIs $25k-50k, 1.5% for AGIs $50k-75k, 1.4% for AGIs $75k-100k, 2.1% for AGIs over 100k)
Taxable dividends: $1,795 (reported on 21.4% of returns)
Here:
$1,795
State:
$2,510
(% of AGI for various income ranges: 2.3% for AGIs below $10k, 0.8% for AGIs $10k-25k, 0.8% for AGIs $25k-50k, 0.7% for AGIs $50k-75k, 0.9% for AGIs $75k-100k, 1.6% for AGIs over 100k)
Net capital gain/loss: +$3,795 (reported on 19.3% of returns)
Here:
+$3,795
State:
+$6,139
(% of AGI for various income ranges: -3.0% for AGIs below $10k, 0.9% for AGIs $10k-25k, 0.9% for AGIs $25k-50k, 1.3% for AGIs $50k-75k, 1.4% for AGIs $75k-100k, 4.9% for AGIs over 100k)
Profit/loss from business: +$4,591 (reported on 15.7% of returns)
Here:
+$4,591
State:
+$8,574
(% of AGI for various income ranges: 5.8% for AGIs below $10k, 3.3% for AGIs $10k-25k, 2.3% for AGIs $25k-50k, 1.9% for AGIs $50k-75k, 0.9% for AGIs $75k-100k, 0.9% for AGIs over 100k)
Profit/loss from farming: +$227 (reported on 5.1% of returns)
Here:
+$227
State:
-$74
(% of AGI for various income ranges: 1.3% for AGIs $10k-25k, -0.1% for AGIs $25k-50k, -0.3% for AGIs $50k-75k, -0.7% for AGIs $75k-100k, 0.7% for AGIs over 100k)
IRA payment deduction: $2,718 (reported on 3.0% of returns)
51555:
$2,718
Iowa:
$2,970
Total itemized deductions: $15,227 (22% of AGI, reported on 32.2% of returns)
Here:
$15,227
State:
$16,976
Here:
22.1% of AGI
State:
20.8% of AGI
(% of AGI for various income ranges: 11.9% for AGIs below $10k, 8.8% for AGIs $10k-25k, 9.4% for AGIs $25k-50k, 12.1% for AGIs $50k-75k, 15.6% for AGIs $75k-100k, 14.2% for AGIs over 100k)
Charity contributions deductions: $2,209 (3% of AGI, reported on 26.9% of returns)
Here:
$2,209
State:
$3,089
Here:
3.1% of AGI
State:
3.6% of AGI
(% of AGI for various income ranges: 1.1% for AGIs $10k-25k, 1.1% for AGIs $25k-50k, 1.1% for AGIs $50k-75k, 1.8% for AGIs $75k-100k, 2.4% for AGIs over 100k)
Total tax: $4,754 (reported on 76.1% of returns)
51555:
$4,754
State:
$6,177
(% of AGI for various income ranges: 3.8% for AGIs below $10k, 4.2% for AGIs $10k-25k, 6.8% for AGIs $25k-50k, 8.0% for AGIs $50k-75k, 9.6% for AGIs $75k-100k, 15.0% for AGIs over 100k)
Earned income credit: $1,462 (reported on 13.4% of returns)
Here:
$1,462
State:
$1,540
Percentage of individuals using paid preparers for their 2004 taxes: 75.1%
Here:
75%
State:
70%
(% for various income ranges: 63.4% for AGIs below $10k, 75.4% for AGIs $10k-25k, 78.2% for AGIs $25k-50k, 79.4% for AGIs $50k-75k, 77.0% for AGIs $75k-100k, 81.4% for AGIs over 100k)
Household received Food Stamps/SNAP in the past 12 months: 185 Household did not receive Food Stamps/SNAP in the past 12 months: 1,896
Women who had a birth in the past 12 months: 69 (45 now married, 23 unmarried) Women who did not have a birth in the past 12 months: 1,037 (551 now married, 485 unmarried)
Housing units in zip code 51555 with a mortgage: 936 (116 second mortgage, 7 home equity loan, 73 both second mortgage and home equity loan) Houses without a mortgage: 9
Median monthly owner costs for units with a mortgage: $1,319 Median monthly owner costs for units without a mortgage: $530
Residents with income below the poverty level in 2022:
This zip code:
5.7%
Whole state:
11.0%
Residents with income below 50% of the poverty level in 2022:
This zip code:
4.1%
Whole state:
5.5%
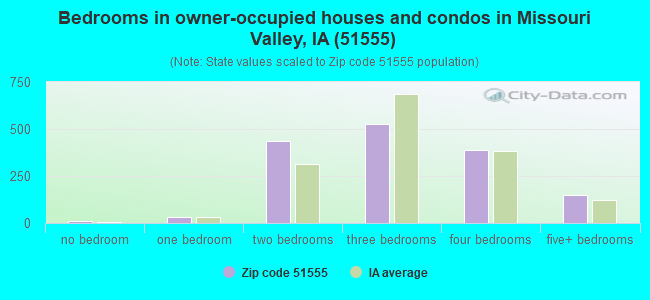
Median number of rooms in houses and condos:
Here:
7.1
State:
6.8
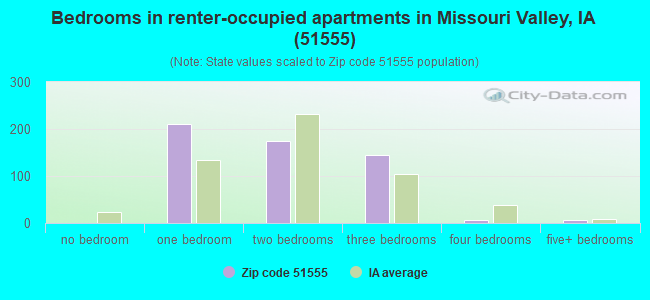
Median number of rooms in apartments:
Here:
4.3
State:
4.2
Notable locations in this zip code not listed on our city pages
Notable locations in zip code 51555: Logan-Missouri Valley Country Club (A), Rand Access (B), Roadside Rest Area (C), Findlay (D), California Junction (E), United Western Co-op Elevator (F), Missouri Valley Grain Incorporated Elevator (G), Harrison County Fairground (H), Harrison County Historical Village and Welcome Center (I), Missouri Valley (J), Missouri Valley South Bound Rest Area (K), Missouri Valley North Bound Rest Area (L), Loveland East Bound Rest Area (M), Loveland West Bound Rest Area (N), Loveland (O), Missouri Valley Fire Department (P), Missouri Valley Police Dapartment (Q), Missouri Valley Library (R). Display/hide their locations on the map
Churches in zip code 51555 include: Christ Community Fellowship (A), Reorganized Church of Jesus Christ of Latter Day Saints (B), Church of Christ (C), Saint Paul Lutheran Church (D), First Presbyterian Church (E), First Baptist Church (F), Saint Patricks Church (G), Church of the Nazarene (H), First Lutheran Church (I). Display/hide their locations on the map
Cemeteries: Oak Grove Cemetery (1), Calhoun Cemetery (2), Rose Hill Cemetery (3), Greenwood Cemetery (4), Old Frazier Cemetery (5), Mount Carmel Cemetery (6). Display/hide their locations on the map
Parks in zip code 51555 include: California Bend State Wildlife Refuge (1), Sawmill Hollow Wildlife Area (2), Wilson Island State Park (3), Saint Johns Wildlife Area (4), Fish Lake Wildlife Area (5), Nobles Lake State Wildlife Management Area (6). Display/hide their locations on the map
In group quarters: 109 (-1 institutionalized population)
Size of family households: 660 2-persons, 277 3-persons, 278 4-persons, 125 5-persons, 31 6-persons, 13 7-or-more-persons
Size of nonfamily households: 565 1-person, 125 2-persons
769 married couples with children.
213 single-parent households (72 men, 141 women).
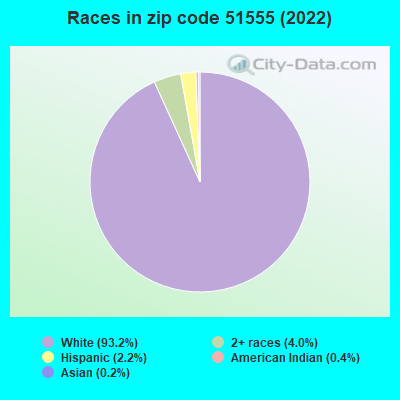
97.8% of residents of 51555 zip code speak English at home.
1.4% of residents speak Spanish at home (71% very well, 29% well).
0.6% of residents speak other Indo-European language at home (100% very well).
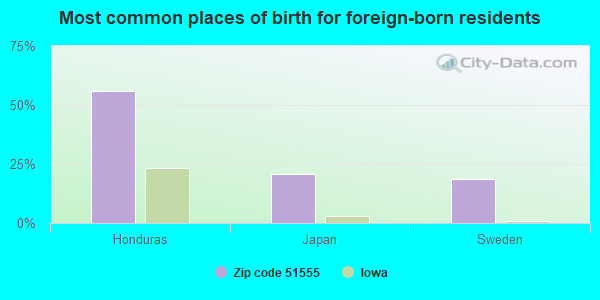
Foreign born population: 45 (0.9%) (23.9% of them are naturalized citizens)
This zip code:
0.9%
Whole state:
6.0%
56%Honduras
21%Japan
19%Sweden
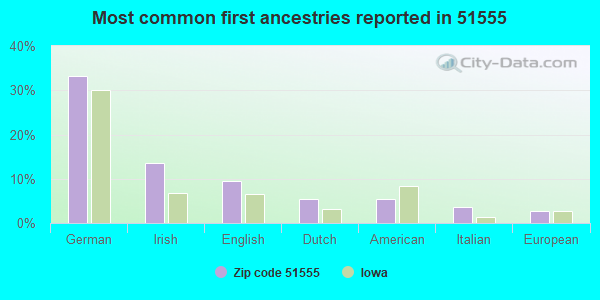
33%German
14%Irish
10%English
5%Dutch
5%American
4%Italian
3%European
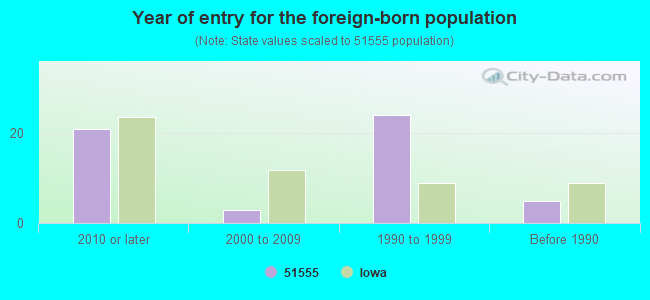
Year of entry for the foreign-born population
212010 or later
32000 to 2009
241990 to 1999
5Before 1990
Facilities with environmental interests located in this zip code:
CARRY-ON TRAILER CORP. (311 EAST 1ST AVENUE in MISSOURI VALLEY, IA)
AIR SYNTHETIC MINOR (AIRS/AFS) CRITERIA AND HAZARDOUS AIR POLLUTANT INVENTORY (Inventory of air pollution sources) (Resource Conservation and Recovery Act (tracking hazardous waste)) TRI REPORTER (Tracking of toxic chemicals releasing facilities) Business SIC classification: INDUSTRIAL TRUCKS, TRACTORS, TRAILERS, AND STACKERS; TRUCK TRAILERS Business NAICS classification: TRUCK TRAILER MANUFACTURING. Organizations: CARRY ON TRAILER CORP. (CONTACT/OWNER)
SAINT PATRICKS ELEMENTARY SCHOOL (219 NORTH 7TH STREET in MISSOURI VALLEY, IA)
(Integrated Compliance Information System) - ICIS-07-1985-0238, FORMAL ENFORCEMENT ACTION Business SIC classification: ELEMENTARY AND SECONDARY SCHOOLS Alternative names: ST PATRICKS ELEM SCHOOL, ST PATRICKS ELEMENTARY SCHOOL
ANDERSON AUTO GROUP (1951 HWY 30 in MISSOURI VALLEY, IA)
(Resource Conservation and Recovery Act (tracking hazardous waste)) Business NAICS classification: AUTOMOTIVE BODY, PAINT, AND INTERIOR REPAIR AND MAINTENANCE. Alternative names: RATIGAN MOTOR CENTER INC
AT&T MICROWAVE TOWER SITE (EAST SIDE OF G14, 1 2/3 MI EAST OF HIGHWAY 183 in MISSOURI VALLEY, IA)
(Resource Conservation and Recovery Act (tracking hazardous waste))
290TH STREET MERCURY SPILL (2370 290TH ST in MISSOURI VALLEY, IA)
SUPERFUND (Superfund database)
CARRY-ON TRAILER CORP (1851 HWY 30 in MISSOURI VALLEY, IA)
AIR SYNTHETIC MINOR (AIRS/AFS) Business SIC classification: TRUCK TRAILERS
TERRA INTERNATIONAL INCORPORATED (220 LINCOLN HIGHWAY in MISSOURI VALLEY, IA)
COMPLIANCE ACTIVITY (Tracking inspections of insecticide, fungicide, and rodenticide, and toxic substances)
VALLEY FERTILIZER (220 EAST HIGHWAY 30 in MISSOURI VALLEY, IA)
COMPLIANCE ACTIVITY (Tracking inspections of insecticide, fungicide, and rodenticide, and toxic substances)
Housing units lacking complete plumbing facilities: 0.7% Housing units lacking complete kitchen facilities: 3.9%
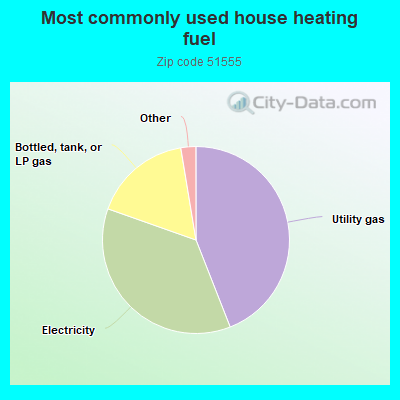
44.1%Utility gas
36.4%Electricity
17.0%Bottled, tank, or LP gas
0.7%Fuel oil, kerosene, etc.
0.7%No fuel used
0.6%Other fuel
Population in 1990: 4,330. Population change in the 1990s: +1,188 (+27.4%).
Place of birth for U.S.-born residents:
This state: 2,350
Northeast: 63
Midwest: 2,028
South: 124
West: 207
57% of the 51555 zip code residents lived in the same house 5 years ago. Out of people who lived in different houses, 63% lived in this county. Out of people who lived in different counties, 50% lived in Iowa.
89% of the 51555 zip code residents lived in the same house 1 year ago. Out of people who lived in different houses, 40% moved from this county. Out of people who lived in different houses, 28% moved from different county within same state. Out of people who lived in different houses, 33% moved from different state.
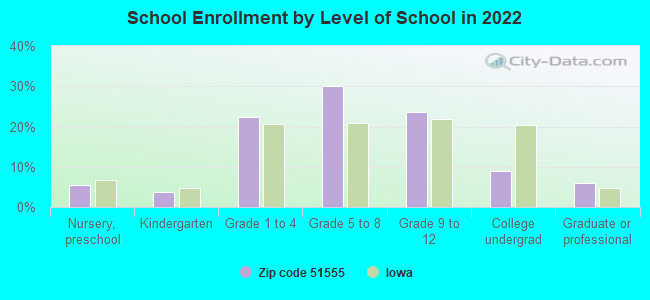
Private vs. public school enrollment:
Students in private schools in grades 1 to 8 (elementary and middle school): 59
Here:
10.4%
Iowa:
10.6%
Students in private schools in grades 9 to 12 (high school): 42
Here:
17.0%
Iowa:
7.9%
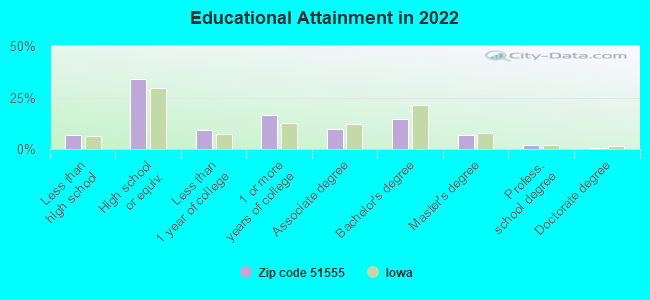
Students in private undergraduate colleges:
Here:
0.0%
Iowa:
23.9%
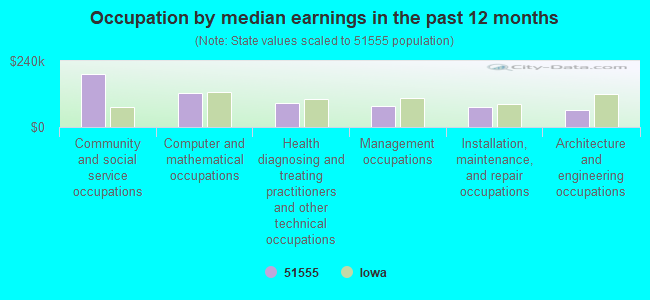
Occupation by median earnings in the past 12 months ($)
194,427Community and social service occupations
121,865Computer and mathematical occupations
88,696Health diagnosing and treating practitioners and other technical occupations
76,097Management occupations
71,979Installation, maintenance, and repair occupations
61,659Architecture and engineering occupations
Companies with federal contracts located in this zip code:
C & J FUTURES, INC (109 S 6TH ST in MISSOURI VALLE, IA; small business) : $32,130 in 7 contractsfrom 2003 to 2006
Contracts for Landscaping/Groundskeeping Services by Army Signed by year:2000: $0; 2001: $0; 2002: $0; 2003: $14,991; 2004: $15,735; 2005: $15,679; 2006: -$14,275.
Biggest contracts:
$15,679 with Army for Landscaping/Groundskeeping Services. Signed on 2005-03-04. Completion date: 2006-03-31.
$15,240, same as above.Signed on 2004-04-12. Completion date: 2005-03-31.
$14,991, same as above.Signed on 2003-03-02. Completion date: 2004-03-31.
$495, same as above.Signed on 2004-10-19. Completion date: 2005-03-31.
Top industries in this zip code by the number of employees in 2005:
Health Care and Social Assistance: General Medical and Surgical Hospitals (100-249 employees: 1 establishment)
Health Care and Social Assistance: Nursing Care Facilities (100-249: 1)
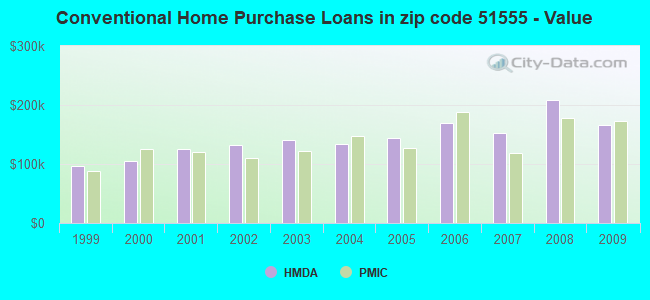
Detailed PMIC statistics for the following Tracts:0214.00
2003 - 2018 National Fire Incident Reporting System (NFIRS) incidents
Based on the data from the years 2003 - 2018 the average number of fire incidents per year is 26. The highest number of fires - 63 took place in 2011, and the least - 1 in 2005. The data has an increasing trend.
When looking into fire subcategories, the most incidents belonged to: Outside Fires (46.5%), and Structure Fires (31.8%).
Fire incident types reported to NFIRS in Zip Code 51555


+$227
-$74
(% of AGI for various income ranges: 1.3% for AGIs $10k-25k, -0.1% for AGIs $25k-50k, -0.3% for AGIs $50k-75k, -0.7% for AGIs $75k-100k, 0.7% for AGIs over 100k)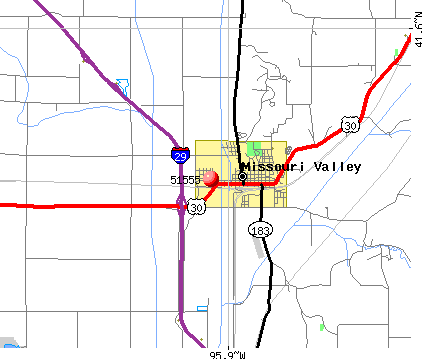 Nearest zip codes: 51556, 51550, 68023, 51542, 51546, 51557.
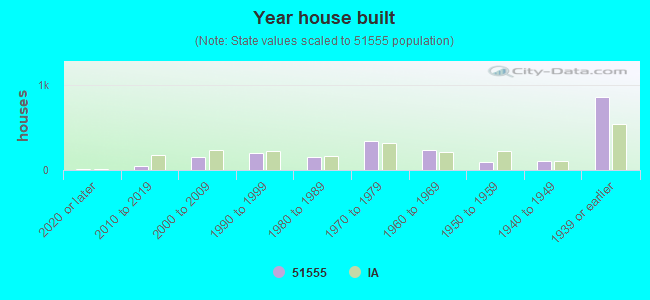


 Based on the data from the years 2003 - 2018 the average number of fire incidents per year is 26. The highest number of fires - 63 took place in 2011, and the least - 1 in 2005. The data has an increasing trend.
 When looking into fire subcategories, the most incidents belonged to: Outside Fires (46.5%), and Structure Fires (31.8%).