Estimated zip code population in 2022: 911 Zip code population in 2010: 1,158 Zip code population in 2000: 1,076
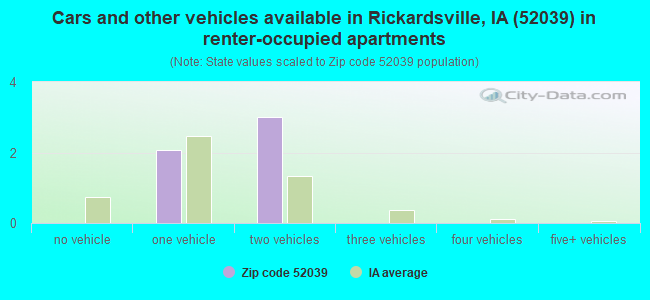
Houses and condos: 381 Renter-occupied apartments: 5
% of renters here:
1%
State:
28%
March 2022 cost of living index in zip code 52039: 80.3 (low, U.S. average is 100)
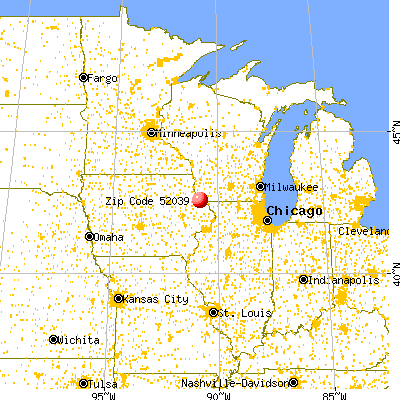
Land area: 35.2 sq. mi. Water area: 0.0 sq. mi.
Population density: 26 people per square mile
(very low).
OSM Map
General Map
Google Map
MSN Map
OSM Map
General Map
Google Map
MSN Map
OSM Map
General Map
Google Map
MSN Map
OSM Map
General Map
Google Map
MSN Map
Please wait while loading the map...
Real estate property taxes paid for housing units in 2022:
This zip code:
1.3% ($3,295)
Iowa:
1.4% ($2,724)
Median real estate property taxes paid for housing units with mortgages in 2022: $3,196 (1.2%) Median real estate property taxes paid for housing units with no mortgage in 2022: $3,392 (1.5%)
Business Search- 14 Million verified businesses
Males: 422
(46.4%)
Females: 488
(53.6%)
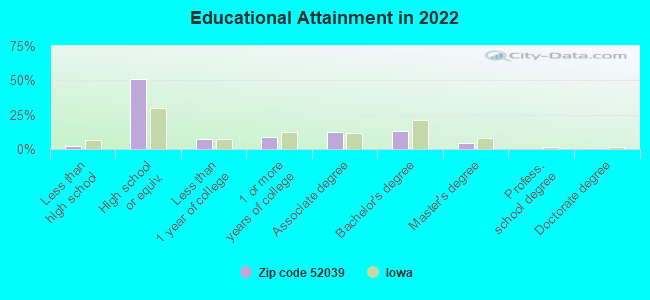
For population 25 years and over in 52039:
High school or higher: 95.9%
Bachelor's degree or higher: 17.6%
Graduate or professional degree: 4.5%
Unemployed: 2.2%
Mean travel time to work (commute): 18.0 minutes
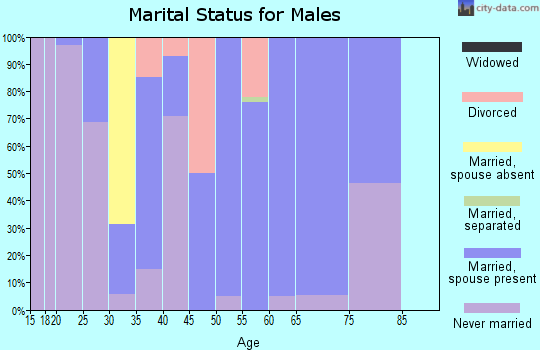
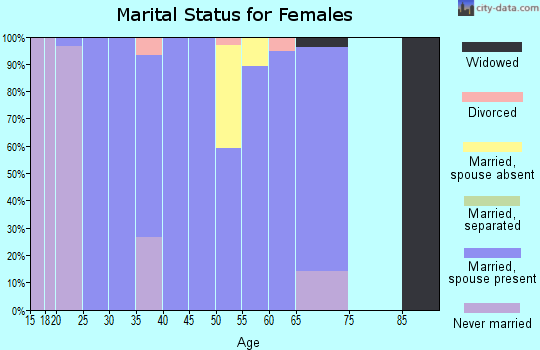
For population 15 years and over in 52039:
Never married: 24.2%
Now married: 67.7%
Separated: 0.1%
Widowed: 3.9%
Divorced: 4.1%
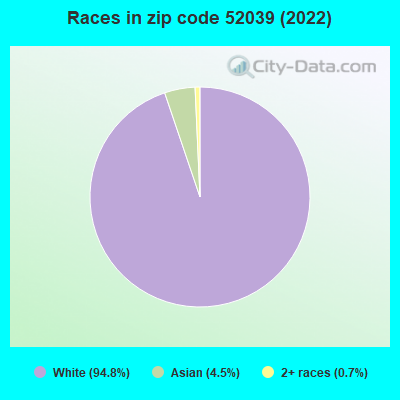
Zip code 52039 compared to state average:
Black race population percentage significantly below state average.
Hispanic race population percentage significantly below state average.
Median age significantly above state average.
Renting percentage significantly below state average.
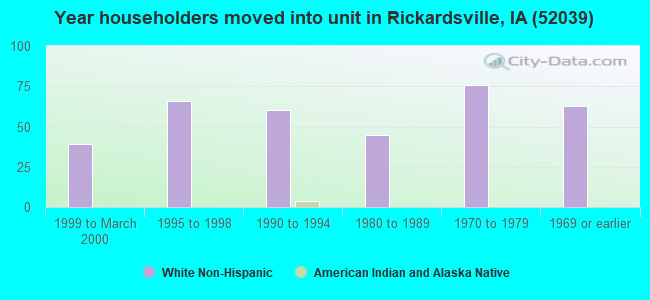
Length of stay since moving in significantly above state average.
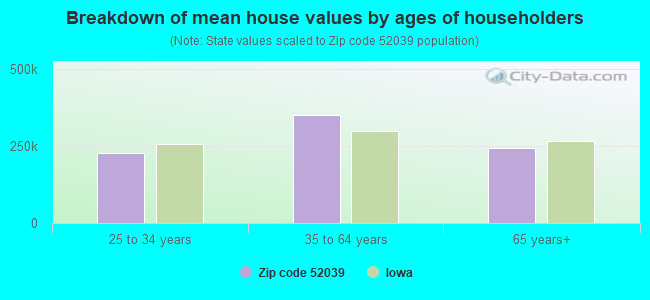
Estimated median house/condo value in 2022: $252,358
52039:
$252,358
Iowa:
$194,600
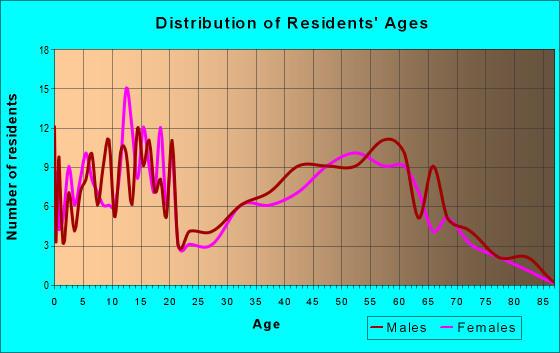
Median resident age:
This zip code:
56.9 years
Iowa median age:
38.9 years
Average household size:
This zip code:
2.7 people
Iowa:
2.3 people
Averages for the 2020 tax year for zip code 52039, filed in 2021:
Average Adjusted Gross Income (AGI) in 2020: $73,012 (Individual Income Tax Returns)
Here:
$73,012
State:
$71,087
Salary/wage: $58,954 (reported on 85.7% of returns)
Here:
$58,954
State:
$57,361
(% of AGI for various income ranges: 1435.7% for AGIs below $25k, 3550.9% for AGIs $25k-50k, 7604.0% for AGIs $50k-75k, 12377.5% for AGIs $75k-100k, 15868.6% for AGIs $100k-200k)
Taxable interest for individuals: $1,282 (reported on 60.7% of returns)
This zip code:
$1,282
Iowa:
$1,633
(% of AGI for various income ranges: 112.9% for AGIs below $25k, 40.9% for AGIs $25k-50k, 72.0% for AGIs $50k-75k, 142.5% for AGIs $75k-100k, 312.9% for AGIs $100k-200k)
Ordinary dividends: $3,807 (reported on 26.8% of returns)
Here:
$3,807
State:
$5,432
(% of AGI for various income ranges: 62.9% for AGIs below $25k, 68.2% for AGIs $25k-50k, 135.0% for AGIs $75k-100k, 568.6% for AGIs $100k-200k)
Net capital gain/loss in AGI: +$11,653 (reported on 26.8% of returns)
Here:
+$11,653
State:
+$15,243
(% of AGI for various income ranges: 62.9% for AGIs below $25k, 143.6% for AGIs $25k-50k, 626.0% for AGIs $50k-75k, 240.0% for AGIs $75k-100k, 1624.3% for AGIs $100k-200k)
Profit/loss from business: +$3,886 (reported on 12.5% of returns)
Here:
+$3,886
State:
+$11,763
(% of AGI for various income ranges: 210.9% for AGIs $25k-50k, 100.0% for AGIs $75k-100k)
Taxable individual retirement arrangement distribution: $13,400 (reported on 12.5% of returns)
52039:
$13,400
Iowa:
$17,324
(% of AGI for various income ranges: 243.6% for AGIs $25k-50k, 446.0% for AGIs $50k-75k, 638.6% for AGIs $100k-200k)
Total itemized deductions: $27,067 (reported on 5.4% of returns)
Here:
$27,067
State:
$33,775
(% of AGI for various income ranges: 2030.0% for AGIs $75k-100k)
Charity contributions: $10,000 (reported on 3.6% of returns)
Here:
$10,000
State:
$13,075
(% of AGI for various income ranges: 400.0% for AGIs $50k-75k)
Taxes paid: $8,233 (reported on 5.4% of returns)
52039:
$8,233
State:
$7,704
(% of AGI for various income ranges: 617.5% for AGIs $75k-100k)
Earned income credit: $1,533 (reported on 5.4% of returns)
Here:
$1,533
State:
$2,195
(% of AGI for various income ranges: 41.8% for AGIs $25k-50k)
Percentage of individuals using paid preparers for their 2020 taxes: 96.4%
Here:
96%
State:
95%
(% for various income ranges: 100.0% for AGIs below $25k, 100.0% for AGIs $25k-50k, 87.5% for AGIs $50k-75k, 100.0% for AGIs $75k-100k, 91.7% for AGIs $100k-200k, 100.0% for AGIs over 200k)
Averages for the 2012 tax year for zip code 52039, filed in 2013:
Average Adjusted Gross Income (AGI) in 2012: $58,709 (Individual Income Tax Returns)
Here:
$58,709
State:
$58,860
Salary/wage: $47,429 (reported on 84.2% of returns)
Here:
$47,429
State:
$46,659
(% of AGI for various income ranges: 64.5% for AGIs below $25k, 73.4% for AGIs $25k-50k, 76.8% for AGIs $50k-75k, 75.3% for AGIs $75k-100k, 60.5% for AGIs $100k-200k)
Taxable interest for individuals: $1,327 (reported on 57.9% of returns)
This zip code:
$1,327
Iowa:
$1,537
(% of AGI for various income ranges: 6.3% for AGIs below $25k, 1.4% for AGIs $25k-50k, 0.9% for AGIs $50k-75k, 0.8% for AGIs $75k-100k, 0.9% for AGIs $100k-200k)
Ordinary dividends: $2,412 (reported on 28.1% of returns)
Here:
$2,412
State:
$4,542
(% of AGI for various income ranges: 3.5% for AGIs below $25k, 1.6% for AGIs $25k-50k, 0.5% for AGIs $50k-75k, 1.0% for AGIs $75k-100k, 1.0% for AGIs $100k-200k)
Net capital gain/loss in AGI: +$7,857 (reported on 24.6% of returns)
Here:
+$7,857
State:
+$11,802
(% of AGI for various income ranges: 1.6% for AGIs below $25k, 4.3% for AGIs $25k-50k, 2.2% for AGIs $50k-75k, 5.0% for AGIs $100k-200k)
Profit/loss from business: +$6,614 (reported on 12.3% of returns)
Here:
+$6,614
State:
+$10,509
Taxable individual retirement arrangement distribution: $11,800 (reported on 10.5% of returns)
52039:
$11,800
Iowa:
$11,773
Total itemized deductions: $21,200 (19% of AGI, reported on 29.8% of returns)
Here:
$21,200
State:
$21,278
Here:
19.2% of AGI
State:
18.9% of AGI
(% of AGI for various income ranges: 17.2% for AGIs $25k-50k, 10.5% for AGIs $50k-75k, 8.4% for AGIs $75k-100k, 11.7% for AGIs $100k-200k)
Charity contributions: $3,536 (reported on 24.6% of returns)
Here:
$3,536
State:
$4,044
(% of AGI for various income ranges: 0.4% for AGIs $25k-50k, 0.6% for AGIs $50k-75k, 0.8% for AGIs $75k-100k, 2.7% for AGIs $100k-200k)
Taxes paid: $9,371 (reported on 29.8% of returns)
52039:
$9,371
State:
$8,846
(% of AGI for various income ranges: 3.0% for AGIs $25k-50k, 3.3% for AGIs $50k-75k, 3.5% for AGIs $75k-100k, 7.1% for AGIs $100k-200k)
Earned income credit: $1,860 (reported on 8.8% of returns)
Here:
$1,860
State:
$2,098
(% of AGI for various income ranges: 2.8% for AGIs below $25k, 0.7% for AGIs $25k-50k)
Percentage of individuals using paid preparers for their 2012 taxes: 77.2%
Here:
77%
State:
65%
(% for various income ranges: 65.0% for AGIs below $25k, 83.3% for AGIs $25k-50k, 80.0% for AGIs $50k-75k, 85.7% for AGIs $75k-100k, 87.5% for AGIs $100k-200k)
Averages for the 2004 tax year for zip code 52039, filed in 2005:
Average Adjusted Gross Income (AGI) in 2004: $55,400 (Individual Income Tax Returns)
Here:
$55,400
State:
$43,875
Salary/wage: $45,388 (reported on 88.9% of returns)
Here:
$45,388
State:
$38,265
(% of AGI for various income ranges: 77.9% for AGIs $10k-25k, 73.8% for AGIs $25k-50k, 85.5% for AGIs $50k-75k, 84.3% for AGIs $75k-100k, 52.2% for AGIs over 100k)
Taxable interest for individuals: $1,428 (reported on 77.3% of returns)
This zip code:
$1,428
Iowa:
$1,768
(% of AGI for various income ranges: 7.0% for AGIs $10k-25k, 3.5% for AGIs $25k-50k, 0.5% for AGIs $50k-75k, 0.9% for AGIs $75k-100k, 1.4% for AGIs over 100k)
Taxable dividends: $1,379 (reported on 28.7% of returns)
Here:
$1,379
State:
$2,510
(% of AGI for various income ranges: 1.0% for AGIs $10k-25k, 0.4% for AGIs $25k-50k, 0.2% for AGIs $50k-75k, 0.9% for AGIs $75k-100k, 1.2% for AGIs over 100k)
Net capital gain/loss: +$4,704 (reported on 28.9% of returns)
Here:
+$4,704
State:
+$6,139
(% of AGI for various income ranges: 0.7% for AGIs $10k-25k, 2.4% for AGIs $25k-50k, 1.5% for AGIs $50k-75k, 1.7% for AGIs $75k-100k, 4.4% for AGIs over 100k)
Profit/loss from business: +$6,132 (reported on 17.6% of returns)
Here:
+$6,132
State:
+$8,574
(% of AGI for various income ranges: 7.2% for AGIs $10k-25k, 2.2% for AGIs $25k-50k, 1.1% for AGIs $50k-75k, 2.1% for AGIs over 100k)
Profit/loss from farming: +$776 (reported on 15.5% of returns)
Here:
+$776
State:
-$74
(% of AGI for various income ranges: -1.4% for AGIs $10k-25k, 1.3% for AGIs $25k-50k, 1.1% for AGIs $50k-75k, -1.1% for AGIs $75k-100k)
IRA payment deduction: $2,600 (reported on 3.5% of returns)
52039:
$2,600
Iowa:
$2,970
Total itemized deductions: $18,797 (22% of AGI, reported on 35.4% of returns)
Here:
$18,797
State:
$16,976
Here:
21.7% of AGI
State:
20.8% of AGI
(% of AGI for various income ranges: 12.9% for AGIs $10k-25k, 8.5% for AGIs $25k-50k, 10.3% for AGIs $50k-75k, 13.4% for AGIs $75k-100k, 14.8% for AGIs over 100k)
Charity contributions deductions: $2,423 (3% of AGI, reported on 30.1% of returns)
Here:
$2,423
State:
$3,089
Here:
2.6% of AGI
State:
3.6% of AGI
(% of AGI for various income ranges: 0.9% for AGIs $25k-50k, 0.9% for AGIs $50k-75k, 1.4% for AGIs $75k-100k, 2.3% for AGIs over 100k)
Total tax: $5,461 (reported on 88.0% of returns)
52039:
$5,461
State:
$6,177
(% of AGI for various income ranges: 5.5% for AGIs $10k-25k, 6.1% for AGIs $25k-50k, 7.6% for AGIs $50k-75k, 9.6% for AGIs $75k-100k, 11.8% for AGIs over 100k)
Earned income credit: $1,886 (reported on 8.1% of returns)
Here:
$1,886
State:
$1,540
Percentage of individuals using paid preparers for their 2004 taxes: 79.6%
Here:
80%
State:
70%
(% for various income ranges: 74.4% for AGIs $10k-25k, 77.2% for AGIs $25k-50k, 86.3% for AGIs $50k-75k, 80.4% for AGIs $75k-100k, 86.8% for AGIs over 100k)
Household received Food Stamps/SNAP in the past 12 months: 18 Household did not receive Food Stamps/SNAP in the past 12 months: 324
Women who had a birth in the past 12 months: 2 (0 now married, 1 unmarried) Women who did not have a birth in the past 12 months: 162 (60 now married, 101 unmarried)
Housing units in zip code 52039 with a mortgage: 226 (89 second mortgage, 7 home equity loan, 84 both second mortgage and home equity loan) Houses without a mortgage: 13
Median monthly owner costs for units with a mortgage: $1,682 Median monthly owner costs for units without a mortgage: $604
Residents with income below the poverty level in 2022:
This zip code:
3.9%
Whole state:
11.0%
Residents with income below 50% of the poverty level in 2022:
This zip code:
1.9%
Whole state:
5.5%
Median number of rooms in houses and condos:
Here:
7.0
State:
6.8
Median number of rooms in apartments:
Here:
4.3
State:
4.2
Notable locations in this zip code not listed on our city pages
Cemeteries: Annunciation Cemetery (1), Cottage Hill Christian Cemetery (2), Christian Cemetery (3), Richardsville Methodist Cemetery (4), Congregational Rock Cemetery (5), Durango Cemetery (6). Display/hide their locations on the map
Size of family households: 127 2-persons, 17 3-persons, 82 4-persons, 20 5-persons, 2 6-persons
Size of nonfamily households: 63 1-person, 24 2-persons
127 married couples with children.
2 single-parent households (2 men).
99.8% of residents of 52039 zip code speak English at home.
0.1% of residents speak Spanish at home (100% very well).
0.1% of residents speak other language at home (100% very well).
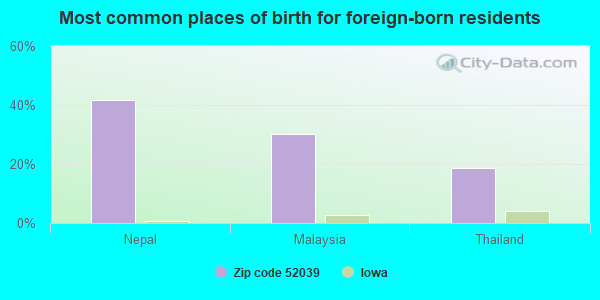
Foreign born population: 46 (5.1%) (79.6% of them are naturalized citizens)
This zip code:
5.1%
Whole state:
6.0%
42%Nepal
30%Malaysia
19%Thailand
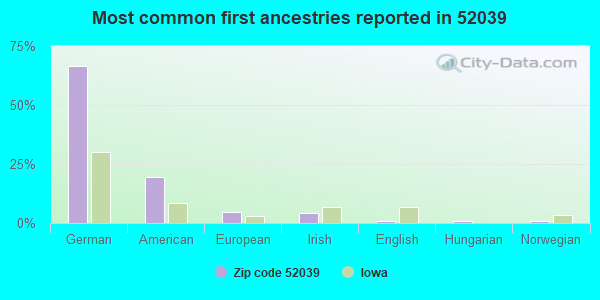
67%German
19%American
5%European
4%Irish
1%English
1%Hungarian
1%Norwegian
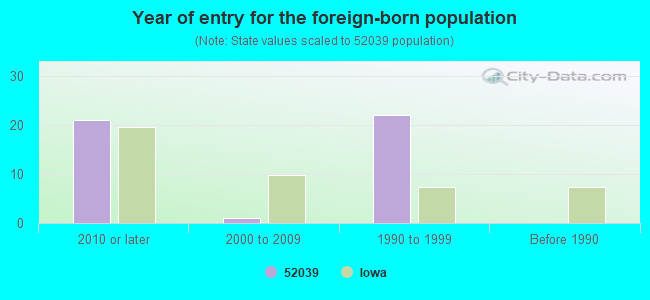
Year of entry for the foreign-born population
212010 or later
12000 to 2009
221990 to 1999
0Before 1990
Facilities with environmental interests located in this zip code:
AVALON BODY SHOP INC (20680 HIGHWAY 52 NORTH in DURANGO, IA)
AIR MINOR (AIRS/AFS) Conditionally Exempt Small Quantity Generators, less than 100 kg/month of hazardous waste (Resource Conservation and Recovery Act (tracking hazardous waste)) Business SIC classification: TOP, BODY, AND UPHOLSTERY REPAIR SHOPS AND PAINT SHOPS Business NAICS classification: AUTOMOTIVE BODY, PAINT, AND INTERIOR REPAIR AND MAINTENANCE. Alternative names: AVALON BODY SHOP (RICKARDSVILLE)
RICKARDSVILLE CITY OF STP (1/2 MILE N OF HWY 52 ON KLEIN in DURANGO, IA)
National Pollutant Discharge Elimination System NON-MAJOR (Tracking pollutant discharge elimination systems) - permit Business SIC classification: SEWERAGE SYSTEMS Organizations: CITY OF RICKARDSVILLE (CONTACT/OWNER)
BARTEL'S & COMPANY (18222 GARY RIDGE DR in DURANGO, IA)
Conditionally Exempt Small Quantity Generators, less than 100 kg/month of hazardous waste (Resource Conservation and Recovery Act (tracking hazardous waste))
Housing units lacking complete plumbing facilities: 0.4%
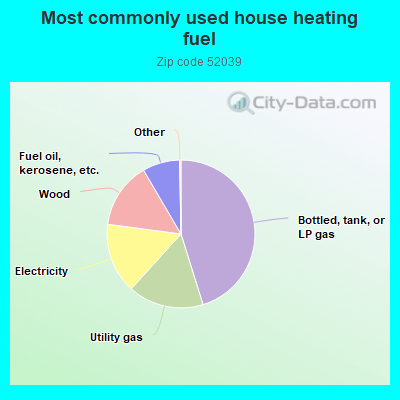
45.6%Bottled, tank, or LP gas
16.7%Utility gas
15.5%Electricity
14.6%Wood
8.2%Fuel oil, kerosene, etc.
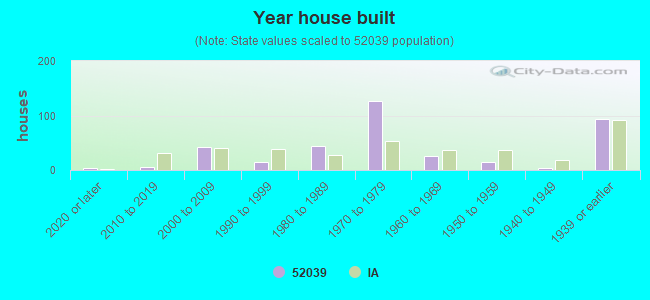
Population in 1990: 874. Population change in the 1990s: +202 (+23.1%).
Place of birth for U.S.-born residents:
This state: 805
Midwest: 52
South: 7
West: 2
79% of the 52039 zip code residents lived in the same house 5 years ago. Out of people who lived in different houses, 69% lived in this county. Out of people who lived in different counties, 50% lived in Iowa.
99% of the 52039 zip code residents lived in the same house 1 year ago. Out of people who lived in different houses, 125% moved from this county. Out of people who lived in different houses, 25% moved from different state.
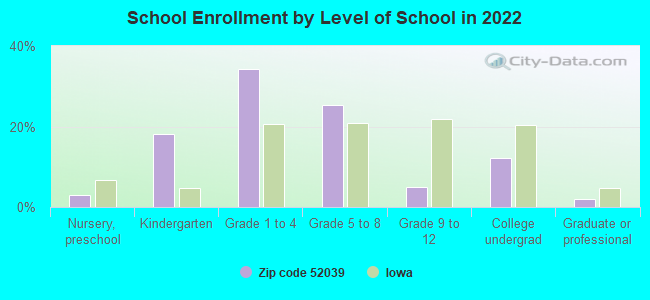
Private vs. public school enrollment:
Students in private schools in grades 1 to 8 (elementary and middle school): 18
Here:
30.5%
Iowa:
10.6%
Students in private schools in grades 9 to 12 (high school):
Here:
19.4%
Iowa:
7.9%
Students in private undergraduate colleges:
Here:
7.8%
Iowa:
23.9%
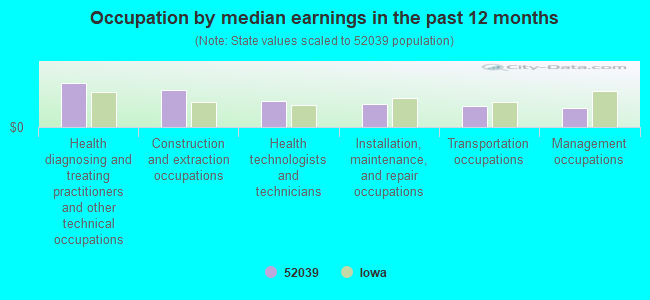
Occupation by median earnings in the past 12 months ($)
105,637Health diagnosing and treating practitioners and other technical occupations
89,428Construction and extraction occupations
63,477Health technologists and technicians
55,668Installation, maintenance, and repair occupations
49,447Transportation occupations
46,689Management occupations
Top industries in this zip code by the number of employees in 2005:
Accommodation and Food Services: Bed-and-Breakfast Inns (5-9 employees: 1 establishment)
Accommodation and Food Services: Full-Service Restaurants (5-9: 1)
Other Services (except Public Administration): Automotive Body, Paint, and Interior Repair and Maintenance (5-9: 1)
Construction: All Other Specialty Trade Contractors (1-4: 2)
Construction: Masonry Contractors (1-4: 1)
Accommodation and Food Services: Caterers (1-4: 1)
Wholesale Trade: Industrial Machinery and Equipment Merchant Wholesalers (1-4: 1)
Fatal accident statistics in 2010:
Fatal accident count: 1
Vehicles involved in fatal accidents: 1
Fatal accidents caused by drunken drivers: 0
Fatalities: 1
Persons involved in fatal accidents: 1
Pedestrians involved in fatal accidents: 0
Home Mortgage Disclosure Act Aggregated Statistics For Year 2009 (Based on 4 partial tracts)
A) FHA, FSA/RHS & VA Home Purchase Loans
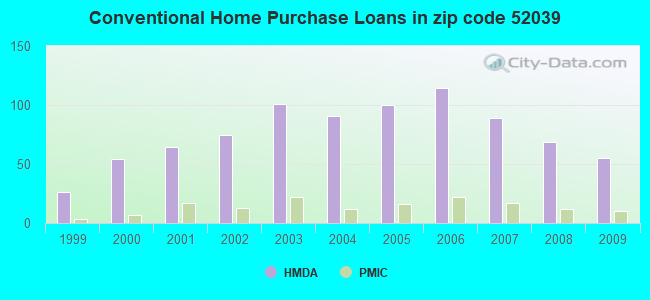
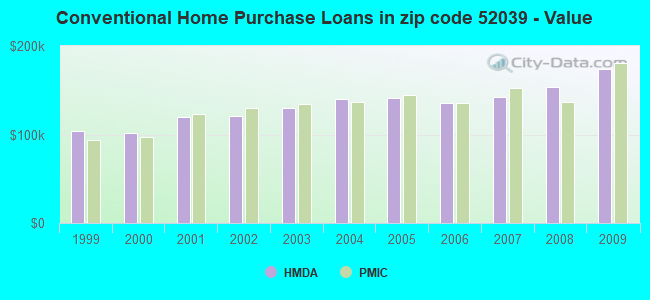
B) Conventional Home Purchase Loans
C) Refinancings
D) Home Improvement Loans
F) Non-occupant Loans on < 5 Family Dwellings (A B C & D)
G) Loans On Manufactured Home Dwelling (A B C & D)
Number
Average Value
Number
Average Value
Number
Average Value
Number
Average Value
Number
Average Value
Number
Average Value
LOANS ORIGINATED
18
$159,131
55
$174,457
328
$155,847
11
$55,892
7
$141,540
0
$0
APPLICATIONS APPROVED, NOT ACCEPTED
0
$0
1
$191,010
6
$141,547
0
$0
0
$0
0
$0
APPLICATIONS DENIED
5
$159,300
2
$151,010
23
$160,994
1
$19,050
0
$0
1
$33,670
APPLICATIONS WITHDRAWN
0
$0
3
$220,557
30
$136,129
1
$92,750
0
$0
0
$0
FILES CLOSED FOR INCOMPLETENESS
0
$0
0
$0
0
$0
0
$0
0
$0
0
$0
Aggregated Statistics For Year 2008 (Based on 4 partial tracts)
A) FHA, FSA/RHS & VA Home Purchase Loans
B) Conventional Home Purchase Loans
C) Refinancings
D) Home Improvement Loans
E) Loans on Dwellings For 5+ Families
F) Non-occupant Loans on < 5 Family Dwellings (A B C & D)
G) Loans On Manufactured Home Dwelling (A B C & D)
Number
Average Value
Number
Average Value
Number
Average Value
Number
Average Value
Number
Average Value
Number
Average Value
Number
Average Value
LOANS ORIGINATED
11
$135,719
69
$153,766
132
$160,735
7
$34,883
1
$261,530
9
$197,533
2
$41,150
APPLICATIONS APPROVED, NOT ACCEPTED
0
$0
3
$105,427
4
$143,010
0
$0
0
$0
0
$0
0
$0
APPLICATIONS DENIED
0
$0
5
$92,004
26
$142,096
3
$93,977
0
$0
1
$41,150
2
$17,485
APPLICATIONS WITHDRAWN
1
$207,960
4
$164,138
15
$172,709
1
$88,130
0
$0
0
$0
0
$0
FILES CLOSED FOR INCOMPLETENESS
0
$0
0
$0
3
$175,507
0
$0
0
$0
0
$0
0
$0
Aggregated Statistics For Year 2007 (Based on 4 partial tracts)
A) FHA, FSA/RHS & VA Home Purchase Loans
B) Conventional Home Purchase Loans
C) Refinancings
D) Home Improvement Loans
F) Non-occupant Loans on < 5 Family Dwellings (A B C & D)
G) Loans On Manufactured Home Dwelling (A B C & D)
Number
Average Value
Number
Average Value
Number
Average Value
Number
Average Value
Number
Average Value
Number
Average Value
LOANS ORIGINATED
2
$193,335
89
$142,529
92
$145,591
10
$48,499
8
$131,129
3
$33,750
APPLICATIONS APPROVED, NOT ACCEPTED
0
$0
5
$173,506
10
$138,766
1
$24,240
0
$0
0
$0
APPLICATIONS DENIED
0
$0
5
$76,676
21
$129,986
5
$37,512
1
$191,230
2
$33,125
APPLICATIONS WITHDRAWN
0
$0
5
$108,348
11
$164,012
1
$105,260
0
$0
0
$0
FILES CLOSED FOR INCOMPLETENESS
0
$0
0
$0
4
$121,972
0
$0
0
$0
0
$0
Aggregated Statistics For Year 2006 (Based on 4 partial tracts)
A) FHA, FSA/RHS & VA Home Purchase Loans
B) Conventional Home Purchase Loans
C) Refinancings
D) Home Improvement Loans
E) Loans on Dwellings For 5+ Families
F) Non-occupant Loans on < 5 Family Dwellings (A B C & D)
G) Loans On Manufactured Home Dwelling (A B C & D)
Number
Average Value
Number
Average Value
Number
Average Value
Number
Average Value
Number
Average Value
Number
Average Value
Number
Average Value
LOANS ORIGINATED
4
$138,358
114
$135,636
78
$122,263
15
$40,235
1
$8,190,810
10
$134,824
2
$6,555
APPLICATIONS APPROVED, NOT ACCEPTED
0
$0
5
$173,444
6
$126,302
2
$38,830
0
$0
0
$0
0
$0
APPLICATIONS DENIED
0
$0
4
$60,920
28
$147,233
3
$57,990
0
$0
0
$0
1
$9,640
APPLICATIONS WITHDRAWN
0
$0
4
$127,728
18
$141,224
0
$0
0
$0
1
$38,590
0
$0
FILES CLOSED FOR INCOMPLETENESS
0
$0
2
$148,950
7
$153,899
0
$0
0
$0
1
$143,060
0
$0
Aggregated Statistics For Year 2005 (Based on 4 partial tracts)
A) FHA, FSA/RHS & VA Home Purchase Loans
B) Conventional Home Purchase Loans
C) Refinancings
D) Home Improvement Loans
F) Non-occupant Loans on < 5 Family Dwellings (A B C & D)
G) Loans On Manufactured Home Dwelling (A B C & D)
Number
Average Value
Number
Average Value
Number
Average Value
Number
Average Value
Number
Average Value
Number
Average Value
LOANS ORIGINATED
5
$100,178
100
$140,753
80
$127,811
4
$46,152
5
$108,302
2
$37,195
APPLICATIONS APPROVED, NOT ACCEPTED
0
$0
5
$113,382
8
$82,862
1
$25,840
1
$69,550
0
$0
APPLICATIONS DENIED
0
$0
10
$104,362
30
$130,093
4
$70,402
0
$0
3
$28,260
APPLICATIONS WITHDRAWN
1
$182,800
3
$187,237
21
$129,184
1
$20,190
0
$0
0
$0
FILES CLOSED FOR INCOMPLETENESS
0
$0
0
$0
5
$191,638
1
$44,110
0
$0
0
$0
Aggregated Statistics For Year 2004 (Based on 4 partial tracts)
A) FHA, FSA/RHS & VA Home Purchase Loans
B) Conventional Home Purchase Loans
C) Refinancings
D) Home Improvement Loans
F) Non-occupant Loans on < 5 Family Dwellings (A B C & D)
G) Loans On Manufactured Home Dwelling (A B C & D)
Number
Average Value
Number
Average Value
Number
Average Value
Number
Average Value
Number
Average Value
Number
Average Value
LOANS ORIGINATED
1
$200,290
91
$139,997
123
$120,456
12
$38,954
9
$151,461
2
$31,045
APPLICATIONS APPROVED, NOT ACCEPTED
0
$0
4
$118,220
10
$101,727
2
$34,010
0
$0
1
$44,910
APPLICATIONS DENIED
1
$89,420
7
$51,733
32
$102,739
4
$60,952
0
$0
6
$33,912
APPLICATIONS WITHDRAWN
1
$80,350
2
$87,375
14
$119,632
1
$48,210
0
$0
0
$0
FILES CLOSED FOR INCOMPLETENESS
0
$0
1
$120,010
6
$132,235
1
$45,700
0
$0
0
$0
Aggregated Statistics For Year 2003 (Based on 4 partial tracts)
A) FHA, FSA/RHS & VA Home Purchase Loans
B) Conventional Home Purchase Loans
C) Refinancings
D) Home Improvement Loans
F) Non-occupant Loans on < 5 Family Dwellings (A B C & D)
Number
Average Value
Number
Average Value
Number
Average Value
Number
Average Value
Number
Average Value
LOANS ORIGINATED
3
$85,490
101
$130,090
357
$117,776
10
$50,569
6
$71,815
APPLICATIONS APPROVED, NOT ACCEPTED
0
$0
4
$105,012
9
$92,312
1
$14,980
0
$0
APPLICATIONS DENIED
0
$0
4
$58,460
31
$102,392
2
$28,610
0
$0
APPLICATIONS WITHDRAWN
0
$0
4
$92,872
21
$106,141
0
$0
0
$0
FILES CLOSED FOR INCOMPLETENESS
0
$0
0
$0
4
$89,928
0
$0
0
$0
Aggregated Statistics For Year 2002 (Based on 4 partial tracts)
A) FHA, FSA/RHS & VA Home Purchase Loans
B) Conventional Home Purchase Loans
C) Refinancings
D) Home Improvement Loans
F) Non-occupant Loans on < 5 Family Dwellings (A B C & D)
Number
Average Value
Number
Average Value
Number
Average Value
Number
Average Value
Number
Average Value
LOANS ORIGINATED
3
$110,433
75
$121,037
210
$116,288
9
$46,900
5
$66,356
APPLICATIONS APPROVED, NOT ACCEPTED
0
$0
6
$117,607
6
$114,705
0
$0
0
$0
APPLICATIONS DENIED
0
$0
7
$66,363
21
$113,045
2
$29,410
2
$31,585
APPLICATIONS WITHDRAWN
0
$0
5
$113,456
14
$106,369
2
$26,825
0
$0
FILES CLOSED FOR INCOMPLETENESS
0
$0
0
$0
2
$159,145
0
$0
0
$0
Aggregated Statistics For Year 2001 (Based on 4 partial tracts)
A) FHA, FSA/RHS & VA Home Purchase Loans
B) Conventional Home Purchase Loans
C) Refinancings
D) Home Improvement Loans
F) Non-occupant Loans on < 5 Family Dwellings (A B C & D)
Number
Average Value
Number
Average Value
Number
Average Value
Number
Average Value
Number
Average Value
LOANS ORIGINATED
5
$99,192
64
$119,605
158
$108,230
6
$18,408
1
$71,920
APPLICATIONS APPROVED, NOT ACCEPTED
0
$0
1
$106,530
6
$91,483
0
$0
0
$0
APPLICATIONS DENIED
0
$0
6
$51,247
17
$88,742
1
$12,750
0
$0
APPLICATIONS WITHDRAWN
0
$0
3
$127,750
10
$80,244
1
$37,010
0
$0
FILES CLOSED FOR INCOMPLETENESS
0
$0
1
$61,600
1
$56,080
0
$0
0
$0
Aggregated Statistics For Year 2000 (Based on 4 partial tracts)
A) FHA, FSA/RHS & VA Home Purchase Loans
B) Conventional Home Purchase Loans
C) Refinancings
D) Home Improvement Loans
F) Non-occupant Loans on < 5 Family Dwellings (A B C & D)
Number
Average Value
Number
Average Value
Number
Average Value
Number
Average Value
Number
Average Value
LOANS ORIGINATED
3
$138,020
54
$101,360
29
$86,771
5
$11,842
2
$74,960
APPLICATIONS APPROVED, NOT ACCEPTED
0
$0
2
$106,885
4
$68,025
1
$68,350
0
$0
APPLICATIONS DENIED
0
$0
5
$65,710
11
$80,062
4
$14,535
0
$0
APPLICATIONS WITHDRAWN
0
$0
4
$96,768
12
$84,254
0
$0
0
$0
FILES CLOSED FOR INCOMPLETENESS
0
$0
1
$52,740
1
$45,300
0
$0
0
$0
Aggregated Statistics For Year 1999 (Based on 2 partial tracts)
A) FHA, FSA/RHS & VA Home Purchase Loans
B) Conventional Home Purchase Loans
C) Refinancings
D) Home Improvement Loans
F) Non-occupant Loans on < 5 Family Dwellings (A B C & D)


+$776
-$74
(% of AGI for various income ranges: -1.4% for AGIs $10k-25k, 1.3% for AGIs $25k-50k, 1.1% for AGIs $50k-75k, -1.1% for AGIs $75k-100k)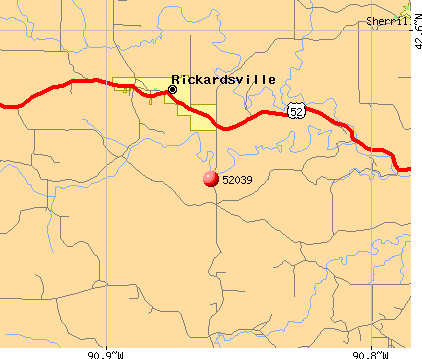 Nearest zip codes: 52002, 52073, 52045, 52053, 52068, 52001.