Estimated zip code population in 2022: 43,052 Zip code population in 2010: 43,173 Zip code population in 2000: 44,033
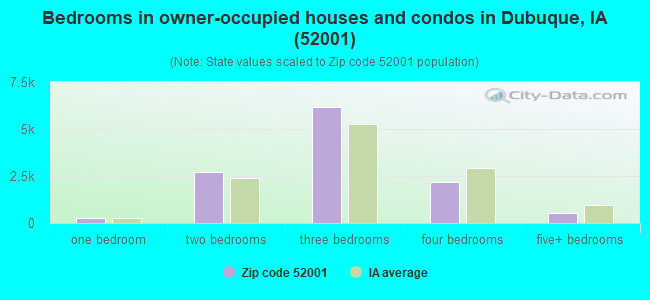
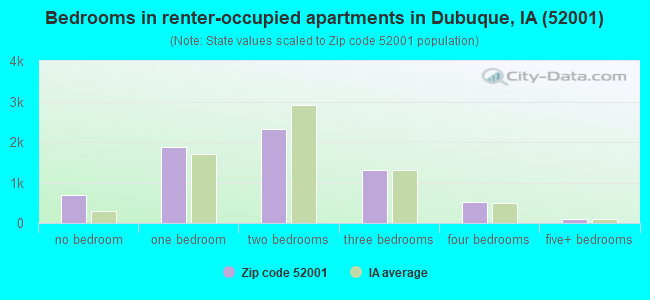
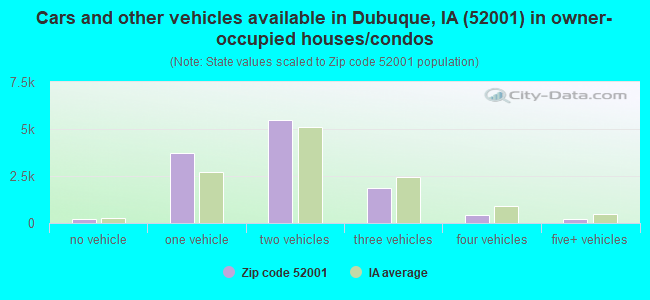
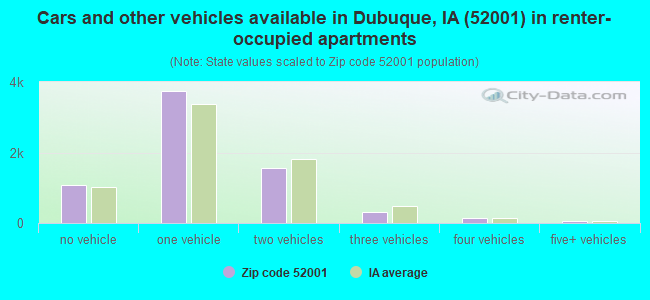
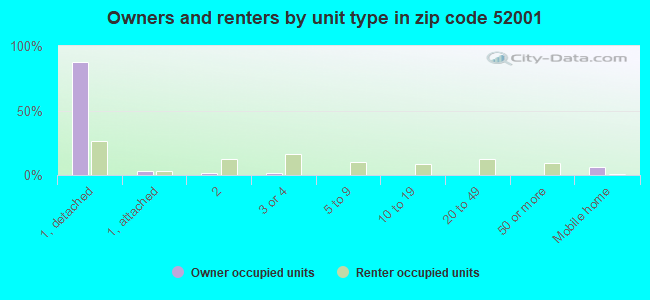
Houses and condos: 20,113 Renter-occupied apartments: 6,868
% of renters here:
37%
State:
28%
March 2022 cost of living index in zip code 52001: 84.4 (less than average, U.S. average is 100)
Land area: 26.1 sq. mi. Water area: 2.8 sq. mi.
Population density: 1,647 people per square mile
(low).
OSM Map
General Map
Google Map
MSN Map
OSM Map
General Map
Google Map
MSN Map
OSM Map
General Map
Google Map
MSN Map
OSM Map
General Map
Google Map
MSN Map
Please wait while loading the map...
Real estate property taxes paid for housing units in 2022:
This zip code:
1.4% ($2,306)
Iowa:
1.4% ($2,724)
Median real estate property taxes paid for housing units with mortgages in 2022: $2,347 (1.3%) Median real estate property taxes paid for housing units with no mortgage in 2022: $2,196 (1.4%)
Averages for the 2020 tax year for zip code 52001, filed in 2021:
Average Adjusted Gross Income (AGI) in 2020: $53,407 (Individual Income Tax Returns)
Here:
$53,407
State:
$71,087
Salary/wage: $43,006 (reported on 85.4% of returns)
Here:
$43,006
State:
$57,361
(% of AGI for various income ranges: 1112.7% for AGIs below $25k, 3471.2% for AGIs $25k-50k, 6163.9% for AGIs $50k-75k, 9178.8% for AGIs $75k-100k, 15012.3% for AGIs $100k-200k, 65891.5% for AGIs over 200k)
Taxable interest for individuals: $1,472 (reported on 36.3% of returns)
This zip code:
$1,472
Iowa:
$1,633
(% of AGI for various income ranges: 22.6% for AGIs below $25k, 28.3% for AGIs $25k-50k, 60.6% for AGIs $50k-75k, 95.4% for AGIs $75k-100k, 224.7% for AGIs $100k-200k, 2396.9% for AGIs over 200k)
Ordinary dividends: $6,319 (reported on 16.6% of returns)
Here:
$6,319
State:
$5,432
(% of AGI for various income ranges: 18.6% for AGIs below $25k, 26.9% for AGIs $25k-50k, 84.5% for AGIs $50k-75k, 145.9% for AGIs $75k-100k, 341.7% for AGIs $100k-200k, 8758.5% for AGIs over 200k)
Net capital gain/loss in AGI: +$18,509 (reported on 13.8% of returns)
Here:
+$18,509
State:
+$15,243
(% of AGI for various income ranges: 9.1% for AGIs below $25k, 20.5% for AGIs $25k-50k, 64.2% for AGIs $50k-75k, 146.4% for AGIs $75k-100k, 510.6% for AGIs $100k-200k, 31672.3% for AGIs over 200k)
Profit/loss from business: +$9,052 (reported on 10.9% of returns)
Here:
+$9,052
State:
+$11,763
(% of AGI for various income ranges: 78.2% for AGIs below $25k, 61.2% for AGIs $25k-50k, 112.1% for AGIs $50k-75k, 207.1% for AGIs $75k-100k, 348.5% for AGIs $100k-200k, 2726.2% for AGIs over 200k)
Taxable individual retirement arrangement distribution: $14,195 (reported on 9.9% of returns)
52001:
$14,195
Iowa:
$17,324
(% of AGI for various income ranges: 54.8% for AGIs below $25k, 84.4% for AGIs $25k-50k, 175.7% for AGIs $50k-75k, 344.6% for AGIs $75k-100k, 781.5% for AGIs $100k-200k, 3399.2% for AGIs over 200k)
Self-employed (Keogh) retirement plans: $26,950 (reported on 0.1% of returns)
52001:
$26,950
Iowa:
$22,144
(% of AGI for various income ranges: 50.4% for AGIs $100k-200k)
Total itemized deductions: $35,695 (reported on 3.7% of returns)
Here:
$35,695
State:
$33,775
(% of AGI for various income ranges: 40.9% for AGIs below $25k, 58.5% for AGIs $25k-50k, 130.5% for AGIs $50k-75k, 257.3% for AGIs $75k-100k, 544.9% for AGIs $100k-200k, 7062.3% for AGIs over 200k)
Charity contributions: $14,793 (reported on 2.9% of returns)
Here:
$14,793
State:
$13,075
(% of AGI for various income ranges: 4.6% for AGIs below $25k, 9.6% for AGIs $25k-50k, 19.7% for AGIs $50k-75k, 47.9% for AGIs $75k-100k, 142.2% for AGIs $100k-200k, 4056.9% for AGIs over 200k)
Taxes paid: $6,446 (reported on 3.7% of returns)
52001:
$6,446
State:
$7,704
(% of AGI for various income ranges: 3.1% for AGIs below $25k, 7.3% for AGIs $25k-50k, 29.9% for AGIs $50k-75k, 55.0% for AGIs $75k-100k, 134.6% for AGIs $100k-200k, 1095.4% for AGIs over 200k)
Earned income credit: $2,232 (reported on 17.5% of returns)
Here:
$2,232
State:
$2,195
(% of AGI for various income ranges: 93.1% for AGIs below $25k, 53.2% for AGIs $25k-50k, 1.1% for AGIs $50k-75k)
Percentage of individuals using paid preparers for their 2020 taxes: 95.5%
Here:
96%
State:
95%
(% for various income ranges: 94.6% for AGIs below $25k, 95.9% for AGIs $25k-50k, 96.7% for AGIs $50k-75k, 96.0% for AGIs $75k-100k, 96.0% for AGIs $100k-200k, 94.9% for AGIs over 200k)
Averages for the 2012 tax year for zip code 52001, filed in 2013:
Average Adjusted Gross Income (AGI) in 2012: $44,402 (Individual Income Tax Returns)
Here:
$44,402
State:
$58,860
Salary/wage: $37,536 (reported on 86.8% of returns)
Here:
$37,536
State:
$46,659
(% of AGI for various income ranges: 77.6% for AGIs below $25k, 80.2% for AGIs $25k-50k, 79.6% for AGIs $50k-75k, 79.1% for AGIs $75k-100k, 71.9% for AGIs $100k-200k, 49.0% for AGIs over 200k)
Taxable interest for individuals: $1,656 (reported on 40.5% of returns)
This zip code:
$1,656
Iowa:
$1,537
(% of AGI for various income ranges: 1.8% for AGIs below $25k, 1.2% for AGIs $25k-50k, 1.2% for AGIs $50k-75k, 1.1% for AGIs $75k-100k, 1.4% for AGIs $100k-200k, 2.4% for AGIs over 200k)
Ordinary dividends: $3,815 (reported on 18.8% of returns)
Here:
$3,815
State:
$4,542
(% of AGI for various income ranges: 1.1% for AGIs below $25k, 1.0% for AGIs $25k-50k, 1.0% for AGIs $50k-75k, 1.1% for AGIs $75k-100k, 1.9% for AGIs $100k-200k, 3.8% for AGIs over 200k)
Net capital gain/loss in AGI: +$7,995 (reported on 13.1% of returns)
Here:
+$7,995
State:
+$11,802
(% of AGI for various income ranges: 0.5% for AGIs $25k-50k, 0.3% for AGIs $50k-75k, 0.8% for AGIs $75k-100k, 2.0% for AGIs $100k-200k, 11.1% for AGIs over 200k)
Profit/loss from business: +$7,723 (reported on 11.1% of returns)
Here:
+$7,723
State:
+$10,509
(% of AGI for various income ranges: 4.4% for AGIs below $25k, 1.6% for AGIs $25k-50k, 1.8% for AGIs $50k-75k, 1.3% for AGIs $75k-100k, 1.8% for AGIs $100k-200k, 1.3% for AGIs over 200k)
Taxable individual retirement arrangement distribution: $9,794 (reported on 11.2% of returns)
52001:
$9,794
Iowa:
$11,773
(% of AGI for various income ranges: 3.0% for AGIs below $25k, 2.6% for AGIs $25k-50k, 2.2% for AGIs $50k-75k, 2.6% for AGIs $75k-100k, 3.2% for AGIs $100k-200k, 1.4% for AGIs over 200k)
Self-employment retirement plans: $13,800 (reported on 0.2% of returns)
52001:
$13,800
Iowa:
$18,614
Total itemized deductions: $18,681 (20% of AGI, reported on 22.5% of returns)
Here:
$18,681
State:
$21,278
Here:
19.7% of AGI
State:
18.9% of AGI
(% of AGI for various income ranges: 5.6% for AGIs below $25k, 7.4% for AGIs $25k-50k, 8.3% for AGIs $50k-75k, 11.0% for AGIs $75k-100k, 13.2% for AGIs $100k-200k, 11.9% for AGIs over 200k)
Charity contributions: $3,510 (reported on 18.6% of returns)
Here:
$3,510
State:
$4,044
(% of AGI for various income ranges: 0.6% for AGIs below $25k, 0.9% for AGIs $25k-50k, 1.0% for AGIs $50k-75k, 1.5% for AGIs $75k-100k, 2.3% for AGIs $100k-200k, 2.7% for AGIs over 200k)
Taxes paid: $7,370 (reported on 22.4% of returns)
52001:
$7,370
State:
$8,846
(% of AGI for various income ranges: 1.0% for AGIs below $25k, 2.0% for AGIs $25k-50k, 2.7% for AGIs $50k-75k, 4.2% for AGIs $75k-100k, 6.2% for AGIs $100k-200k, 6.7% for AGIs over 200k)
Earned income credit: $2,159 (reported on 19.2% of returns)
Here:
$2,159
State:
$2,098
(% of AGI for various income ranges: 5.9% for AGIs below $25k, 0.9% for AGIs $25k-50k)
Percentage of individuals using paid preparers for their 2012 taxes: 60.1%
Here:
60%
State:
65%
(% for various income ranges: 51.8% for AGIs below $25k, 62.9% for AGIs $25k-50k, 70.0% for AGIs $50k-75k, 67.3% for AGIs $75k-100k, 70.9% for AGIs $100k-200k, 85.7% for AGIs over 200k)
Averages for the 2004 tax year for zip code 52001, filed in 2005:
Average Adjusted Gross Income (AGI) in 2004: $36,072 (Individual Income Tax Returns)
Here:
$36,072
State:
$43,875
Salary/wage: $31,562 (reported on 86.3% of returns)
Here:
$31,562
State:
$38,265
(% of AGI for various income ranges: 96.4% for AGIs below $10k, 74.8% for AGIs $10k-25k, 79.9% for AGIs $25k-50k, 81.6% for AGIs $50k-75k, 78.9% for AGIs $75k-100k, 59.7% for AGIs over 100k)
Taxable interest for individuals: $1,760 (reported on 55.8% of returns)
This zip code:
$1,760
Iowa:
$1,768
(% of AGI for various income ranges: 5.6% for AGIs below $10k, 4.3% for AGIs $10k-25k, 2.4% for AGIs $25k-50k, 2.0% for AGIs $50k-75k, 1.9% for AGIs $75k-100k, 3.0% for AGIs over 100k)
Taxable dividends: $2,417 (reported on 23.3% of returns)
Here:
$2,417
State:
$2,510
(% of AGI for various income ranges: 2.7% for AGIs below $10k, 1.3% for AGIs $10k-25k, 1.0% for AGIs $25k-50k, 1.1% for AGIs $50k-75k, 1.2% for AGIs $75k-100k, 2.9% for AGIs over 100k)
Net capital gain/loss: +$5,096 (reported on 16.9% of returns)
Here:
+$5,096
State:
+$6,139
(% of AGI for various income ranges: -0.5% for AGIs below $10k, 0.4% for AGIs $10k-25k, 0.5% for AGIs $25k-50k, 1.0% for AGIs $50k-75k, 1.4% for AGIs $75k-100k, 8.3% for AGIs over 100k)
Profit/loss from business: +$7,590 (reported on 10.8% of returns)
Here:
+$7,590
State:
+$8,574
(% of AGI for various income ranges: 3.7% for AGIs below $10k, 2.7% for AGIs $10k-25k, 1.8% for AGIs $25k-50k, 1.6% for AGIs $50k-75k, 2.1% for AGIs $75k-100k, 3.2% for AGIs over 100k)
IRA payment deduction: $2,554 (reported on 3.3% of returns)
52001:
$2,554
Iowa:
$2,970
(% of AGI for various income ranges: 0.3% for AGIs below $10k, 0.3% for AGIs $10k-25k, 0.4% for AGIs $25k-50k, 0.2% for AGIs $50k-75k, 0.1% for AGIs $75k-100k, 0.1% for AGIs over 100k)
Self-employed pension: $8,871 (reported on 0.4% of returns)
Here:
$8,871
Iowa:
$11,928
Total itemized deductions: $15,239 (21% of AGI, reported on 25.1% of returns)
Here:
$15,239
State:
$16,976
Here:
21.2% of AGI
State:
20.8% of AGI
(% of AGI for various income ranges: 8.3% for AGIs below $10k, 7.8% for AGIs $10k-25k, 9.0% for AGIs $25k-50k, 10.5% for AGIs $50k-75k, 13.5% for AGIs $75k-100k, 13.2% for AGIs over 100k)
Charity contributions deductions: $2,980 (4% of AGI, reported on 22.6% of returns)
Here:
$2,980
State:
$3,089
Here:
4.0% of AGI
State:
3.6% of AGI
(% of AGI for various income ranges: 0.5% for AGIs below $10k, 1.0% for AGIs $10k-25k, 1.3% for AGIs $25k-50k, 1.4% for AGIs $50k-75k, 2.3% for AGIs $75k-100k, 3.5% for AGIs over 100k)
Total tax: $4,705 (reported on 73.7% of returns)
52001:
$4,705
State:
$6,177
(% of AGI for various income ranges: 2.2% for AGIs below $10k, 4.0% for AGIs $10k-25k, 6.6% for AGIs $25k-50k, 7.9% for AGIs $50k-75k, 10.2% for AGIs $75k-100k, 19.2% for AGIs over 100k)
Earned income credit: $1,501 (reported on 16.0% of returns)
Here:
$1,501
State:
$1,540
Percentage of individuals using paid preparers for their 2004 taxes: 67.9%
Here:
68%
State:
70%
(% for various income ranges: 57.6% for AGIs below $10k, 69.6% for AGIs $10k-25k, 71.1% for AGIs $25k-50k, 72.7% for AGIs $50k-75k, 68.2% for AGIs $75k-100k, 73.9% for AGIs over 100k)
Likely homosexual households (counted as self-reported same-sex unmarried-partner households)
Lesbian couples: 0.1% of all households
Gay men: 0.1% of all households
Household received Food Stamps/SNAP in the past 12 months: 2,077 Household did not receive Food Stamps/SNAP in the past 12 months: 16,700
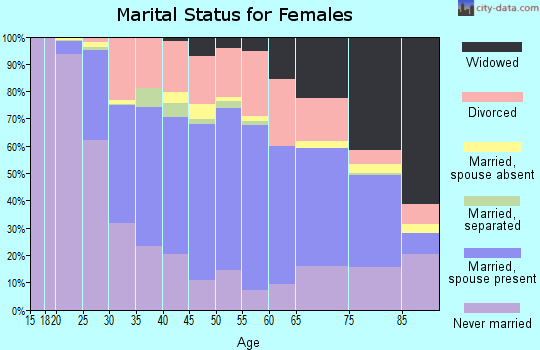
Women who had a birth in the past 12 months: 458 (275 now married, 176 unmarried) Women who did not have a birth in the past 12 months: 9,480 (2,931 now married, 6,557 unmarried)
Housing units in zip code 52001 with a mortgage: 7,404 (1,322 second mortgage, 7 home equity loan, 1,186 both second mortgage and home equity loan) Houses without a mortgage: 444
Median monthly owner costs for units with a mortgage: $1,174 Median monthly owner costs for units without a mortgage: $560
Residents with income below the poverty level in 2022:
This zip code:
13.5%
Whole state:
11.0%
Residents with income below 50% of the poverty level in 2022:
This zip code:
6.9%
Whole state:
5.5%
Median number of rooms in houses and condos:
Here:
6.5
State:
6.8
Median number of rooms in apartments:
Here:
4.0
State:
4.2
Notable locations in this zip code not listed on our city pages
Notable locations in zip code 52001: Town Clock Plaza (A), Cable Car Square (B), Fair Ground (C), Fenelon Place Elevator (D), Bunker Hill Golf Course (E), Henlon Parking Lot (F), R C Wahlert Sports Complex (G), Chlapaty Sports Complex (H), Terence Donaghoe Hall (I), Dubuque Residential Facility (J), Student Apartment Complex (K), Mary Benedict Hall (L), Mary Josita Hall (M), Keller Computer Center (N), Catherine Byrne Hall (O), Alumnae Lecture Hall (P), Eliza Kelly Hall (Q), Nicholas J Schrup Library (R), Hass Administrative Offices (S), RC and Celeste Wahlert Atrium (T). Display/hide their locations on the map
Churches in zip code 52001 include: Fellowship of Dubuque (A), Third Presbyterian Church (B), First Congregational Church (C), Temple Beth El (D), Saint Raphaels Cathedral (E), Salvation Army Church (F), Saint Patricks Catholic Church (G), First Presbyterian Church (H), Saint Johns Lutheran Church (I). Display/hide their locations on the map
Cemeteries: Saint Johns Cemetery (1), Linwood Cemetery (2), Jackson Park Cemetery (3), Third Street Cemetery (4), Doctor Finleys Cemetery (5), Cherry Hill Cemetery (6), Mount Calvary Cemetery (7). Display/hide their locations on the map
Parks in zip code 52001 include: Burden Field (1), Caledonia Park (2), Chalmers Field (3), Comiskey Field (4), Eagle Point Park (5), Washington Park (6), Henderson Memorial Park (7), Dubuque Greyhound Park (8), Jackson Park (9). Display/hide their locations on the map
Tourist attractions (not listed on the city page) : Center-Chamber of Commerce (300 Main Street) (1), Dubuque River Rides (Tours & Charters; 3 Road Street Ice Harbor) (2). Display/hide their approximate locations on the map
4,358 married couples with children.
2,500 single-parent households (470 men, 2,030 women).
94.8% of residents of 52001 zip code speak English at home.
2.6% of residents speak Spanish at home (73% very well, 13% well, 3% not well, 12% not at all).
1.0% of residents speak other Indo-European language at home (47% very well, 16% well, 37% not well).
1.2% of residents speak Asian or Pacific Island language at home (66% very well, 16% well, 16% not well, 1% not at all).
0.4% of residents speak other language at home (69% very well, 13% well, 18% not well).
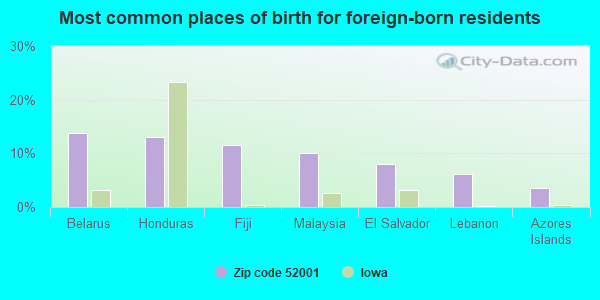
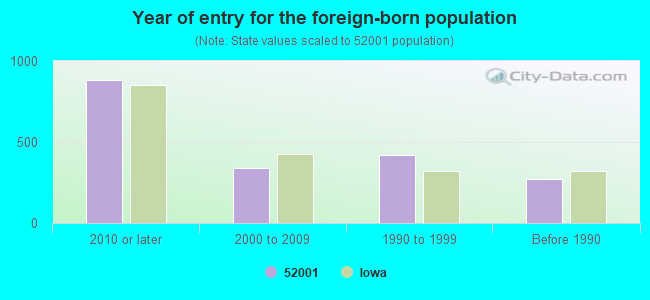
Foreign born population: 1,687 (3.9%) (40.3% of them are naturalized citizens)
Major facilities with environmental interests located in this zip code:
PEOPLES NATURAL GAS (502 EAST 11TH ST. in DUBUQUE, IA)
SUPERFUND NPL (Superfund database) (Integrated Compliance Information System) - ICIS-07-1988-0266, FORMAL ENFORCEMENT ACTION, ICIS-07-1992-0047, STATE MASTER (Iowa emission factors information) - CONSITES-172, SUPERFUND Organizations: CITY OF DUBUQUE, IOWA DEPARTMENT OF TRANSPORTATION, ENRON CORPORATION, MIDAMERICAN ENERGY, MWH (CONTACT/REGULATORY)
Alternative names: KEY CITY COAL GASIFICATION PLANT
HIGLEY CHEMICAL COMPANY (40 MAIN STREET in DUBUQUE, IA)
COMPLIANCE ACTIVITY (Tracking inspections of insecticide, fungicide, and rodenticide, and toxic substances) Alternative names: BROWN, WALLACE, BROWN, WALLACE/HIGLEY CHEM, HIGHLEY CHEMICAL COMPANY
PLASTIC CENTER, INC. D/B/A THE FISCHER COMPANIES (290 MAIN ST in DUBUQUE, IA)
ENFORCEMENT/COMPLIANCE ACTIVITY (Integrated Compliance Information System) - ICIS-07-2001-0301, FORMAL ENFORCEMENT ACTION (Integrated Compliance Information System) - ICIS-07-2001-0301, FORMAL ENFORCEMENT ACTION
MORRISON BROTHERS COMPANY (550 EAST 7TH STREET in DUBUQUE, IA)
AIR MINOR (AIRS/AFS) (Integrated Compliance Information System) - ICIS-07-1998-0228, FORMAL ENFORCEMENT ACTION CRITERIA AND HAZARDOUS AIR POLLUTANT INVENTORY (Inventory of air pollution sources) Small Quantity Generators, between 100 kg and 1000 kg of hazardous waste/month (Resource Conservation and Recovery Act (tracking hazardous waste)) TRI REPORTER (Tracking of toxic chemicals releasing facilities) Business SIC classification: VALVES AND PIPE FITTINGS Business NAICS classification: STEEL FOUNDRIES (EXCEPT INVESTMENT).; OTHER METAL VALVE AND PIPE FITTING MANUFACTURING. Alternative names: MORRISON BROS. CO., MORRISON BROTHERS FOUNDRY
NORTH END MOBILE HOME PARK (17448 JOHN DEERE ROAD in DUBUQUE, IA)
STATE MASTER (Iowa emission factors information) - SDWIS-IA3100609, DRINKING WATER SYSTEM National Pollutant Discharge Elimination System NON-MAJOR (Tracking pollutant discharge elimination systems) - permit COMMUNITY WATER SYSTEM (SDWIS) Business SIC classification: RECREATIONAL VEHICLE PARKS AND CAMPSITES Organizations: KEVIN JAEGER (CONTACT/OWNER)
SARA LEE BAKERY GROUP (25 MAIN STREET in DUBUQUE, IA)
AIR SYNTHETIC MINOR (AIRS/AFS) AIR MINOR (AIRS/AFS) (Integrated Compliance Information System) - ICIS-07-2001-0178, FORMAL ENFORCEMENT ACTION COMPLIANCE ACTIVITY (Tracking inspections of insecticide, fungicide, and rodenticide, and toxic substances) Business SIC classification: BREAD AND OTHER BAKERY PRODUCTS, EXCEPT COOKIES AND CRACKERS Alternative names: EARTHGRAINS BAKING COMPANIES INCORPORATED, METZ BAKING CO, METZ BAKING COMPANY DBA EARTHGRAINS COMPANY, METZ BAKING company OF DUBUQUE
ALLIANT ENERGY DATA CENTER (1000 MAIN STREET in DUBUQUE, IA)
COMPLIANCE ACTIVITY (Tracking inspections of insecticide, fungicide, and rodenticide, and toxic substances) National Pollutant Discharge Elimination System MAJOR (Tracking pollutant discharge elimination systems) - permit National Pollutant Discharge Elimination System NON-MAJOR (Tracking pollutant discharge elimination systems) - permit National Pollutant Discharge Elimination System NON-MAJOR (Tracking pollutant discharge elimination systems) - permit Business SIC classification: ELECTRIC SERVICES; ELECTRIC AND OTHER SERVICES COMBINED; MANAGEMENT SERVICES Organizations: INTERSTATE POWER & LIGHT COMPA (CONTACT/OWNER)
, ALLIANT ENERGY-DUBUQUE GENERAL (CONTACT/OWNER)
Alternative names: ALLIANT ENERGY-DUBUQUE GENERAL, INTERSTATE POWER CO, INTERSTATE POWER CO. DUBUQUE S, IP&L-DUBUQUE STATION
SWISS VALLEY FARMS (3510 CENTRAL AVENUE in DUBUQUE, IA)
AIR MINOR (AIRS/AFS) (Integrated Compliance Information System) - ICIS-07-2002-0105, FORMAL ENFORCEMENT ACTION COMPLIANCE ACTIVITY (Tracking inspections of insecticide, fungicide, and rodenticide, and toxic substances) TRI REPORTER (Tracking of toxic chemicals releasing facilities) Business SIC classification: DRY, CONDENSED, AND EVAPORATED DAIRY PRODUCTS; FLUID MILK Alternative names: SWISS VALLEY FARMS, HILLDALE DIV
AUTOMOTIVE ENTERPRISES CO INC (2400 KERPER BOULEVARD in DUBUQUE, IA)
AIR MINOR (AIRS/AFS) COMPLIANCE ACTIVITY (Tracking inspections of insecticide, fungicide, and rodenticide, and toxic substances) Small Quantity Generators, between 100 kg and 1000 kg of hazardous waste/month (Resource Conservation and Recovery Act (tracking hazardous waste)) - notification (Resource Conservation and Recovery Act (tracking hazardous waste)) TRI REPORTER (Tracking of toxic chemicals releasing facilities) Business SIC classification: ELECTROPLATING, PLATING, POLISHING, ANODIZING, AND COLORING; INTERNAL COMBUSTION ENGINES; MOTOR VEHICLE PARTS AND ACCESSORIES Organizations: LYLE WHALEN (CONTACT/OWNER)
, XXXXXX (CONTACT/OWNER)
Alternative names: AIH BODY SHOP SUPPLY COMPANY, AIH CHROME, AUTOMOTIVE INDUSTRIAL HARDWARE, AUTOMOTIVE INDUSTRIAL HARDWARE-DUPLICATE, KEYSTONE AUTOMOTIVE, KEYSTONE AUTOMATIVE, NORTH STAR PAINT & BODY SUPPLY
DUBUQUE WATER WORKS (1902 HAWTHORNE STREET in DUBUQUE, IA)
AIR SYNTHETIC MINOR (AIRS/AFS) STATE MASTER (Iowa emission factors information) - SDWIS-IA3126052, DRINKING WATER SYSTEM COMMUNITY WATER SYSTEM (SDWIS) Business SIC classification: WATER SUPPLY; SEWERAGE SYSTEMS; REFUSE SYSTEMS Alternative names: DUBUQUE WATER DEPT, DUBUQUE WATER DEPT-EAGLE POINT WATER PLT, EAGLE POINT WATER PLANT
SYSTEMS BIO INDUSTRIES INC (2350 KERPER BOULEVARD in DUBUQUE, IA)
AIR MINOR (AIRS/AFS) National Pollutant Discharge Elimination System NON-MAJOR (Tracking pollutant discharge elimination systems) - permit (Resource Conservation and Recovery Act (tracking hazardous waste)) TRI REPORTER (Tracking of toxic chemicals releasing facilities) Business SIC classification: FOOD PREPARATIONS; CHEMICALS AND CHEMICAL PREPARATIONS Organizations: ROUSSELOT, INC. (CONTACT/OWNER)
Alternative names: ROUSSELOT, ROUSSELOT SKW NATURE PRODUCTS, SKW BIOSYSTEMS, SKW BIOSYTEMS, SKW GELATIN & SPECIALTIES MFG, SKW GELATINE & SPECIALTIES MFG LLC, SKW NATURE PRODUCTS
DON MARCOV SALVAGE (1897 WASHINGON STREET in DUBUQUE, IA)
AIR MINOR (AIRS/AFS) (Integrated Compliance Information System) - ICIS-07-2002-0060, FORMAL ENFORCEMENT ACTION Business SIC classification: SCRAP AND WASTE MATERIALS
PHILIP MIHALAKIS (1575 MAPLE in DUBUQUE, IA)
AIR MINOR (AIRS/AFS) (Integrated Compliance Information System) - ICIS-07-1992-0259, FORMAL ENFORCEMENT ACTION Business SIC classification: NONCLASSIFIABLE ESTABLISHMENTS Alternative names: CLOSED FACILITY -- PHILIP MIHALAKIS
Housing units lacking complete plumbing facilities: 2.1% Housing units lacking complete kitchen facilities: 2.7%
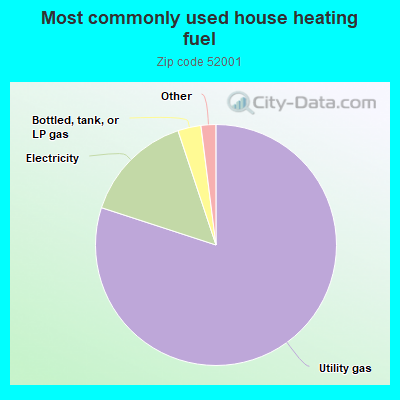
80.1%Utility gas
14.9%Electricity
3.1%Bottled, tank, or LP gas
0.5%No fuel used
0.5%Fuel oil, kerosene, etc.
Population in 1990: 41,934. Population change in the 1990s: +2,099 (+5.0%).
Place of birth for U.S.-born residents:
This state: 29,255
Northeast: 696
Midwest: 8,030
South: 1,456
West: 1,621
58% of the 52001 zip code residents lived in the same house 5 years ago. Out of people who lived in different houses, 63% lived in this county. Out of people who lived in different counties, 50% lived in Iowa.
87% of the 52001 zip code residents lived in the same house 1 year ago. Out of people who lived in different houses, 63% moved from this county. Out of people who lived in different houses, 11% moved from different county within same state. Out of people who lived in different houses, 22% moved from different state. Out of people who lived in different houses, 2% moved from abroad.
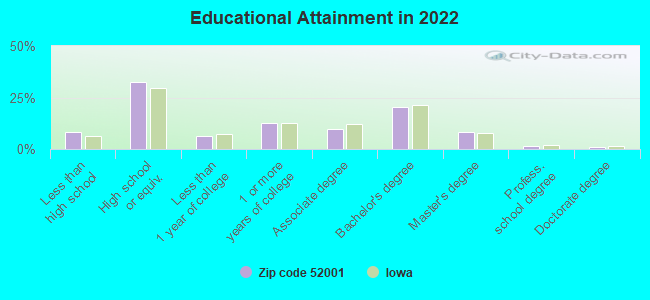
Private vs. public school enrollment:
Students in private schools in grades 1 to 8 (elementary and middle school): 405
Here:
12.0%
Iowa:
10.6%
Students in private schools in grades 9 to 12 (high school): 194
Here:
10.7%
Iowa:
7.9%
Students in private undergraduate colleges: 2,547
Here:
75.8%
Iowa:
23.9%
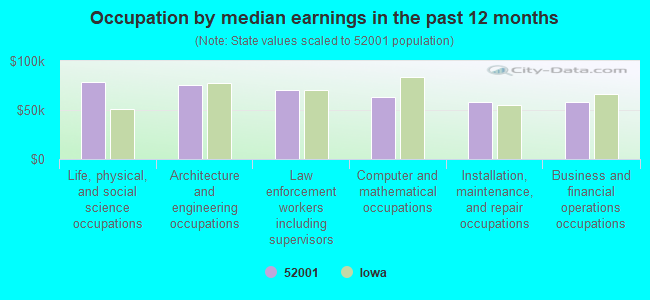
Occupation by median earnings in the past 12 months ($)
78,390Life, physical, and social science occupations
75,053Architecture and engineering occupations
70,858Law enforcement workers including supervisors
63,144Computer and mathematical occupations
58,537Installation, maintenance, and repair occupations
58,056Business and financial operations occupations
Companies with biggest federal contracts located in this zip code (DUBUQUE, IA):
DUBUQUE BARGE & FLEETING SERVI (5 JONES ST) : $8,358,479 in 65 contractsfrom 2001 to 2006
Contracts for Construction of Structures and Facilities -- Other Conservation and Development Facilities, Mineral Construction Materials, Bulk, Construction of Structures and Facilities -- Dams, Maintenance, Repair or Alteration of Real Property -- Restoration of real property, and moreby U.S. Army Corps of Engineers - civil program financing only, Army Signed by year:2000: $0; 2001: $212,640; 2002: $101,339; 2003: $376,939; 2004: $7,854,472; 2005: -$216,028; 2006: $29,117.
Biggest contracts:
$1,500,000 with U.S. Army Corps of Engineers - civil program financing only for Construction of Structures and Facilities -- Other Conservation and Development Facilities. Taking place in NE. Signed on 2004-03-08. Completion date: 2005-03-08.
$1,500,000 with Army for Construction of Structures and Facilities -- Other Conservation and Development Facilities. Taking place in NE. Signed on 2004-03-08. Completion date: 2005-03-08.
$600,000 with Army for Mineral Construction Materials, Bulk. Signed on 2004-08-16. Completion date: 2004-09-30.
$600,000 with U.S. Army Corps of Engineers - civil program financing only for Mineral Construction Materials, Bulk. Signed on 2004-08-16. Completion date: 2004-09-30.
DUBUQUE DESIGN GROUP INC (858 WHITE STREET; small business) : $111,967 in 3 contractsin 2006
$61,008 with Navy for Specialized Shipping and Storage Containers. Signed on 2006-03-15. Completion date: 2006-03-31.
$35,873 with Navy for ADP Input/Output and Storage Devices. Signed on 2006-01-20. Completion date: 2006-02-06.
$15,086 with Navy for ADP Software. Signed on 2006-04-27. Completion date: 2006-05-12.
MATERIALS & EQUIPMENT, INC (2728 ASBURY ROAD - SUITE 5; small business) : $93,825 in 5 contractsfrom 2003 to 2006
Contracts for Laboratory Equipment and Supplies, Foundry Machinery, Related Equipment and Supplies, Industrial Furnaces, Kilns, Lehrs, and Ovens by Army Signed by year:2000: $0; 2001: $0; 2002: $0; 2003: -$4,513; 2004: $39,238; 2005: $0; 2006: $59,100.
Biggest contracts:
$59,100 with Army for Laboratory Equipment and Supplies. Signed on 2006-03-22. Completion date: 2006-05-22.
$20,020 with Army for Foundry Machinery, Related Equipment and Supplies. Signed on 2004-10-25. Completion date: 2004-12-23.
$19,218, same as above.Signed on 2004-03-23. Completion date: 2004-07-02.
$0 with Army for Industrial Furnaces, Kilns, Lehrs, and Ovens. Signed on 2003-02-26. Completion date: 2002-03-29.
DAVID C POTTER (1871 GLEN OAK; small business) : $61,903 in 8 contractsfrom 2002 to 2006
Contracts for Other Housekeeping Services, Landscaping/Groundskeeping Services by Navy Signed by year:2000: $0; 2001: $0; 2002: $10,055; 2003: $10,335; 2004: $16,865; 2005: $12,010; 2006: $12,638.
Biggest contracts:
$14,565 with Navy for Other Housekeeping Services. Signed on 2004-04-01. Completion date: 2005-03-31.
$12,638 with Navy for Landscaping/Groundskeeping Services. Signed on 2006-03-30. Completion date: 2006-03-31.
$12,010, same as above.Signed on 2005-05-19. Completion date: 2006-03-31.
$10,335, same as above.Signed on 2003-05-14. Completion date: 2004-03-31.
FPI INTERNATIONAL INC (406 E 7TH STREET; small business)
$53,250 with U.S. Army Corps of Engineers - civil program financing only for Bags and Sacks. Signed on 2001-04-19. Completion date: 2001-05-18.
CLARKE COLLEGE (1550 CLARKE DR) : $34,960 in 2 contractsfrom 2004 to 2005
$17,960 with Army for Educational Services. Signed on 2005-08-04. Completion date: 2005-08-04.
$17,000, same as above.Signed on 2004-09-23. Completion date: 2004-09-23.
JAEGER PLUMBING & PUMP COMPANY (17500 S JOHN DEERE RD; small business) : $33,566 in 3 contractsfrom 2002 to 2004
$25,000 with Navy for Maintenance, Repair or Alteration of Real Property -- Other Administrative Facilities and Service Buildings. Signed on 2002-09-30. Completion date: 2002-10-07.
$4,283 with U.S. Army Corps of Engineers - civil program financing only for Plumbing Fixtures and Accessories. Signed on 2004-08-09. Completion date: 2004-07-28.
$4,283 with Army for Plumbing Fixtures and Accessories. Signed on 2004-08-09. Completion date: 2004-07-28.
MILLER ELECTRIC SUPPLY INC (2300 KERPER BLVD) : $14,664 in 3 contractsin 2005
$4,888 with Army for Ship and Boat Propulsion Components. Signed on 2005-03-02. Completion date: 2005-03-15.
$4,888 with Army for Miscellaneous Engines and Components. Signed on 2005-09-08. Completion date: 2005-09-02.
$4,888 with U.S. Army Corps of Engineers - civil program financing only for Miscellaneous Engines and Components. Signed on 2005-09-08. Completion date: 2005-09-02.
UNIVERSITY OF DUBUQUE (2000 UNIVERSITY AVE) : $12,176 in 3 contractsin 2006
$6,176 with Army for Education Services. Signed on 2006-02-07. Completion date: 2006-02-07.
$3,500, same as above.Signed on 2006-03-21. Completion date: 2006-03-21.
$2,500, same as above.Signed on 2006-05-23. Completion date: 2006-05-23.
WELU INC (1685 CENTRAL AVE; small business) : $9,840 in 4 contractsfrom 2005 to 2006
$3,300 with Army for Trash/Garbage Collection Services - Including Portable Sanitation Services. Signed on 2006-03-02. Completion date: 2004-12-15.
$3,120, same as above.Signed on 2005-03-14. Completion date: 2004-12-15.
$3,120 with U.S. Army Corps of Engineers - civil program financing only for Trash/Garbage Collection Services - Including Portable Sanitation Services. Signed on 2005-03-14. Completion date: 2004-12-15.
$300 with Army for Trash/Garbage Collection Services - Including Portable Sanitation Services. Signed on 2006-03-08. Completion date: 2004-12-15.
Top industries in this zip code by the number of employees in 2005:
Health Care and Social Assistance: General Medical and Surgical Hospitals (over 1000 employees: 1 establishment, 500-999 employees: 1 establishment)
Educational Services: Colleges, Universities, and Professional Schools (500-999: 3)
2002 - 2018 National Fire Incident Reporting System (NFIRS) incidents
According to the data from the years 2002 - 2018 the average number of fire incidents per year is 143. The highest number of fire incidents - 236 took place in 2002, and the least - 82 in 2018. The data has a dropping trend.
When looking into fire subcategories, the most incidents belonged to: Structure Fires (42.5%), and Outside Fires (36.1%).
Fire incident types reported to NFIRS in Zip Code 52001

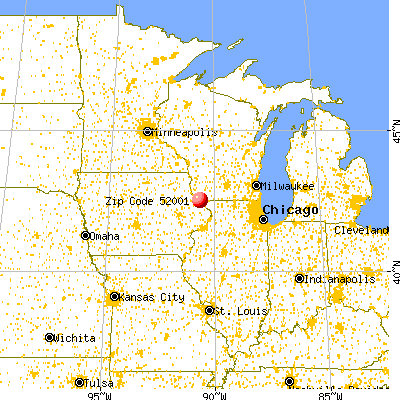


 Nearest zip codes: 52002, 52003, 53808, 52073, 53820, 61025.


 According to the data from the years 2002 - 2018 the average number of fire incidents per year is 143. The highest number of fire incidents - 236 took place in 2002, and the least - 82 in 2018. The data has a dropping trend.
 When looking into fire subcategories, the most incidents belonged to: Structure Fires (42.5%), and Outside Fires (36.1%).