Estimated zip code population in 2022: 23,333 Zip code population in 2010: 21,686 Zip code population in 2000: 21,598
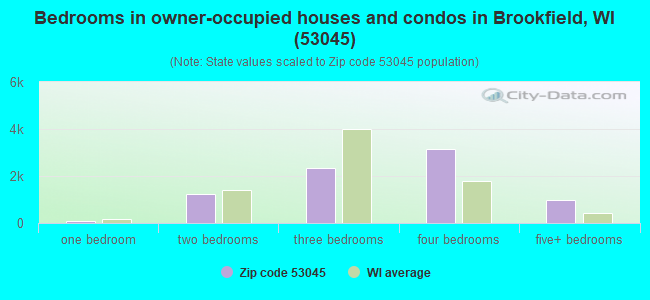
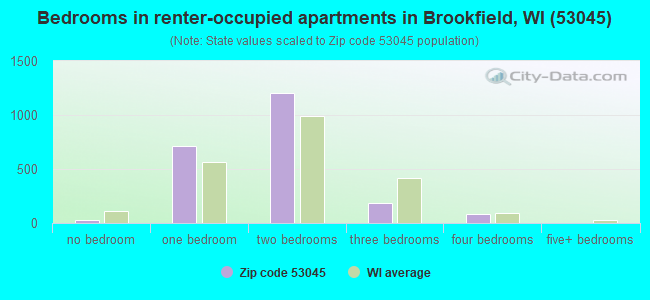
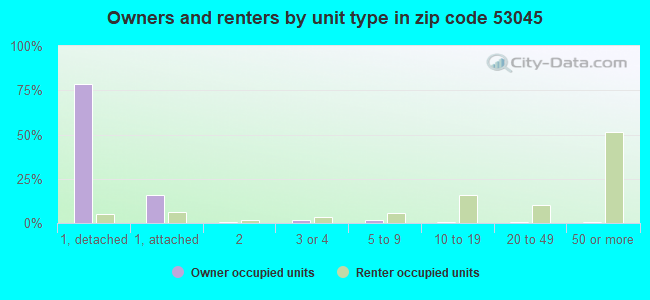
Houses and condos: 10,281 Renter-occupied apartments: 2,206
% of renters here:
22%
State:
32%
March 2022 cost of living index in zip code 53045: 100.2 (near average, U.S. average is 100)
Land area: 14.4 sq. mi. Water area: 0.2 sq. mi.
Population density: 1,623 people per square mile
(low).
OSM Map
General Map
Google Map
MSN Map
OSM Map
General Map
Google Map
MSN Map
OSM Map
General Map
Google Map
MSN Map
OSM Map
General Map
Google Map
MSN Map
Please wait while loading the map...
Real estate property taxes paid for housing units in 2022:
This zip code:
1.1% ($5,121)
Wisconsin:
1.4% ($3,497)
Median real estate property taxes paid for housing units with mortgages in 2022: $5,258 (1.1%) Median real estate property taxes paid for housing units with no mortgage in 2022: $4,855 (1.1%)
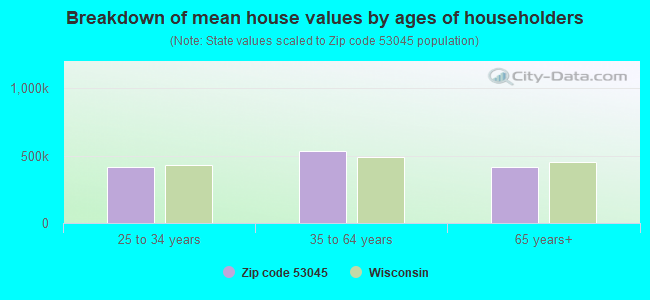
Estimated median house/condo value in 2022: $448,354
53045:
$448,354
Wisconsin:
$252,800
According to our research of Wisconsin and other state lists, there were 8 registered sex offenders living in 53045 zip code as of April 27, 2024. The ratio of all residents to sex offenders in zip code 53045 is 2,690 to 1. The ratio of registered sex offenders to all residents in this zip code is much lower than the state average.
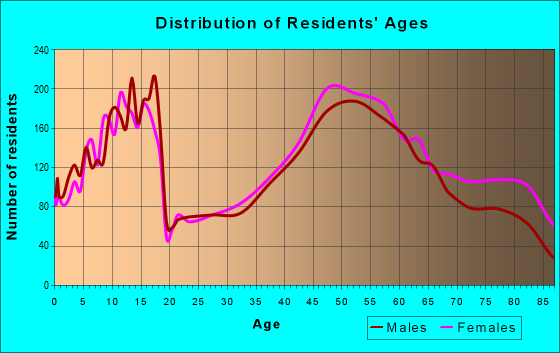
Median resident age:
This zip code:
46.4 years
Wisconsin median age:
40.4 years
Average household size:
This zip code:
2.3 people
Wisconsin:
2.3 people
Averages for the 2020 tax year for zip code 53045, filed in 2021:
Average Adjusted Gross Income (AGI) in 2020: $146,559 (Individual Income Tax Returns)
Here:
$146,559
State:
$72,319
Salary/wage: $122,674 (reported on 76.8% of returns)
Here:
$122,674
State:
$59,242
(% of AGI for various income ranges: 1208.7% for AGIs below $25k, 3424.3% for AGIs $25k-50k, 6037.1% for AGIs $50k-75k, 8609.6% for AGIs $75k-100k, 18640.7% for AGIs $100k-200k, 94620.0% for AGIs over 200k)
Taxable interest for individuals: $3,029 (reported on 54.7% of returns)
This zip code:
$3,029
Wisconsin:
$1,431
(% of AGI for various income ranges: 56.0% for AGIs below $25k, 89.2% for AGIs $25k-50k, 120.7% for AGIs $50k-75k, 163.6% for AGIs $75k-100k, 236.1% for AGIs $100k-200k, 1711.1% for AGIs over 200k)
Ordinary dividends: $12,436 (reported on 47.4% of returns)
Here:
$12,436
State:
$6,481
(% of AGI for various income ranges: 100.5% for AGIs below $25k, 204.3% for AGIs $25k-50k, 279.0% for AGIs $50k-75k, 442.2% for AGIs $75k-100k, 788.5% for AGIs $100k-200k, 6923.1% for AGIs over 200k)
Net capital gain/loss in AGI: +$24,056 (reported on 42.2% of returns)
Here:
+$24,056
State:
+$18,329
(% of AGI for various income ranges: 78.5% for AGIs below $25k, 120.6% for AGIs $25k-50k, 187.9% for AGIs $50k-75k, 470.3% for AGIs $75k-100k, 815.0% for AGIs $100k-200k, 14368.4% for AGIs over 200k)
Profit/loss from business: +$26,385 (reported on 14.0% of returns)
Here:
+$26,385
State:
+$14,562
(% of AGI for various income ranges: 91.3% for AGIs below $25k, 225.1% for AGIs $25k-50k, 269.7% for AGIs $50k-75k, 410.0% for AGIs $75k-100k, 732.8% for AGIs $100k-200k, 3350.0% for AGIs over 200k)
Taxable individual retirement arrangement distribution: $28,467 (reported on 18.5% of returns)
53045:
$28,467
Wisconsin:
$19,348
(% of AGI for various income ranges: 144.9% for AGIs below $25k, 372.4% for AGIs $25k-50k, 588.9% for AGIs $50k-75k, 903.3% for AGIs $75k-100k, 1479.2% for AGIs $100k-200k, 3111.4% for AGIs over 200k)
Self-employed (Keogh) retirement plans: $23,553 (reported on 1.6% of returns)
53045:
$23,553
Wisconsin:
$21,322
(% of AGI for various income ranges: 43.8% for AGIs $50k-75k, 60.3% for AGIs $100k-200k, 450.4% for AGIs over 200k)
Total itemized deductions: $46,161 (reported on 17.1% of returns)
Here:
$46,161
State:
$33,000
(% of AGI for various income ranges: 146.0% for AGIs below $25k, 309.3% for AGIs $25k-50k, 535.1% for AGIs $50k-75k, 797.4% for AGIs $75k-100k, 1152.2% for AGIs $100k-200k, 8572.7% for AGIs over 200k)
Charity contributions: $14,320 (reported on 14.8% of returns)
Here:
$14,320
State:
$12,044
(% of AGI for various income ranges: 11.4% for AGIs below $25k, 27.0% for AGIs $25k-50k, 67.4% for AGIs $50k-75k, 125.7% for AGIs $75k-100k, 262.2% for AGIs $100k-200k, 2728.4% for AGIs over 200k)
Taxes paid: $8,904 (reported on 17.1% of returns)
53045:
$8,904
State:
$8,228
(% of AGI for various income ranges: 26.1% for AGIs below $25k, 57.1% for AGIs $25k-50k, 144.3% for AGIs $50k-75k, 238.5% for AGIs $75k-100k, 354.4% for AGIs $100k-200k, 1234.7% for AGIs over 200k)
Earned income credit: $1,723 (reported on 3.6% of returns)
Here:
$1,723
State:
$2,155
(% of AGI for various income ranges: 25.1% for AGIs below $25k, 33.6% for AGIs $25k-50k)
Percentage of individuals using paid preparers for their 2020 taxes: 91.9%
Here:
92%
State:
94%
(% for various income ranges: 88.0% for AGIs below $25k, 92.6% for AGIs $25k-50k, 92.4% for AGIs $50k-75k, 90.7% for AGIs $75k-100k, 93.0% for AGIs $100k-200k, 95.2% for AGIs over 200k)
Averages for the 2012 tax year for zip code 53045, filed in 2013:
Average Adjusted Gross Income (AGI) in 2012: $129,545 (Individual Income Tax Returns)
Here:
$129,545
State:
$57,939
Salary/wage: $106,366 (reported on 77.5% of returns)
Here:
$106,366
State:
$48,248
(% of AGI for various income ranges: 64.0% for AGIs below $25k, 62.0% for AGIs $25k-50k, 60.1% for AGIs $50k-75k, 65.1% for AGIs $75k-100k, 71.3% for AGIs $100k-200k, 61.0% for AGIs over 200k)
Taxable interest for individuals: $2,467 (reported on 60.3% of returns)
This zip code:
$2,467
Wisconsin:
$1,224
(% of AGI for various income ranges: 2.8% for AGIs below $25k, 2.0% for AGIs $25k-50k, 1.4% for AGIs $50k-75k, 1.3% for AGIs $75k-100k, 1.1% for AGIs $100k-200k, 1.0% for AGIs over 200k)
Ordinary dividends: $9,051 (reported on 49.1% of returns)
Here:
$9,051
State:
$5,137
(% of AGI for various income ranges: 6.4% for AGIs below $25k, 4.0% for AGIs $25k-50k, 3.4% for AGIs $50k-75k, 2.8% for AGIs $75k-100k, 2.8% for AGIs $100k-200k, 3.6% for AGIs over 200k)
Net capital gain/loss in AGI: +$16,705 (reported on 40.2% of returns)
Here:
+$16,705
State:
+$11,137
(% of AGI for various income ranges: 0.8% for AGIs below $25k, 0.9% for AGIs $25k-50k, 0.7% for AGIs $50k-75k, 1.5% for AGIs $75k-100k, 1.8% for AGIs $100k-200k, 7.8% for AGIs over 200k)
Profit/loss from business: +$29,443 (reported on 13.9% of returns)
Here:
+$29,443
State:
+$11,943
(% of AGI for various income ranges: 4.5% for AGIs below $25k, 3.9% for AGIs $25k-50k, 4.1% for AGIs $50k-75k, 2.9% for AGIs $75k-100k, 3.8% for AGIs $100k-200k, 2.7% for AGIs over 200k)
Taxable individual retirement arrangement distribution: $22,459 (reported on 21.2% of returns)
53045:
$22,459
Wisconsin:
$14,087
(% of AGI for various income ranges: 8.6% for AGIs below $25k, 7.3% for AGIs $25k-50k, 6.8% for AGIs $50k-75k, 5.8% for AGIs $75k-100k, 5.6% for AGIs $100k-200k, 2.0% for AGIs over 200k)
Self-employment retirement plans: $19,743 (reported on 1.9% of returns)
53045:
$19,743
Wisconsin:
$17,048
(% of AGI for various income ranges: 0.5% for AGIs $50k-75k, 0.3% for AGIs $100k-200k, 0.3% for AGIs over 200k)
Total itemized deductions: $33,778 (16% of AGI, reported on 56.5% of returns)
Here:
$33,778
State:
$22,257
Here:
16.4% of AGI
State:
20.1% of AGI
(% of AGI for various income ranges: 23.9% for AGIs below $25k, 18.3% for AGIs $25k-50k, 17.3% for AGIs $50k-75k, 18.2% for AGIs $75k-100k, 17.8% for AGIs $100k-200k, 12.3% for AGIs over 200k)
Charity contributions: $5,372 (reported on 51.6% of returns)
Here:
$5,372
State:
$3,370
(% of AGI for various income ranges: 1.4% for AGIs below $25k, 2.0% for AGIs $25k-50k, 2.2% for AGIs $50k-75k, 2.4% for AGIs $75k-100k, 2.5% for AGIs $100k-200k, 2.0% for AGIs over 200k)
Taxes paid: $18,694 (reported on 56.2% of returns)
53045:
$18,694
State:
$10,731
(% of AGI for various income ranges: 6.2% for AGIs below $25k, 6.2% for AGIs $25k-50k, 7.0% for AGIs $50k-75k, 8.3% for AGIs $75k-100k, 9.2% for AGIs $100k-200k, 8.0% for AGIs over 200k)
Earned income credit: $1,551 (reported on 3.8% of returns)
Here:
$1,551
State:
$2,094
(% of AGI for various income ranges: 1.5% for AGIs below $25k, 0.3% for AGIs $25k-50k)
Percentage of individuals using paid preparers for their 2012 taxes: 53.5%
Here:
53%
State:
54%
(% for various income ranges: 44.4% for AGIs below $25k, 52.2% for AGIs $25k-50k, 57.1% for AGIs $50k-75k, 52.5% for AGIs $75k-100k, 54.9% for AGIs $100k-200k, 69.4% for AGIs over 200k)
Averages for the 2004 tax year for zip code 53045, filed in 2005:
Average Adjusted Gross Income (AGI) in 2004: $104,059 (Individual Income Tax Returns)
Here:
$104,059
State:
$47,735
Salary/wage: $89,221 (reported on 77.7% of returns)
Here:
$89,221
State:
$41,540
(% of AGI for various income ranges: 598.8% for AGIs below $10k, 52.1% for AGIs $10k-25k, 61.5% for AGIs $25k-50k, 67.5% for AGIs $50k-75k, 69.0% for AGIs $75k-100k, 66.1% for AGIs over 100k)
Taxable interest for individuals: $2,841 (reported on 73.8% of returns)
This zip code:
$2,841
Wisconsin:
$1,420
(% of AGI for various income ranges: 70.2% for AGIs below $10k, 6.7% for AGIs $10k-25k, 3.6% for AGIs $25k-50k, 2.0% for AGIs $50k-75k, 2.1% for AGIs $75k-100k, 1.7% for AGIs over 100k)
Taxable dividends: $4,979 (reported on 57.4% of returns)
Here:
$4,979
State:
$2,869
(% of AGI for various income ranges: 67.5% for AGIs below $10k, 7.0% for AGIs $10k-25k, 4.3% for AGIs $25k-50k, 2.5% for AGIs $50k-75k, 2.7% for AGIs $75k-100k, 2.4% for AGIs over 100k)
Net capital gain/loss: +$18,150 (reported on 48.3% of returns)
Here:
+$18,150
State:
+$9,569
(% of AGI for various income ranges: -27.2% for AGIs below $10k, 1.7% for AGIs $10k-25k, 1.4% for AGIs $25k-50k, 1.6% for AGIs $50k-75k, 1.9% for AGIs $75k-100k, 10.6% for AGIs over 100k)
Profit/loss from business: +$24,034 (reported on 14.7% of returns)
Here:
+$24,034
State:
+$10,417
(% of AGI for various income ranges: -30.8% for AGIs below $10k, 4.8% for AGIs $10k-25k, 4.6% for AGIs $25k-50k, 3.3% for AGIs $50k-75k, 3.0% for AGIs $75k-100k, 3.4% for AGIs over 100k)
Profit/loss from farming: +$1,812 (reported on 0.1% of returns)
Here:
+$1,812
State:
-$2,654
IRA payment deduction: $3,451 (reported on 3.2% of returns)
53045:
$3,451
Wisconsin:
$2,900
(% of AGI for various income ranges: 1.7% for AGIs below $10k, 0.4% for AGIs $10k-25k, 0.4% for AGIs $25k-50k, 0.3% for AGIs $50k-75k, 0.2% for AGIs $75k-100k, 0.1% for AGIs over 100k)
Self-employed pension: $16,904 (reported on 2.5% of returns)
Here:
$16,904
Wisconsin:
$11,934
(% of AGI for various income ranges: 0.3% for AGIs $25k-50k, 0.2% for AGIs $50k-75k, 0.2% for AGIs $75k-100k, 0.5% for AGIs over 100k)
Total itemized deductions: $28,529 (17% of AGI, reported on 58.5% of returns)
Here:
$28,529
State:
$18,160
Here:
17.3% of AGI
State:
21.1% of AGI
(% of AGI for various income ranges: 133.1% for AGIs below $10k, 25.2% for AGIs $10k-25k, 22.0% for AGIs $25k-50k, 21.6% for AGIs $50k-75k, 21.0% for AGIs $75k-100k, 14.1% for AGIs over 100k)
Charity contributions deductions: $5,286 (3% of AGI, reported on 55.3% of returns)
Here:
$5,286
State:
$2,711
Here:
3.1% of AGI
State:
3.0% of AGI
(% of AGI for various income ranges: 6.9% for AGIs below $10k, 2.3% for AGIs $10k-25k, 2.7% for AGIs $25k-50k, 2.8% for AGIs $50k-75k, 2.8% for AGIs $75k-100k, 2.8% for AGIs over 100k)
Total tax: $23,387 (reported on 81.0% of returns)
53045:
$23,387
State:
$7,114
(% of AGI for various income ranges: 15.2% for AGIs below $10k, 4.3% for AGIs $10k-25k, 7.5% for AGIs $25k-50k, 9.0% for AGIs $50k-75k, 9.7% for AGIs $75k-100k, 21.2% for AGIs over 100k)
Earned income credit: $1,085 (reported on 2.5% of returns)
Here:
$1,085
State:
$1,544
Percentage of individuals using paid preparers for their 2004 taxes: 55.4%
Here:
55%
State:
57%
(% for various income ranges: 46.5% for AGIs below $10k, 55.5% for AGIs $10k-25k, 55.9% for AGIs $25k-50k, 55.0% for AGIs $50k-75k, 54.9% for AGIs $75k-100k, 62.4% for AGIs over 100k)
Likely homosexual households (counted as self-reported same-sex unmarried-partner households)
Lesbian couples: 0.1% of all households
Gay men: 0.0% of all households
Household received Food Stamps/SNAP in the past 12 months: 363 Household did not receive Food Stamps/SNAP in the past 12 months: 9,471
Women who had a birth in the past 12 months: 113 (106 now married, 6 unmarried) Women who did not have a birth in the past 12 months: 4,349 (2,158 now married, 2,190 unmarried)
Housing units in zip code 53045 with a mortgage: 4,598 (721 second mortgage, 4 home equity loan, 721 both second mortgage and home equity loan) Houses without a mortgage: 288
Median monthly owner costs for units with a mortgage: $2,243 Median monthly owner costs for units without a mortgage: $957
Residents with income below the poverty level in 2022:
This zip code:
4.8%
Whole state:
10.7%
Residents with income below 50% of the poverty level in 2022:
This zip code:
2.5%
Whole state:
5.7%
Median number of rooms in houses and condos:
Here:
7.8
State:
6.5
Median number of rooms in apartments:
Here:
3.5
State:
4.1
Notable locations in this zip code not listed on our city pages
Notable locations in zip code 53045: Town of Brookfield Fire Department (A), Brookfield Town Hall (B), Brookfield Fire Department Station 2 (C). Display/hide their locations on the map
Churches in zip code 53045 include: Brookfield Church (A), Trinity Church (B), Saint Lukes Church (C), Saint Luke Catholic Church (D). Display/hide their locations on the map
Parks in zip code 53045 include: Beverly Hills Park (1), Camelot Park (2), Canterbury Hills Park (3), Rolling Meadows Park (4), McCoy Field (5), Brook Park (6), Eble Park (7), Fairview Park (8), Fox Brook Park (9). Display/hide their locations on the map
4,334 married couples with children.
560 single-parent households (96 men, 464 women).
85.5% of residents of 53045 zip code speak English at home.
0.9% of residents speak Spanish at home (63% very well, 36% well, 1% not at all).
6.3% of residents speak other Indo-European language at home (85% very well, 14% well, 2% not well).
7.5% of residents speak Asian or Pacific Island language at home (70% very well, 21% well, 10% not well).
0.7% of residents speak other language at home (84% very well, 9% well, 7% not well).
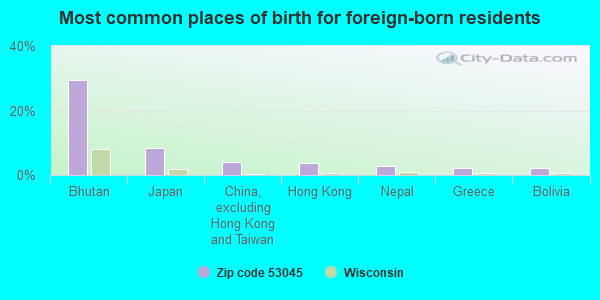
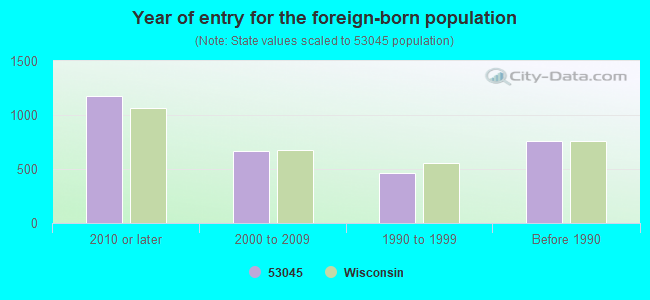
Foreign born population: 2,866 (12.3%) (53.1% of them are naturalized citizens)
Facilities with environmental interests located in this zip code:
BROOKFIELD CITY OF (21225 ENTERPRISE AVENUE in BROOKFIELD, WI)
(Integrated Compliance Information System) - ICIS-05-2005-1234, ENFORCEMENT/COMPLIANCE ACTIVITY FORMAL ENFORCEMENT ACTION (Integrated Compliance Information System) - ICIS-05-2005-1234, ENFORCEMENT/COMPLIANCE ACTIVITY National Pollutant Discharge Elimination System MAJOR (Tracking pollutant discharge elimination systems) - permit National Pollutant Discharge Elimination System NON-MAJOR (Tracking pollutant discharge elimination systems) - permit Conditionally Exempt Small Quantity Generators, less than 100 kg/month of hazardous waste (Resource Conservation and Recovery Act (tracking hazardous waste)) STATE MASTER (Wisconsin database) - SDWIS-WI2680746, DRINKING WATER SYSTEM STATE MASTER (Wisconsin database) - PCS-WI0023469, WASTEWATER FACILITY STATE MASTER (Wisconsin database) - RCRAINFO-WID000608604, CESQG Business SIC classification: SEWERAGE SYSTEMS Organizations: FOX RIVER WATER POLLUTION CONTROL CENTER, BROOKFIELD FOX WATER POLLUTION CNTRL Alternative names: BROOKFIELD FOX WATER POLLUTION, FOX RIVER WATER POLLUTION CONTROL CENT
BLUEMOUND CLEANERS (19035 W BLUEMOUND RD in BROOKFIELD, WI)
(Resource Conservation and Recovery Act (tracking hazardous waste)) STATE MASTER (Wisconsin database) - RCRAINFO-WIR000045781, CESQG Organizations: CHONG PARK (CONTACT/OWNER)
BECKERS AUTO BODY INC (2915 N BROOKFIELD RD in BROOKFIELD, WI)
Conditionally Exempt Small Quantity Generators, less than 100 kg/month of hazardous waste (Resource Conservation and Recovery Act (tracking hazardous waste)) - notification STATE MASTER (Wisconsin database) - RCRAINFO-WIR000036988, CESQG Organizations: GERALD P BECKER (CONTACT/OWNER)
BROOKFIELD CLEANERS (17145-K W BLUEMOUND RD in BROOKFIELD, WI)
Conditionally Exempt Small Quantity Generators, less than 100 kg/month of hazardous waste (Resource Conservation and Recovery Act (tracking hazardous waste)) - notification STATE MASTER (Wisconsin database) - RCRAINFO-WIR000005686, CESQG Organizations: RYOU JAMES (CONTACT/OWNER)
BROOKFIELD CTY (19450 RIVERVIEW DR in BROOKFIELD, WI)
Conditionally Exempt Small Quantity Generators, less than 100 kg/month of hazardous waste (Resource Conservation and Recovery Act (tracking hazardous waste)) - notification STATE MASTER (Wisconsin database) - RCRAINFO-WID988620175, CESQG Organizations: BROOKFIELD CITY OF (CONTACT/OWNER)
Alternative names: BROOKFIELD HWY GARAGE CITY OF
CAPITOL WEST CLEANERS (17495 W CAPITOL DR in BROOKFIELD, WI)
Conditionally Exempt Small Quantity Generators, less than 100 kg/month of hazardous waste (Resource Conservation and Recovery Act (tracking hazardous waste)) - notification STATE MASTER (Wisconsin database) - RCRAINFO-WID988628442, CESQG Organizations: OH JUNG (CONTACT/OWNER)
BLEADY KEN R (17965 W BURLEIGH RD in BROOKFIELD, WI)
Small Quantity Generators, between 100 kg and 1000 kg of hazardous waste/month (Resource Conservation and Recovery Act (tracking hazardous waste)) - notification
Housing units lacking complete plumbing facilities: 0.2% Housing units lacking complete kitchen facilities: 1.7%
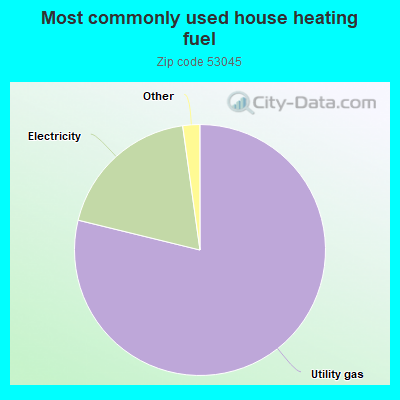
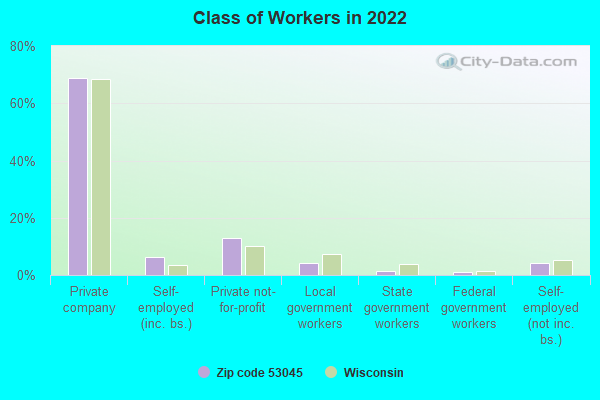
78.9%Utility gas
19.0%Electricity
0.9%Bottled, tank, or LP gas
0.7%No fuel used
Population in 1990: 15,412. Population change in the 1990s: +6,186 (+40.1%).
Place of birth for U.S.-born residents:
This state: 14,726
Northeast: 783
Midwest: 3,499
South: 660
West: 615
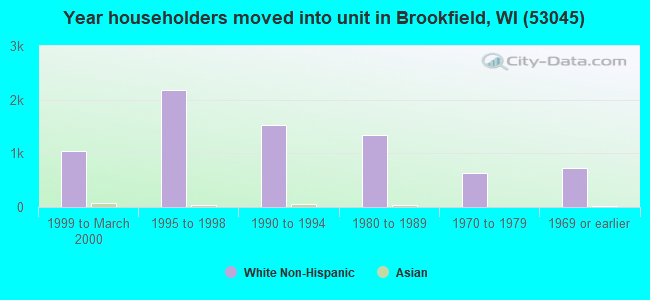
59% of the 53045 zip code residents lived in the same house 5 years ago. Out of people who lived in different houses, 39% lived in this county. Out of people who lived in different counties, 50% lived in Wisconsin.
90% of the 53045 zip code residents lived in the same house 1 year ago. Out of people who lived in different houses, 40% moved from this county. Out of people who lived in different houses, 41% moved from different county within same state. Out of people who lived in different houses, 18% moved from different state. Out of people who lived in different houses, 3% moved from abroad.
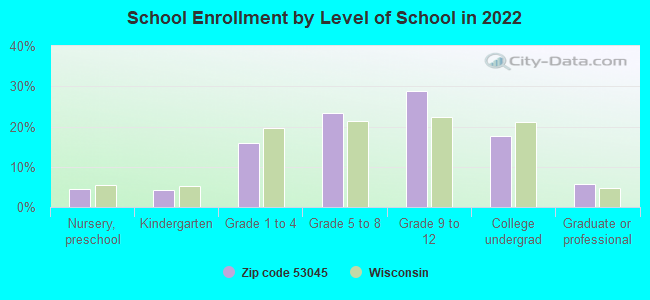
Private vs. public school enrollment:
Students in private schools in grades 1 to 8 (elementary and middle school): 249
Here:
11.3%
Wisconsin:
16.7%
Students in private schools in grades 9 to 12 (high school): 175
Here:
10.8%
Wisconsin:
12.5%
Students in private undergraduate colleges: 221
Here:
22.4%
Wisconsin:
17.5%
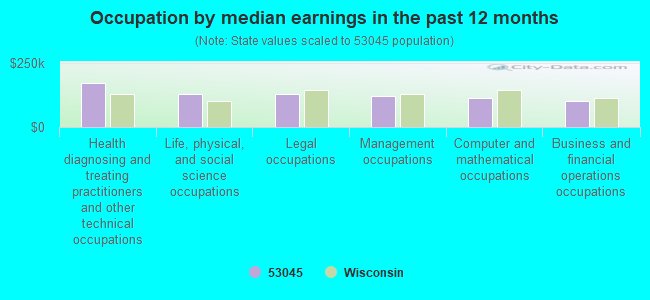
Occupation by median earnings in the past 12 months ($)
171,298Health diagnosing and treating practitioners and other technical occupations
128,337Life, physical, and social science occupations
127,526Legal occupations
121,057Management occupations
111,532Computer and mathematical occupations
99,444Business and financial operations occupations
Companies with federal contracts located in this zip code (BROOKFIELD, WI):
DONALD RODENBERG (20585 BARTLETT DR; small business)
$342,000 with Army for Maintenance, Repair and Rebuilding of Equipment -- Maintenance and Repair Shop Equipment. Signed on 2006-04-04. Completion date: 2007-04-17.
WISCONSIN BELL TELEPHONE COMPA (17950 W CORPORATE DR RM 2) : $194,152 in 36 contractsfrom 2003 to 2005
Contracts for ADP Telecommunications and Transmission Services by Department of Defense, Defense Information Systems Agency Signed by year:2000: $0; 2001: $0; 2002: $0; 2003: $38,373; 2004: $144,307; 2005: $11,472; 2006: $0.
Biggest contracts:
$19,000 with Department of Defense for ADP Telecommunications and Transmission Services. Signed on 2004-11-30. Completion date: 2004-11-03.
$14,600, same as above.Signed on 2004-11-30. Completion date: 2004-10-18.
$13,400, same as above.Signed on 2005-06-30. Completion date: 2005-05-20.
$10,796, same as above.Signed on 2003-08-31. Completion date: 2013-06-16.
PILLAR CORPORATION (21905 GATEWAY ROAD; small business) : $164,640 in 3 contractsfrom 2001 to 2003
$98,680 with Army for Maintenance, Repair and Rebuilding of Equipment -- Instruments and Laboratory Equipment. Taking place in NJ. Signed on 2003-07-31. Completion date: 2003-10-20.
$34,120 with Navy for Metal Heat Treating and Non-Thermal Treating Equipment. Signed on 2001-04-11. Completion date: 2001-06-15.
$31,840 with Navy for Laundry and Dry Cleaning Equipment. Signed on 2002-02-22. Completion date: 2002-09-30.
VIDEO IMAGES INC (285 N JANACEK RD) : $62,387 in 2 contractsfrom 1999 to 2000
$31,785 with Air Force for Photographic Projection Equipment. Signed on 2000-06-27. Completion date: 2000-10-15.
$30,602 with Navy for ADP Support Equipment. Signed on 1999-10-01. Completion date: 1999-03-16.
CONTROLS FOR MOTION AUTOMATION (3265 GATEWAY RD STE 300; small business)
$36,460 with Army for ADP Supplies. Signed on 2005-01-19. Completion date: 2005-03-18.
Top industries in this zip code by the number of employees in 2005:
2003 - 2018 National Fire Incident Reporting System (NFIRS) incidents
Based on the data from the years 2003 - 2018 the average number of fire incidents per year is 45. The highest number of fires - 94 took place in 2012, and the least - 4 in 2007. The data has a rising trend.
When looking into fire subcategories, the most reports belonged to: Structure Fires (55.0%), and Outside Fires (21.9%).
Fire incident types reported to NFIRS in Zip Code 53045


+$1,812
-$2,654
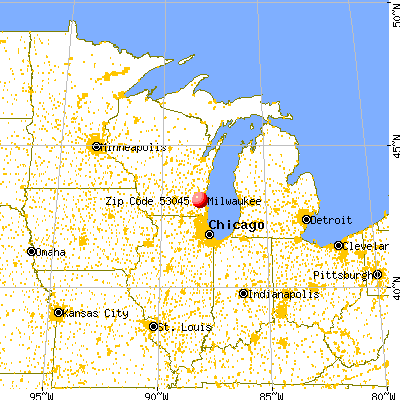
 Nearest zip codes: 53005, 53186, 53122, 53702, 53146, 53007.
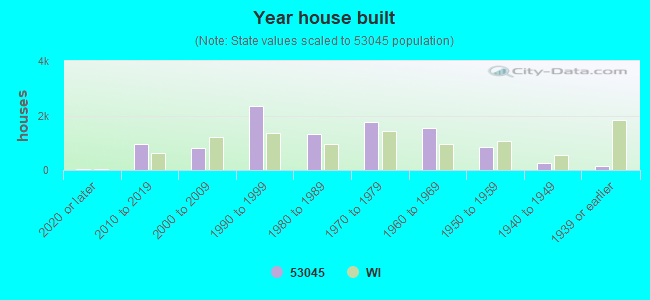


 Based on the data from the years 2003 - 2018 the average number of fire incidents per year is 45. The highest number of fires - 94 took place in 2012, and the least - 4 in 2007. The data has a rising trend.
 When looking into fire subcategories, the most reports belonged to: Structure Fires (55.0%), and Outside Fires (21.9%).