Estimated zip code population in 2022: 7,759 Zip code population in 2010: 7,458 Zip code population in 2000: 7,355
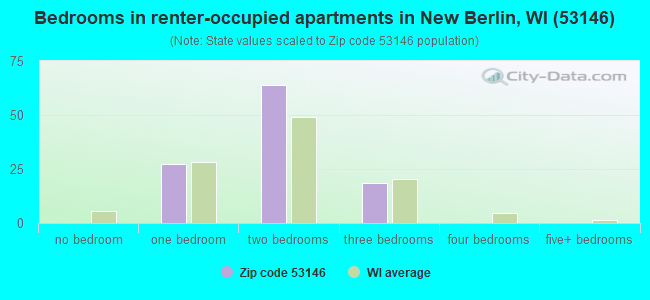
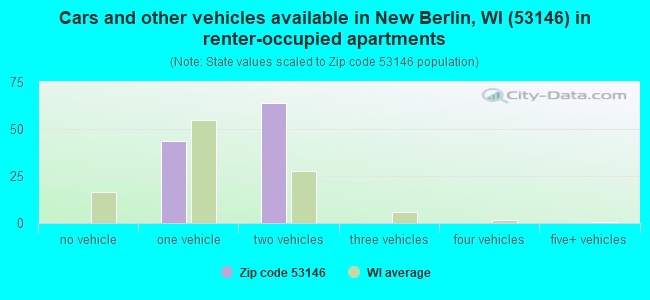
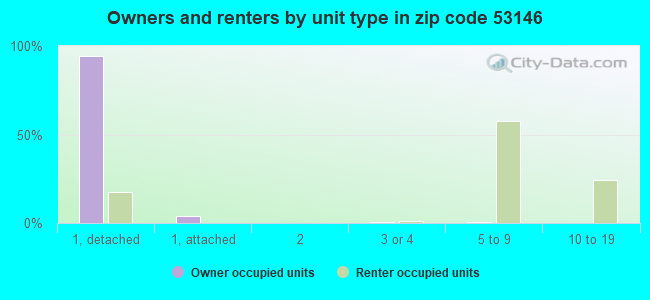
Houses and condos: 3,194 Renter-occupied apartments: 109
% of renters here:
3%
State:
32%
March 2022 cost of living index in zip code 53146: 97.6 (near average, U.S. average is 100)
Land area: 18.4 sq. mi. Water area: 0.3 sq. mi.
Population density: 423 people per square mile
(low).
OSM Map
General Map
Google Map
MSN Map
OSM Map
General Map
Google Map
MSN Map
OSM Map
General Map
Google Map
MSN Map
OSM Map
General Map
Google Map
MSN Map
Please wait while loading the map...
Real estate property taxes paid for housing units in 2022:
This zip code:
1.3% ($4,147)
Wisconsin:
1.4% ($3,497)
Median real estate property taxes paid for housing units with mortgages in 2022: $4,168 (1.2%) Median real estate property taxes paid for housing units with no mortgage in 2022: $4,149 (1.3%)
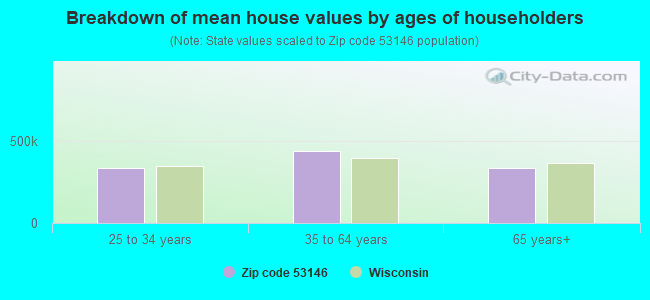
Estimated median house/condo value in 2022: $330,366
53146:
$330,366
Wisconsin:
$252,800
According to our research of Wisconsin and other state lists, there were 14 registered sex offenders living in 53146 zip code as of April 27, 2024. The ratio of all residents to sex offenders in zip code 53146 is 574 to 1. The ratio of registered sex offenders to all residents in this zip code is lower than the state average.
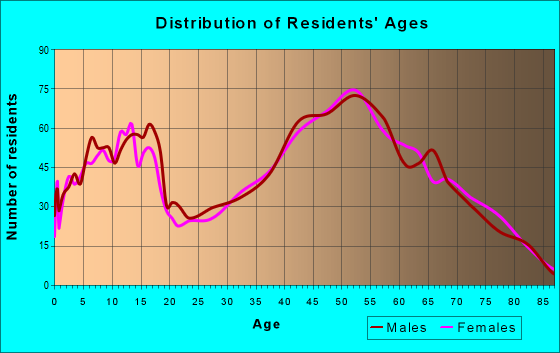
Median resident age:
This zip code:
51.0 years
Wisconsin median age:
40.4 years
Average household size:
This zip code:
2.4 people
Wisconsin:
2.3 people
Averages for the 2020 tax year for zip code 53146, filed in 2021:
Average Adjusted Gross Income (AGI) in 2020: $110,255 (Individual Income Tax Returns)
Here:
$110,255
State:
$72,319
Salary/wage: $85,005 (reported on 78.8% of returns)
Here:
$85,005
State:
$59,242
(% of AGI for various income ranges: 1149.6% for AGIs below $25k, 3345.3% for AGIs $25k-50k, 6497.7% for AGIs $50k-75k, 9440.0% for AGIs $75k-100k, 18719.0% for AGIs $100k-200k, 77909.2% for AGIs over 200k)
Taxable interest for individuals: $1,694 (reported on 51.3% of returns)
This zip code:
$1,694
Wisconsin:
$1,431
(% of AGI for various income ranges: 35.8% for AGIs below $25k, 38.1% for AGIs $25k-50k, 64.0% for AGIs $50k-75k, 94.5% for AGIs $75k-100k, 142.0% for AGIs $100k-200k, 1498.3% for AGIs over 200k)
Ordinary dividends: $7,162 (reported on 34.4% of returns)
Here:
$7,162
State:
$6,481
(% of AGI for various income ranges: 95.4% for AGIs below $25k, 87.0% for AGIs $25k-50k, 166.9% for AGIs $50k-75k, 201.0% for AGIs $75k-100k, 320.2% for AGIs $100k-200k, 4936.7% for AGIs over 200k)
Net capital gain/loss in AGI: +$14,486 (reported on 29.3% of returns)
Here:
+$14,486
State:
+$18,329
(% of AGI for various income ranges: 23.3% for AGIs below $25k, 62.6% for AGIs $25k-50k, 139.7% for AGIs $50k-75k, 282.3% for AGIs $75k-100k, 474.3% for AGIs $100k-200k, 10384.2% for AGIs over 200k)
Profit/loss from business: +$17,607 (reported on 13.8% of returns)
Here:
+$17,607
State:
+$14,562
(% of AGI for various income ranges: 136.3% for AGIs below $25k, 131.5% for AGIs $25k-50k, 258.3% for AGIs $50k-75k, 180.6% for AGIs $75k-100k, 664.1% for AGIs $100k-200k, 2775.0% for AGIs over 200k)
Taxable individual retirement arrangement distribution: $18,355 (reported on 17.1% of returns)
53146:
$18,355
Wisconsin:
$19,348
(% of AGI for various income ranges: 196.7% for AGIs below $25k, 308.1% for AGIs $25k-50k, 551.7% for AGIs $50k-75k, 526.1% for AGIs $75k-100k, 836.7% for AGIs $100k-200k, 1665.0% for AGIs over 200k)
Self-employed (Keogh) retirement plans: $29,300 (reported on 0.5% of returns)
53146:
$29,300
Wisconsin:
$21,322
(% of AGI for various income ranges: 114.9% for AGIs $100k-200k)
Total itemized deductions: $38,160 (reported on 13.5% of returns)
Here:
$38,160
State:
$33,000
(% of AGI for various income ranges: 177.5% for AGIs below $25k, 184.0% for AGIs $25k-50k, 472.6% for AGIs $50k-75k, 535.8% for AGIs $75k-100k, 949.6% for AGIs $100k-200k, 8565.8% for AGIs over 200k)
Charity contributions: $15,056 (reported on 11.0% of returns)
Here:
$15,056
State:
$12,044
(% of AGI for various income ranges: 26.0% for AGIs $25k-50k, 29.4% for AGIs $50k-75k, 59.7% for AGIs $75k-100k, 201.6% for AGIs $100k-200k, 4196.7% for AGIs over 200k)
Taxes paid: $8,767 (reported on 13.3% of returns)
53146:
$8,767
State:
$8,228
(% of AGI for various income ranges: 28.8% for AGIs below $25k, 36.6% for AGIs $25k-50k, 112.9% for AGIs $50k-75k, 175.2% for AGIs $75k-100k, 305.3% for AGIs $100k-200k, 1451.7% for AGIs over 200k)
Earned income credit: $1,689 (reported on 4.6% of returns)
Here:
$1,689
State:
$2,155
(% of AGI for various income ranges: 34.8% for AGIs below $25k, 26.2% for AGIs $25k-50k)
Percentage of individuals using paid preparers for their 2020 taxes: 92.1%
Here:
92%
State:
94%
(% for various income ranges: 87.4% for AGIs below $25k, 92.2% for AGIs $25k-50k, 93.0% for AGIs $50k-75k, 93.9% for AGIs $75k-100k, 93.5% for AGIs $100k-200k, 97.1% for AGIs over 200k)
Averages for the 2012 tax year for zip code 53146, filed in 2013:
Average Adjusted Gross Income (AGI) in 2012: $85,756 (Individual Income Tax Returns)
Here:
$85,756
State:
$57,939
Salary/wage: $65,526 (reported on 82.7% of returns)
Here:
$65,526
State:
$48,248
(% of AGI for various income ranges: 63.3% for AGIs below $25k, 69.4% for AGIs $25k-50k, 70.1% for AGIs $50k-75k, 77.0% for AGIs $75k-100k, 79.8% for AGIs $100k-200k, 42.9% for AGIs over 200k)
Taxable interest for individuals: $1,175 (reported on 53.7% of returns)
This zip code:
$1,175
Wisconsin:
$1,224
(% of AGI for various income ranges: 1.7% for AGIs below $25k, 1.1% for AGIs $25k-50k, 0.9% for AGIs $50k-75k, 0.5% for AGIs $75k-100k, 0.7% for AGIs $100k-200k, 0.6% for AGIs over 200k)
Ordinary dividends: $4,861 (reported on 35.1% of returns)
Here:
$4,861
State:
$5,137
(% of AGI for various income ranges: 3.2% for AGIs below $25k, 1.6% for AGIs $25k-50k, 1.6% for AGIs $50k-75k, 1.0% for AGIs $75k-100k, 1.3% for AGIs $100k-200k, 3.0% for AGIs over 200k)
Net capital gain/loss in AGI: +$7,399 (reported on 25.1% of returns)
Here:
+$7,399
State:
+$11,137
(% of AGI for various income ranges: 0.4% for AGIs $50k-75k, 0.7% for AGIs $75k-100k, 1.2% for AGIs $100k-200k, 4.7% for AGIs over 200k)
Profit/loss from business: +$17,460 (reported on 13.6% of returns)
Here:
+$17,460
State:
+$11,943
(% of AGI for various income ranges: 4.5% for AGIs below $25k, 1.5% for AGIs $25k-50k, 3.3% for AGIs $50k-75k, 2.3% for AGIs $75k-100k, 2.5% for AGIs $100k-200k, 3.1% for AGIs over 200k)
Taxable individual retirement arrangement distribution: $15,440 (reported on 18.3% of returns)
53146:
$15,440
Wisconsin:
$14,087
(% of AGI for various income ranges: 9.7% for AGIs below $25k, 6.3% for AGIs $25k-50k, 4.2% for AGIs $50k-75k, 3.6% for AGIs $75k-100k, 2.8% for AGIs $100k-200k, 2.0% for AGIs over 200k)
Self-employment retirement plans: $23,367 (reported on 0.8% of returns)
53146:
$23,367
Wisconsin:
$17,048
Total itemized deductions: $25,530 (19% of AGI, reported on 52.9% of returns)
Here:
$25,530
State:
$22,257
Here:
19.1% of AGI
State:
20.1% of AGI
(% of AGI for various income ranges: 23.0% for AGIs below $25k, 16.3% for AGIs $25k-50k, 17.3% for AGIs $50k-75k, 17.1% for AGIs $75k-100k, 17.1% for AGIs $100k-200k, 12.9% for AGIs over 200k)
Charity contributions: $4,445 (reported on 46.1% of returns)
Here:
$4,445
State:
$3,370
(% of AGI for various income ranges: 1.4% for AGIs below $25k, 1.5% for AGIs $25k-50k, 1.5% for AGIs $50k-75k, 1.7% for AGIs $75k-100k, 2.0% for AGIs $100k-200k, 3.5% for AGIs over 200k)
Taxes paid: $12,328 (reported on 52.9% of returns)
53146:
$12,328
State:
$10,731
(% of AGI for various income ranges: 5.8% for AGIs below $25k, 5.8% for AGIs $25k-50k, 7.3% for AGIs $50k-75k, 7.9% for AGIs $75k-100k, 8.9% for AGIs $100k-200k, 7.2% for AGIs over 200k)
Earned income credit: $1,513 (reported on 6.0% of returns)
Here:
$1,513
State:
$2,094
(% of AGI for various income ranges: 2.0% for AGIs below $25k, 0.4% for AGIs $25k-50k)
Percentage of individuals using paid preparers for their 2012 taxes: 50.3%
Here:
50%
State:
54%
(% for various income ranges: 41.4% for AGIs below $25k, 50.0% for AGIs $25k-50k, 56.5% for AGIs $50k-75k, 49.1% for AGIs $75k-100k, 54.7% for AGIs $100k-200k, 73.7% for AGIs over 200k)
Averages for the 2004 tax year for zip code 53146, filed in 2005:
Average Adjusted Gross Income (AGI) in 2004: $60,819 (Individual Income Tax Returns)
Here:
$60,819
State:
$47,735
Salary/wage: $53,012 (reported on 84.7% of returns)
Here:
$53,012
State:
$41,540
(% of AGI for various income ranges: 143.0% for AGIs below $10k, 64.2% for AGIs $10k-25k, 70.5% for AGIs $25k-50k, 80.7% for AGIs $50k-75k, 81.4% for AGIs $75k-100k, 67.5% for AGIs over 100k)
Taxable interest for individuals: $1,258 (reported on 68.8% of returns)
This zip code:
$1,258
Wisconsin:
$1,420
(% of AGI for various income ranges: 9.4% for AGIs below $10k, 3.9% for AGIs $10k-25k, 2.2% for AGIs $25k-50k, 0.9% for AGIs $50k-75k, 1.1% for AGIs $75k-100k, 1.2% for AGIs over 100k)
Taxable dividends: $1,938 (reported on 40.2% of returns)
Here:
$1,938
State:
$2,869
(% of AGI for various income ranges: 7.4% for AGIs below $10k, 2.2% for AGIs $10k-25k, 1.3% for AGIs $25k-50k, 0.9% for AGIs $50k-75k, 1.0% for AGIs $75k-100k, 1.4% for AGIs over 100k)
Net capital gain/loss: +$7,304 (reported on 29.7% of returns)
Here:
+$7,304
State:
+$9,569
(% of AGI for various income ranges: -6.9% for AGIs below $10k, -0.3% for AGIs $10k-25k, 1.2% for AGIs $25k-50k, 1.3% for AGIs $50k-75k, 1.7% for AGIs $75k-100k, 6.9% for AGIs over 100k)
Profit/loss from business: +$13,157 (reported on 13.5% of returns)
Here:
+$13,157
State:
+$10,417
(% of AGI for various income ranges: 5.4% for AGIs below $10k, 3.8% for AGIs $10k-25k, 4.4% for AGIs $25k-50k, 3.2% for AGIs $50k-75k, 2.2% for AGIs $75k-100k, 2.6% for AGIs over 100k)
IRA payment deduction: $3,252 (reported on 3.6% of returns)
53146:
$3,252
Wisconsin:
$2,900
(% of AGI for various income ranges: 0.3% for AGIs $10k-25k, 0.6% for AGIs $25k-50k, 0.3% for AGIs $50k-75k, 0.2% for AGIs $75k-100k, 0.1% for AGIs over 100k)
Self-employed pension: $12,392 (reported on 1.4% of returns)
Here:
$12,392
Wisconsin:
$11,934
Total itemized deductions: $19,424 (21% of AGI, reported on 55.5% of returns)
Here:
$19,424
State:
$18,160
Here:
21.3% of AGI
State:
21.1% of AGI
(% of AGI for various income ranges: 31.1% for AGIs below $10k, 15.7% for AGIs $10k-25k, 18.0% for AGIs $25k-50k, 20.0% for AGIs $50k-75k, 19.3% for AGIs $75k-100k, 15.7% for AGIs over 100k)
Charity contributions deductions: $2,529 (3% of AGI, reported on 50.1% of returns)
Here:
$2,529
State:
$2,711
Here:
2.7% of AGI
State:
3.0% of AGI
(% of AGI for various income ranges: 1.5% for AGIs below $10k, 1.5% for AGIs $10k-25k, 2.1% for AGIs $25k-50k, 2.0% for AGIs $50k-75k, 2.2% for AGIs $75k-100k, 2.1% for AGIs over 100k)
Total tax: $9,110 (reported on 83.8% of returns)
53146:
$9,110
State:
$7,114
(% of AGI for various income ranges: 3.7% for AGIs below $10k, 4.8% for AGIs $10k-25k, 8.0% for AGIs $25k-50k, 8.7% for AGIs $50k-75k, 9.8% for AGIs $75k-100k, 18.0% for AGIs over 100k)
Earned income credit: $1,325 (reported on 3.2% of returns)
Here:
$1,325
State:
$1,544
Percentage of individuals using paid preparers for their 2004 taxes: 49.1%
Here:
49%
State:
57%
(% for various income ranges: 37.0% for AGIs below $10k, 42.7% for AGIs $10k-25k, 50.5% for AGIs $25k-50k, 52.4% for AGIs $50k-75k, 53.0% for AGIs $75k-100k, 60.6% for AGIs over 100k)
Likely homosexual households (counted as self-reported same-sex unmarried-partner households)
Lesbian couples: 0.0% of all households
Gay men: 0.6% of all households
Household received Food Stamps/SNAP in the past 12 months: 49 Household did not receive Food Stamps/SNAP in the past 12 months: 3,135
Women who had a birth in the past 12 months: 115 (115 now married, 0 unmarried) Women who did not have a birth in the past 12 months: 1,241 (598 now married, 643 unmarried)
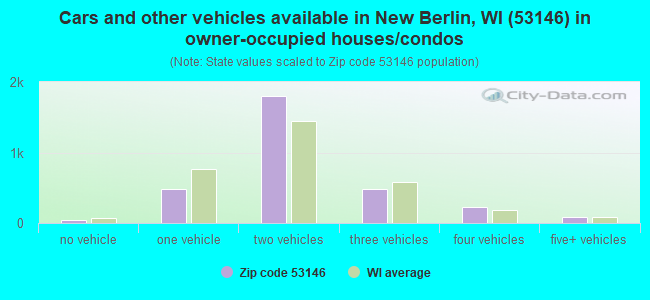
Housing units in zip code 53146 with a mortgage: 1,678 (289 second mortgage, 268 both second mortgage and home equity loan) Houses without a mortgage: 262
Median monthly owner costs for units with a mortgage: $1,802 Median monthly owner costs for units without a mortgage: $650
Residents with income below the poverty level in 2022:
This zip code:
5.1%
Whole state:
10.7%
Residents with income below 50% of the poverty level in 2022:
This zip code:
2.7%
Whole state:
5.7%
Median number of rooms in houses and condos:
Here:
6.7
State:
6.5
Median number of rooms in apartments:
Here:
3.9
State:
4.1
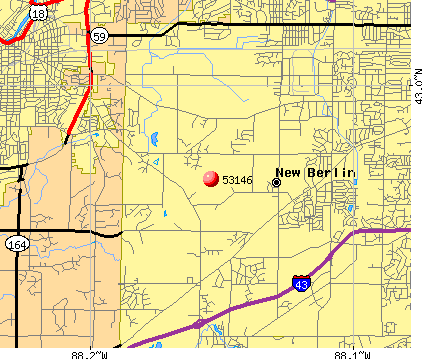
Notable locations in this zip code not listed on our city pages
Notable locations in zip code 53146: Deer Haven Golf Course (A), New Berlin Fire Department Station 3 (B), Shady Acres Perennial Nursery (C). Display/hide their locations on the map
In group quarters: 31 (-1 institutionalized population)
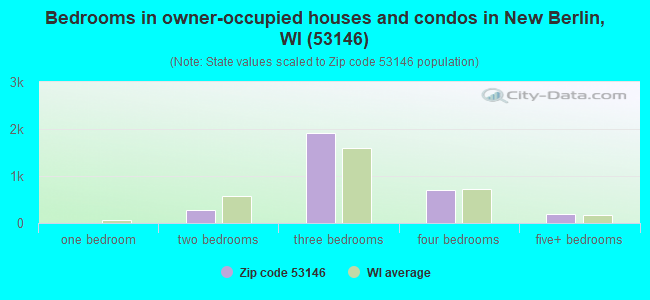
Size of family households: 1,433 2-persons, 317 3-persons, 548 4-persons, 132 5-persons, 11 6-persons, 24 7-or-more-persons
Size of nonfamily households: 635 1-person, 107 2-persons
1,218 married couples with children.
229 single-parent households (12 men, 217 women).
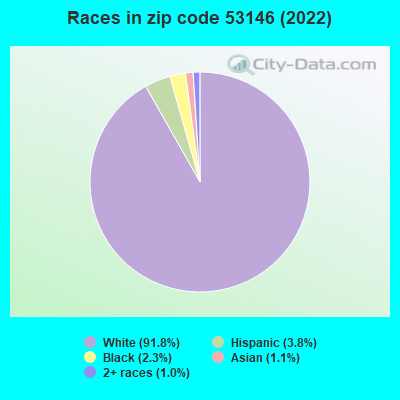
95.6% of residents of 53146 zip code speak English at home.
2.8% of residents speak Spanish at home (79% very well, 21% not well).
1.4% of residents speak other Indo-European language at home (100% very well).
1.0% of residents speak Asian or Pacific Island language at home (35% very well, 65% not well).
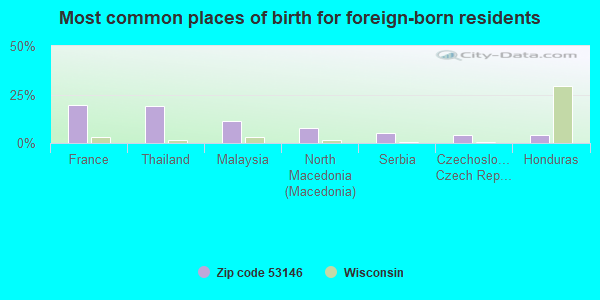
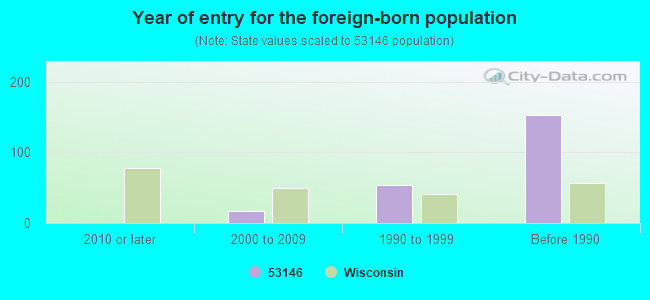
Foreign born population: 221 (2.9%) (91.5% of them are naturalized citizens)
This zip code:
2.9%
Whole state:
5.0%
19%France
19%Thailand
11%Malaysia
8%North Macedonia (Macedonia)
5%Serbia
4%Czechoslovakia (includes Czech Republic and Slovakia)
Facilities with environmental interests located in this zip code:
CLEVELAND HEIGHTS ELEM SCHOOL (17401 W CLEVELAND AVE in NEW BERLIN, WI)
(National Center for Education Statistics) - STATE ID-0040 Conditionally Exempt Small Quantity Generators, less than 100 kg/month of hazardous waste (Resource Conservation and Recovery Act (tracking hazardous waste)) - notification STATE MASTER (Wisconsin database) - RCRAINFO-WID988621199, CESQG Organizations: NEW BERLIN PUBLIC SCHOOL DIST (CONTACT/OWNER)
, NEW BERLIN SCH DIST (SCHOOL DISTRICT)
CALHOUN ELEMENTARY SCHOOL (1500 WEST LN in NEW BERLIN, WI)
Conditionally Exempt Small Quantity Generators, less than 100 kg/month of hazardous waste (Resource Conservation and Recovery Act (tracking hazardous waste)) - notification STATE MASTER (Wisconsin database) - RCRAINFO-WID988621207, CESQG Organizations: NEW BERLIN PUBLIC SCHOOL DIST (CONTACT/OWNER)
ARBY CONST INC (19705 W LINCOLN AVE in NEW BERLIN, WI)
Conditionally Exempt Small Quantity Generators, less than 100 kg/month of hazardous waste (Resource Conservation and Recovery Act (tracking hazardous waste)) STATE MASTER (Wisconsin database) - RCRAINFO-WID988618443, CESQG Business SIC classification: WATER, SEWER, PIPELINE, AND COMMUNICATIONS AND POWER LINE CONSTRUCTION
CALHOUN EL (1500 S WEST LN in NEW BERLIN, WI)
(National Center for Education Statistics) - STATE ID-0020 Organizations: NEW BERLIN SCH DIST (SCHOOL DISTRICT)
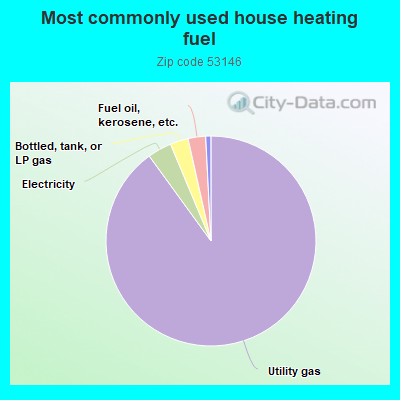
90.0%Utility gas
3.7%Electricity
2.8%Bottled, tank, or LP gas
2.7%Fuel oil, kerosene, etc.
0.8%No fuel used
Population in 1990: 8,149.
Place of birth for U.S.-born residents:
This state: 6,380
Northeast: 37
Midwest: 763
South: 17
West: 314
70% of the 53146 zip code residents lived in the same house 5 years ago. Out of people who lived in different houses, 43% lived in this county. Out of people who lived in different counties, 50% lived in Wisconsin.
94% of the 53146 zip code residents lived in the same house 1 year ago. Out of people who lived in different houses, 16% moved from this county. Out of people who lived in different houses, 74% moved from different county within same state. Out of people who lived in different houses, 17% moved from different state.
Private vs. public school enrollment:
Students in private schools in grades 1 to 8 (elementary and middle school): 49
Here:
10.8%
Wisconsin:
16.7%
Students in private schools in grades 9 to 12 (high school): 74
Here:
11.1%
Wisconsin:
12.5%
Students in private undergraduate colleges: 10
Here:
5.3%
Wisconsin:
17.5%
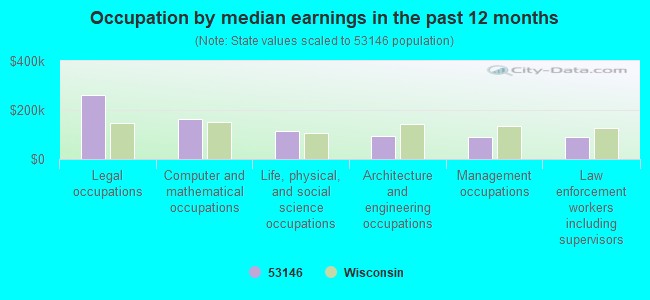
Occupation by median earnings in the past 12 months ($)
259,817Legal occupations
162,772Computer and mathematical occupations
114,589Life, physical, and social science occupations
93,129Architecture and engineering occupations
90,411Management occupations
89,793Law enforcement workers including supervisors
Companies with federal contracts located in this zip code:
UNDERGROUND PIPELINE INC (2180 S SPRINGDALE RD in NEW BERLIN, WI; small business) : $878,971 in 13 contractsfrom 2004 to 2005
Contracts for Miscellaneous Engine Accessories, Nonaircraft, Vehicular Cab, Body, and Frame Structural Components, Vehicular Furniture and Accessories, Engine Cooling System Components, Nonaircraft, and moreby Defense Logistics Agency, Army Signed by year:2000: $0; 2001: $0; 2002: $0; 2003: $0; 2004: $69,452; 2005: $809,519; 2006: $0.
Biggest contracts:
$471,927 with Defense Logistics Agency for Miscellaneous Engine Accessories, Nonaircraft. Signed on 2005-04-06. Completion date: 2005-11-02.
$149,700 with Defense Logistics Agency for Vehicular Cab, Body, and Frame Structural Components. Signed on 2005-03-04. Completion date: 2005-07-02.
$74,347, same as above.Signed on 2005-02-24. Completion date: 2005-05-25.
$70,777 with Defense Logistics Agency for Vehicular Furniture and Accessories. Signed on 2005-02-23. Completion date: 2005-06-23.
Top industries in this zip code by the number of employees in 2005:
Administrative and Support and Waste Management and Remediation Services: Convention and Trade Show Organizers (250-499 employees: 1 establishment)
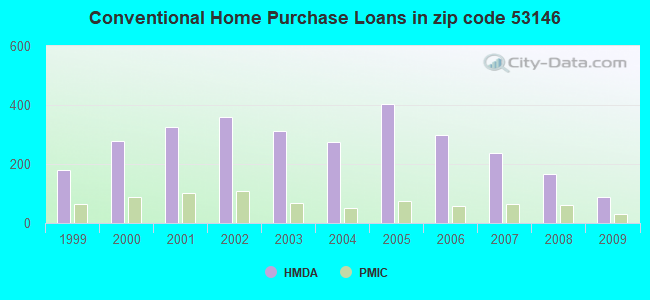
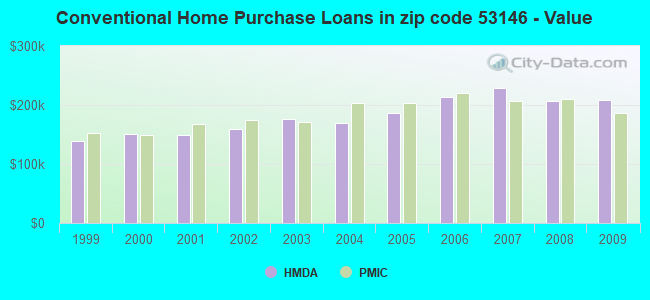
Detailed PMIC statistics for the following Tracts:2013.00
, 2016.00
2004 - 2018 National Fire Incident Reporting System (NFIRS) incidents
Based on the data from the years 2004 - 2018 the average number of fire incidents per year is 19. The highest number of fire incidents - 35 took place in 2015, and the least - 3 in 2006. The data has a rising trend.
When looking into fire subcategories, the most incidents belonged to: Structure Fires (46.3%), and Outside Fires (25.4%).
Fire incident types reported to NFIRS in Zip Code 53146
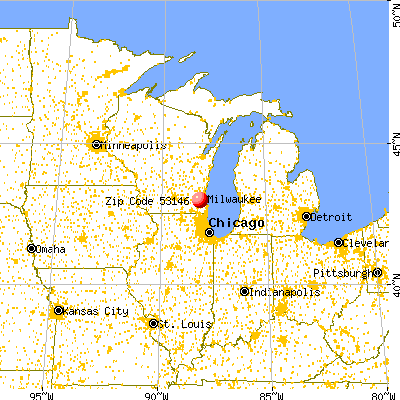


 Nearest zip codes: 53151, 53186, 53045, 53122, 53150, 53005.
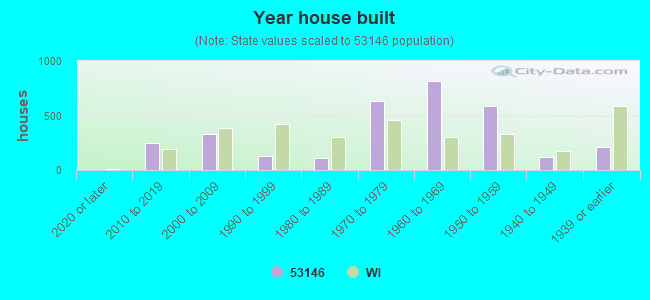


 Based on the data from the years 2004 - 2018 the average number of fire incidents per year is 19. The highest number of fire incidents - 35 took place in 2015, and the least - 3 in 2006. The data has a rising trend.
 When looking into fire subcategories, the most incidents belonged to: Structure Fires (46.3%), and Outside Fires (25.4%).