Muskego, Wisconsin Submit your own pictures of this city and show them to the world
OSM Map
General Map
Google Map
MSN Map
OSM Map
General Map
Google Map
MSN Map
OSM Map
General Map
Google Map
MSN Map
OSM Map
General Map
Google Map
MSN Map
Please wait while loading the map...
Population in 2022: 25,150 (94% urban, 6% rural). Population change since 2000: +17.5%Males: 12,980 Females: 12,170
March 2022 cost of living index in Muskego: 98.4 (near average, U.S. average is 100) Percentage of residents living in poverty in 2022: 2.6%for White Non-Hispanic residents , 2.4% for Hispanic or Latino residents , 13.1% for two or more races residents )
Profiles of local businesses
Business Search - 14 Million verified businesses
Data:
Median household income ($)
Median household income (% change since 2000)
Household income diversity
Ratio of average income to average house value (%)
Ratio of average income to average rent
Median household income ($) - White
Median household income ($) - Black or African American
Median household income ($) - Asian
Median household income ($) - Hispanic or Latino
Median household income ($) - American Indian and Alaska Native
Median household income ($) - Multirace
Median household income ($) - Other Race
Median household income for houses/condos with a mortgage ($)
Median household income for apartments without a mortgage ($)
Races - White alone (%)
Races - White alone (% change since 2000)
Races - Black alone (%)
Races - Black alone (% change since 2000)
Races - American Indian alone (%)
Races - American Indian alone (% change since 2000)
Races - Asian alone (%)
Races - Asian alone (% change since 2000)
Races - Hispanic (%)
Races - Hispanic (% change since 2000)
Races - Native Hawaiian and Other Pacific Islander alone (%)
Races - Native Hawaiian and Other Pacific Islander alone (% change since 2000)
Races - Two or more races (%)
Races - Two or more races (% change since 2000)
Races - Other race alone (%)
Races - Other race alone (% change since 2000)
Racial diversity
Unemployment (%)
Unemployment (% change since 2000)
Unemployment (%) - White
Unemployment (%) - Black or African American
Unemployment (%) - Asian
Unemployment (%) - Hispanic or Latino
Unemployment (%) - American Indian and Alaska Native
Unemployment (%) - Multirace
Unemployment (%) - Other Race
Population density (people per square mile)
Population - Males (%)
Population - Females (%)
Population - Males (%) - White
Population - Males (%) - Black or African American
Population - Males (%) - Asian
Population - Males (%) - Hispanic or Latino
Population - Males (%) - American Indian and Alaska Native
Population - Males (%) - Multirace
Population - Males (%) - Other Race
Population - Females (%) - White
Population - Females (%) - Black or African American
Population - Females (%) - Asian
Population - Females (%) - Hispanic or Latino
Population - Females (%) - American Indian and Alaska Native
Population - Females (%) - Multirace
Population - Females (%) - Other Race
Coronavirus confirmed cases (Apr 27, 2024)
Deaths caused by coronavirus (Apr 27, 2024)
Coronavirus confirmed cases (per 100k population) (Apr 27, 2024)
Deaths caused by coronavirus (per 100k population) (Apr 27, 2024)
Daily increase in number of cases (Apr 27, 2024)
Weekly increase in number of cases (Apr 27, 2024)
Cases doubled (in days) (Apr 27, 2024)
Hospitalized patients (Apr 18, 2022)
Negative test results (Apr 18, 2022)
Total test results (Apr 18, 2022)
COVID Vaccine doses distributed (per 100k population) (Sep 19, 2023)
COVID Vaccine doses administered (per 100k population) (Sep 19, 2023)
COVID Vaccine doses distributed (Sep 19, 2023)
COVID Vaccine doses administered (Sep 19, 2023)
Likely homosexual households (%)
Likely homosexual households (% change since 2000)
Likely homosexual households - Lesbian couples (%)
Likely homosexual households - Lesbian couples (% change since 2000)
Likely homosexual households - Gay men (%)
Likely homosexual households - Gay men (% change since 2000)
Cost of living index
Median gross rent ($)
Median contract rent ($)
Median monthly housing costs ($)
Median house or condo value ($)
Median house or condo value ($ change since 2000)
Mean house or condo value by units in structure - 1, detached ($)
Mean house or condo value by units in structure - 1, attached ($)
Mean house or condo value by units in structure - 2 ($)
Mean house or condo value by units in structure by units in structure - 3 or 4 ($)
Mean house or condo value by units in structure - 5 or more ($)
Mean house or condo value by units in structure - Boat, RV, van, etc. ($)
Mean house or condo value by units in structure - Mobile home ($)
Median house or condo value ($) - White
Median house or condo value ($) - Black or African American
Median house or condo value ($) - Asian
Median house or condo value ($) - Hispanic or Latino
Median house or condo value ($) - American Indian and Alaska Native
Median house or condo value ($) - Multirace
Median house or condo value ($) - Other Race
Median resident age
Resident age diversity
Median resident age - Males
Median resident age - Females
Median resident age - White
Median resident age - Black or African American
Median resident age - Asian
Median resident age - Hispanic or Latino
Median resident age - American Indian and Alaska Native
Median resident age - Multirace
Median resident age - Other Race
Median resident age - Males - White
Median resident age - Males - Black or African American
Median resident age - Males - Asian
Median resident age - Males - Hispanic or Latino
Median resident age - Males - American Indian and Alaska Native
Median resident age - Males - Multirace
Median resident age - Males - Other Race
Median resident age - Females - White
Median resident age - Females - Black or African American
Median resident age - Females - Asian
Median resident age - Females - Hispanic or Latino
Median resident age - Females - American Indian and Alaska Native
Median resident age - Females - Multirace
Median resident age - Females - Other Race
Commute - mean travel time to work (minutes)
Travel time to work - Less than 5 minutes (%)
Travel time to work - Less than 5 minutes (% change since 2000)
Travel time to work - 5 to 9 minutes (%)
Travel time to work - 5 to 9 minutes (% change since 2000)
Travel time to work - 10 to 19 minutes (%)
Travel time to work - 10 to 19 minutes (% change since 2000)
Travel time to work - 20 to 29 minutes (%)
Travel time to work - 20 to 29 minutes (% change since 2000)
Travel time to work - 30 to 39 minutes (%)
Travel time to work - 30 to 39 minutes (% change since 2000)
Travel time to work - 40 to 59 minutes (%)
Travel time to work - 40 to 59 minutes (% change since 2000)
Travel time to work - 60 to 89 minutes (%)
Travel time to work - 60 to 89 minutes (% change since 2000)
Travel time to work - 90 or more minutes (%)
Travel time to work - 90 or more minutes (% change since 2000)
Marital status - Never married (%)
Marital status - Now married (%)
Marital status - Separated (%)
Marital status - Widowed (%)
Marital status - Divorced (%)
Median family income ($)
Median family income (% change since 2000)
Median non-family income ($)
Median non-family income (% change since 2000)
Median per capita income ($)
Median per capita income (% change since 2000)
Median family income ($) - White
Median family income ($) - Black or African American
Median family income ($) - Asian
Median family income ($) - Hispanic or Latino
Median family income ($) - American Indian and Alaska Native
Median family income ($) - Multirace
Median family income ($) - Other Race
Median year house/condo built
Median year apartment built
Year house built - Built 2005 or later (%)
Year house built - Built 2000 to 2004 (%)
Year house built - Built 1990 to 1999 (%)
Year house built - Built 1980 to 1989 (%)
Year house built - Built 1970 to 1979 (%)
Year house built - Built 1960 to 1969 (%)
Year house built - Built 1950 to 1959 (%)
Year house built - Built 1940 to 1949 (%)
Year house built - Built 1939 or earlier (%)
Average household size
Household density (households per square mile)
Average household size - White
Average household size - Black or African American
Average household size - Asian
Average household size - Hispanic or Latino
Average household size - American Indian and Alaska Native
Average household size - Multirace
Average household size - Other Race
Occupied housing units (%)
Vacant housing units (%)
Owner occupied housing units (%)
Renter occupied housing units (%)
Vacancy status - For rent (%)
Vacancy status - For sale only (%)
Vacancy status - Rented or sold, not occupied (%)
Vacancy status - For seasonal, recreational, or occasional use (%)
Vacancy status - For migrant workers (%)
Vacancy status - Other vacant (%)
Residents with income below the poverty level (%)
Residents with income below 50% of the poverty level (%)
Children below poverty level (%)
Poor families by family type - Married-couple family (%)
Poor families by family type - Male, no wife present (%)
Poor families by family type - Female, no husband present (%)
Poverty status for native-born residents (%)
Poverty status for foreign-born residents (%)
Poverty among high school graduates not in families (%)
Poverty among people who did not graduate high school not in families (%)
Residents with income below the poverty level (%) - White
Residents with income below the poverty level (%) - Black or African American
Residents with income below the poverty level (%) - Asian
Residents with income below the poverty level (%) - Hispanic or Latino
Residents with income below the poverty level (%) - American Indian and Alaska Native
Residents with income below the poverty level (%) - Multirace
Residents with income below the poverty level (%) - Other Race
Air pollution - Air Quality Index (AQI)
Air pollution - CO
Air pollution - NO2
Air pollution - SO2
Air pollution - Ozone
Air pollution - PM10
Air pollution - PM25
Air pollution - Pb
Crime - Murders per 100,000 population
Crime - Rapes per 100,000 population
Crime - Robberies per 100,000 population
Crime - Assaults per 100,000 population
Crime - Burglaries per 100,000 population
Crime - Thefts per 100,000 population
Crime - Auto thefts per 100,000 population
Crime - Arson per 100,000 population
Crime - City-data.com crime index
Crime - Violent crime index
Crime - Property crime index
Crime - Murders per 100,000 population (5 year average)
Crime - Rapes per 100,000 population (5 year average)
Crime - Robberies per 100,000 population (5 year average)
Crime - Assaults per 100,000 population (5 year average)
Crime - Burglaries per 100,000 population (5 year average)
Crime - Thefts per 100,000 population (5 year average)
Crime - Auto thefts per 100,000 population (5 year average)
Crime - Arson per 100,000 population (5 year average)
Crime - City-data.com crime index (5 year average)
Crime - Violent crime index (5 year average)
Crime - Property crime index (5 year average)
1996 Presidential Elections Results (%) - Democratic Party (Clinton)
1996 Presidential Elections Results (%) - Republican Party (Dole)
1996 Presidential Elections Results (%) - Other
2000 Presidential Elections Results (%) - Democratic Party (Gore)
2000 Presidential Elections Results (%) - Republican Party (Bush)
2000 Presidential Elections Results (%) - Other
2004 Presidential Elections Results (%) - Democratic Party (Kerry)
2004 Presidential Elections Results (%) - Republican Party (Bush)
2004 Presidential Elections Results (%) - Other
2008 Presidential Elections Results (%) - Democratic Party (Obama)
2008 Presidential Elections Results (%) - Republican Party (McCain)
2008 Presidential Elections Results (%) - Other
2012 Presidential Elections Results (%) - Democratic Party (Obama)
2012 Presidential Elections Results (%) - Republican Party (Romney)
2012 Presidential Elections Results (%) - Other
2016 Presidential Elections Results (%) - Democratic Party (Clinton)
2016 Presidential Elections Results (%) - Republican Party (Trump)
2016 Presidential Elections Results (%) - Other
2020 Presidential Elections Results (%) - Democratic Party (Biden)
2020 Presidential Elections Results (%) - Republican Party (Trump)
2020 Presidential Elections Results (%) - Other
Ancestries Reported - Arab (%)
Ancestries Reported - Czech (%)
Ancestries Reported - Danish (%)
Ancestries Reported - Dutch (%)
Ancestries Reported - English (%)
Ancestries Reported - French (%)
Ancestries Reported - French Canadian (%)
Ancestries Reported - German (%)
Ancestries Reported - Greek (%)
Ancestries Reported - Hungarian (%)
Ancestries Reported - Irish (%)
Ancestries Reported - Italian (%)
Ancestries Reported - Lithuanian (%)
Ancestries Reported - Norwegian (%)
Ancestries Reported - Polish (%)
Ancestries Reported - Portuguese (%)
Ancestries Reported - Russian (%)
Ancestries Reported - Scotch-Irish (%)
Ancestries Reported - Scottish (%)
Ancestries Reported - Slovak (%)
Ancestries Reported - Subsaharan African (%)
Ancestries Reported - Swedish (%)
Ancestries Reported - Swiss (%)
Ancestries Reported - Ukrainian (%)
Ancestries Reported - United States (%)
Ancestries Reported - Welsh (%)
Ancestries Reported - West Indian (%)
Ancestries Reported - Other (%)
Educational Attainment - No schooling completed (%)
Educational Attainment - Less than high school (%)
Educational Attainment - High school or equivalent (%)
Educational Attainment - Less than 1 year of college (%)
Educational Attainment - 1 or more years of college (%)
Educational Attainment - Associate degree (%)
Educational Attainment - Bachelor's degree (%)
Educational Attainment - Master's degree (%)
Educational Attainment - Professional school degree (%)
Educational Attainment - Doctorate degree (%)
School Enrollment - Nursery, preschool (%)
School Enrollment - Kindergarten (%)
School Enrollment - Grade 1 to 4 (%)
School Enrollment - Grade 5 to 8 (%)
School Enrollment - Grade 9 to 12 (%)
School Enrollment - College undergrad (%)
School Enrollment - Graduate or professional (%)
School Enrollment - Not enrolled in school (%)
School enrollment - Public schools (%)
School enrollment - Private schools (%)
School enrollment - Not enrolled (%)
Median number of rooms in houses and condos
Median number of rooms in apartments
Housing units lacking complete plumbing facilities (%)
Housing units lacking complete kitchen facilities (%)
Density of houses
Urban houses (%)
Rural houses (%)
Households with people 60 years and over (%)
Households with people 65 years and over (%)
Households with people 75 years and over (%)
Households with one or more nonrelatives (%)
Households with no nonrelatives (%)
Population in households (%)
Family households (%)
Nonfamily households (%)
Population in families (%)
Family households with own children (%)
Median number of bedrooms in owner occupied houses
Mean number of bedrooms in owner occupied houses
Median number of bedrooms in renter occupied houses
Mean number of bedrooms in renter occupied houses
Median number of vehichles in owner occupied houses
Mean number of vehichles in owner occupied houses
Median number of vehichles in renter occupied houses
Mean number of vehichles in renter occupied houses
Mortgage status - with mortgage (%)
Mortgage status - with second mortgage (%)
Mortgage status - with home equity loan (%)
Mortgage status - with both second mortgage and home equity loan (%)
Mortgage status - without a mortgage (%)
Average family size
Average family size - White
Average family size - Black or African American
Average family size - Asian
Average family size - Hispanic or Latino
Average family size - American Indian and Alaska Native
Average family size - Multirace
Average family size - Other Race
Geographical mobility - Same house 1 year ago (%)
Geographical mobility - Moved within same county (%)
Geographical mobility - Moved from different county within same state (%)
Geographical mobility - Moved from different state (%)
Geographical mobility - Moved from abroad (%)
Place of birth - Born in state of residence (%)
Place of birth - Born in other state (%)
Place of birth - Native, outside of US (%)
Place of birth - Foreign born (%)
Housing units in structures - 1, detached (%)
Housing units in structures - 1, attached (%)
Housing units in structures - 2 (%)
Housing units in structures - 3 or 4 (%)
Housing units in structures - 5 to 9 (%)
Housing units in structures - 10 to 19 (%)
Housing units in structures - 20 to 49 (%)
Housing units in structures - 50 or more (%)
Housing units in structures - Mobile home (%)
Housing units in structures - Boat, RV, van, etc. (%)
House/condo owner moved in on average (years ago)
Renter moved in on average (years ago)
Year householder moved into unit - Moved in 1999 to March 2000 (%)
Year householder moved into unit - Moved in 1995 to 1998 (%)
Year householder moved into unit - Moved in 1990 to 1994 (%)
Year householder moved into unit - Moved in 1980 to 1989 (%)
Year householder moved into unit - Moved in 1970 to 1979 (%)
Year householder moved into unit - Moved in 1969 or earlier (%)
Means of transportation to work - Drove car alone (%)
Means of transportation to work - Carpooled (%)
Means of transportation to work - Public transportation (%)
Means of transportation to work - Bus or trolley bus (%)
Means of transportation to work - Streetcar or trolley car (%)
Means of transportation to work - Subway or elevated (%)
Means of transportation to work - Railroad (%)
Means of transportation to work - Ferryboat (%)
Means of transportation to work - Taxicab (%)
Means of transportation to work - Motorcycle (%)
Means of transportation to work - Bicycle (%)
Means of transportation to work - Walked (%)
Means of transportation to work - Other means (%)
Working at home (%)
Industry diversity
Most Common Industries - Agriculture, forestry, fishing and hunting, and mining (%)
Most Common Industries - Agriculture, forestry, fishing and hunting (%)
Most Common Industries - Mining, quarrying, and oil and gas extraction (%)
Most Common Industries - Construction (%)
Most Common Industries - Manufacturing (%)
Most Common Industries - Wholesale trade (%)
Most Common Industries - Retail trade (%)
Most Common Industries - Transportation and warehousing, and utilities (%)
Most Common Industries - Transportation and warehousing (%)
Most Common Industries - Utilities (%)
Most Common Industries - Information (%)
Most Common Industries - Finance and insurance, and real estate and rental and leasing (%)
Most Common Industries - Finance and insurance (%)
Most Common Industries - Real estate and rental and leasing (%)
Most Common Industries - Professional, scientific, and management, and administrative and waste management services (%)
Most Common Industries - Professional, scientific, and technical services (%)
Most Common Industries - Management of companies and enterprises (%)
Most Common Industries - Administrative and support and waste management services (%)
Most Common Industries - Educational services, and health care and social assistance (%)
Most Common Industries - Educational services (%)
Most Common Industries - Health care and social assistance (%)
Most Common Industries - Arts, entertainment, and recreation, and accommodation and food services (%)
Most Common Industries - Arts, entertainment, and recreation (%)
Most Common Industries - Accommodation and food services (%)
Most Common Industries - Other services, except public administration (%)
Most Common Industries - Public administration (%)
Occupation diversity
Most Common Occupations - Management, business, science, and arts occupations (%)
Most Common Occupations - Management, business, and financial occupations (%)
Most Common Occupations - Management occupations (%)
Most Common Occupations - Business and financial operations occupations (%)
Most Common Occupations - Computer, engineering, and science occupations (%)
Most Common Occupations - Computer and mathematical occupations (%)
Most Common Occupations - Architecture and engineering occupations (%)
Most Common Occupations - Life, physical, and social science occupations (%)
Most Common Occupations - Education, legal, community service, arts, and media occupations (%)
Most Common Occupations - Community and social service occupations (%)
Most Common Occupations - Legal occupations (%)
Most Common Occupations - Education, training, and library occupations (%)
Most Common Occupations - Arts, design, entertainment, sports, and media occupations (%)
Most Common Occupations - Healthcare practitioners and technical occupations (%)
Most Common Occupations - Health diagnosing and treating practitioners and other technical occupations (%)
Most Common Occupations - Health technologists and technicians (%)
Most Common Occupations - Service occupations (%)
Most Common Occupations - Healthcare support occupations (%)
Most Common Occupations - Protective service occupations (%)
Most Common Occupations - Fire fighting and prevention, and other protective service workers including supervisors (%)
Most Common Occupations - Law enforcement workers including supervisors (%)
Most Common Occupations - Food preparation and serving related occupations (%)
Most Common Occupations - Building and grounds cleaning and maintenance occupations (%)
Most Common Occupations - Personal care and service occupations (%)
Most Common Occupations - Sales and office occupations (%)
Most Common Occupations - Sales and related occupations (%)
Most Common Occupations - Office and administrative support occupations (%)
Most Common Occupations - Natural resources, construction, and maintenance occupations (%)
Most Common Occupations - Farming, fishing, and forestry occupations (%)
Most Common Occupations - Construction and extraction occupations (%)
Most Common Occupations - Installation, maintenance, and repair occupations (%)
Most Common Occupations - Production, transportation, and material moving occupations (%)
Most Common Occupations - Production occupations (%)
Most Common Occupations - Transportation occupations (%)
Most Common Occupations - Material moving occupations (%)
People in Group quarters - Institutionalized population (%)
People in Group quarters - Correctional institutions (%)
People in Group quarters - Federal prisons and detention centers (%)
People in Group quarters - Halfway houses (%)
People in Group quarters - Local jails and other confinement facilities (including police lockups) (%)
People in Group quarters - Military disciplinary barracks (%)
People in Group quarters - State prisons (%)
People in Group quarters - Other types of correctional institutions (%)
People in Group quarters - Nursing homes (%)
People in Group quarters - Hospitals/wards, hospices, and schools for the handicapped (%)
People in Group quarters - Hospitals/wards and hospices for chronically ill (%)
People in Group quarters - Hospices or homes for chronically ill (%)
People in Group quarters - Military hospitals or wards for chronically ill (%)
People in Group quarters - Other hospitals or wards for chronically ill (%)
People in Group quarters - Hospitals or wards for drug/alcohol abuse (%)
People in Group quarters - Mental (Psychiatric) hospitals or wards (%)
People in Group quarters - Schools, hospitals, or wards for the mentally retarded (%)
People in Group quarters - Schools, hospitals, or wards for the physically handicapped (%)
People in Group quarters - Institutions for the deaf (%)
People in Group quarters - Institutions for the blind (%)
People in Group quarters - Orthopedic wards and institutions for the physically handicapped (%)
People in Group quarters - Wards in general hospitals for patients who have no usual home elsewhere (%)
People in Group quarters - Wards in military hospitals for patients who have no usual home elsewhere (%)
People in Group quarters - Juvenile institutions (%)
People in Group quarters - Long-term care (%)
People in Group quarters - Homes for abused, dependent, and neglected children (%)
People in Group quarters - Residential treatment centers for emotionally disturbed children (%)
People in Group quarters - Training schools for juvenile delinquents (%)
People in Group quarters - Short-term care, detention or diagnostic centers for delinquent children (%)
People in Group quarters - Type of juvenile institution unknown (%)
People in Group quarters - Noninstitutionalized population (%)
People in Group quarters - College dormitories (includes college quarters off campus) (%)
People in Group quarters - Military quarters (%)
People in Group quarters - On base (%)
People in Group quarters - Barracks, unaccompanied personnel housing (UPH), (Enlisted/Officer), ;and similar group living quarters for military personnel (%)
People in Group quarters - Transient quarters for temporary residents (%)
People in Group quarters - Military ships (%)
People in Group quarters - Group homes (%)
People in Group quarters - Homes or halfway houses for drug/alcohol abuse (%)
People in Group quarters - Homes for the mentally ill (%)
People in Group quarters - Homes for the mentally retarded (%)
People in Group quarters - Homes for the physically handicapped (%)
People in Group quarters - Other group homes (%)
People in Group quarters - Religious group quarters (%)
People in Group quarters - Dormitories (%)
People in Group quarters - Agriculture workers' dormitories on farms (%)
People in Group quarters - Job Corps and vocational training facilities (%)
People in Group quarters - Other workers' dormitories (%)
People in Group quarters - Crews of maritime vessels (%)
People in Group quarters - Other nonhousehold living situations (%)
People in Group quarters - Other noninstitutional group quarters (%)
Residents speaking English at home (%)
Residents speaking English at home - Born in the United States (%)
Residents speaking English at home - Native, born elsewhere (%)
Residents speaking English at home - Foreign born (%)
Residents speaking Spanish at home (%)
Residents speaking Spanish at home - Born in the United States (%)
Residents speaking Spanish at home - Native, born elsewhere (%)
Residents speaking Spanish at home - Foreign born (%)
Residents speaking other language at home (%)
Residents speaking other language at home - Born in the United States (%)
Residents speaking other language at home - Native, born elsewhere (%)
Residents speaking other language at home - Foreign born (%)
Class of Workers - Employee of private company (%)
Class of Workers - Self-employed in own incorporated business (%)
Class of Workers - Private not-for-profit wage and salary workers (%)
Class of Workers - Local government workers (%)
Class of Workers - State government workers (%)
Class of Workers - Federal government workers (%)
Class of Workers - Self-employed workers in own not incorporated business and Unpaid family workers (%)
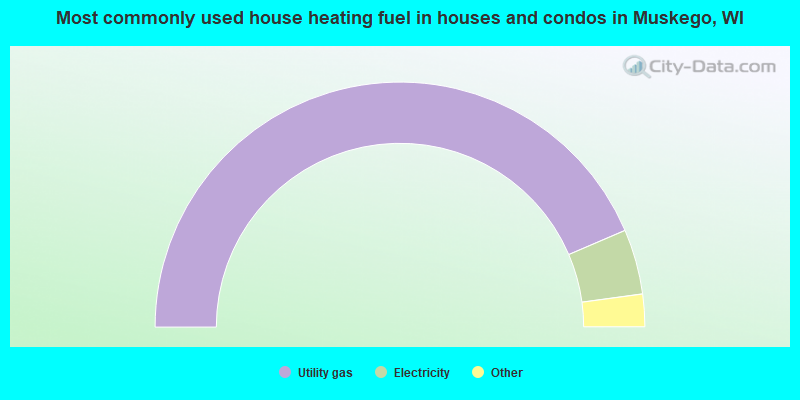
House heating fuel used in houses and condos - Utility gas (%)
House heating fuel used in houses and condos - Bottled, tank, or LP gas (%)
House heating fuel used in houses and condos - Electricity (%)
House heating fuel used in houses and condos - Fuel oil, kerosene, etc. (%)
House heating fuel used in houses and condos - Coal or coke (%)
House heating fuel used in houses and condos - Wood (%)
House heating fuel used in houses and condos - Solar energy (%)
House heating fuel used in houses and condos - Other fuel (%)
House heating fuel used in houses and condos - No fuel used (%)
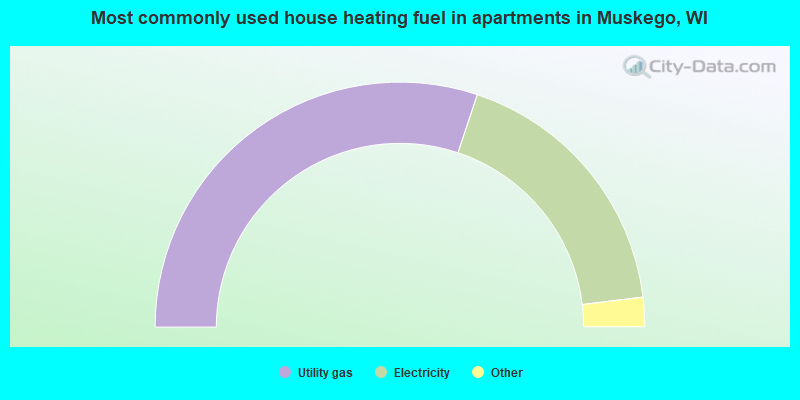
House heating fuel used in apartments - Utility gas (%)
House heating fuel used in apartments - Bottled, tank, or LP gas (%)
House heating fuel used in apartments - Electricity (%)
House heating fuel used in apartments - Fuel oil, kerosene, etc. (%)
House heating fuel used in apartments - Coal or coke (%)
House heating fuel used in apartments - Wood (%)
House heating fuel used in apartments - Solar energy (%)
House heating fuel used in apartments - Other fuel (%)
House heating fuel used in apartments - No fuel used (%)
Armed forces status - In Armed Forces (%)
Armed forces status - Civilian (%)
Armed forces status - Civilian - Veteran (%)
Armed forces status - Civilian - Nonveteran (%)
Fatal accidents locations in years 2005-2021
Fatal accidents locations in 2005
Fatal accidents locations in 2006
Fatal accidents locations in 2007
Fatal accidents locations in 2008
Fatal accidents locations in 2009
Fatal accidents locations in 2010
Fatal accidents locations in 2011
Fatal accidents locations in 2012
Fatal accidents locations in 2013
Fatal accidents locations in 2014
Fatal accidents locations in 2015
Fatal accidents locations in 2016
Fatal accidents locations in 2017
Fatal accidents locations in 2018
Fatal accidents locations in 2019
Fatal accidents locations in 2020
Fatal accidents locations in 2021
Alcohol use - People drinking some alcohol every month (%)
Alcohol use - People not drinking at all (%)
Alcohol use - Average days/month drinking alcohol
Alcohol use - Average drinks/week
Alcohol use - Average days/year people drink much
Audiometry - Average condition of hearing (%)
Audiometry - People that can hear a whisper from across a quiet room (%)
Audiometry - People that can hear normal voice from across a quiet room (%)
Audiometry - Ears ringing, roaring, buzzing (%)
Audiometry - Had a job exposure to loud noise (%)
Audiometry - Had off-work exposure to loud noise (%)
Blood Pressure & Cholesterol - Has high blood pressure (%)
Blood Pressure & Cholesterol - Checking blood pressure at home (%)
Blood Pressure & Cholesterol - Frequently checking blood cholesterol (%)
Blood Pressure & Cholesterol - Has high cholesterol level (%)
Consumer Behavior - Money monthly spent on food at supermarket/grocery store
Consumer Behavior - Money monthly spent on food at other stores
Consumer Behavior - Money monthly spent on eating out
Consumer Behavior - Money monthly spent on carryout/delivered foods
Consumer Behavior - Income spent on food at supermarket/grocery store (%)
Consumer Behavior - Income spent on food at other stores (%)
Consumer Behavior - Income spent on eating out (%)
Consumer Behavior - Income spent on carryout/delivered foods (%)
Current Health Status - General health condition (%)
Current Health Status - Blood donors (%)
Current Health Status - Has blood ever tested for HIV virus (%)
Current Health Status - Left-handed people (%)
Dermatology - People using sunscreen (%)
Diabetes - Diabetics (%)
Diabetes - Had a blood test for high blood sugar (%)
Diabetes - People taking insulin (%)
Diet Behavior & Nutrition - Diet health (%)
Diet Behavior & Nutrition - Milk product consumption (# of products/month)
Diet Behavior & Nutrition - Meals not home prepared (#/week)
Diet Behavior & Nutrition - Meals from fast food or pizza place (#/week)
Diet Behavior & Nutrition - Ready-to-eat foods (#/month)
Diet Behavior & Nutrition - Frozen meals/pizza (#/month)
Drug Use - People that ever used marijuana or hashish (%)
Drug Use - Ever used hard drugs (%)
Drug Use - Ever used any form of cocaine (%)
Drug Use - Ever used heroin (%)
Drug Use - Ever used methamphetamine (%)
Health Insurance - People covered by health insurance (%)
Kidney Conditions-Urology - Avg. # of times urinating at night
Medical Conditions - People with asthma (%)
Medical Conditions - People with anemia (%)
Medical Conditions - People with psoriasis (%)
Medical Conditions - People with overweight (%)
Medical Conditions - Elderly people having difficulties in thinking or remembering (%)
Medical Conditions - People who ever received blood transfusion (%)
Medical Conditions - People having trouble seeing even with glass/contacts (%)
Medical Conditions - People with arthritis (%)
Medical Conditions - People with gout (%)
Medical Conditions - People with congestive heart failure (%)
Medical Conditions - People with coronary heart disease (%)
Medical Conditions - People with angina pectoris (%)
Medical Conditions - People who ever had heart attack (%)
Medical Conditions - People who ever had stroke (%)
Medical Conditions - People with emphysema (%)
Medical Conditions - People with thyroid problem (%)
Medical Conditions - People with chronic bronchitis (%)
Medical Conditions - People with any liver condition (%)
Medical Conditions - People who ever had cancer or malignancy (%)
Mental Health - People who have little interest in doing things (%)
Mental Health - People feeling down, depressed, or hopeless (%)
Mental Health - People who have trouble sleeping or sleeping too much (%)
Mental Health - People feeling tired or having little energy (%)
Mental Health - People with poor appetite or overeating (%)
Mental Health - People feeling bad about themself (%)
Mental Health - People who have trouble concentrating on things (%)
Mental Health - People moving or speaking slowly or too fast (%)
Mental Health - People having thoughts they would be better off dead (%)
Oral Health - Average years since last visit a dentist
Oral Health - People embarrassed because of mouth (%)
Oral Health - People with gum disease (%)
Oral Health - General health of teeth and gums (%)
Oral Health - Average days a week using dental floss/device
Oral Health - Average days a week using mouthwash for dental problem
Oral Health - Average number of teeth
Pesticide Use - Households using pesticides to control insects (%)
Pesticide Use - Households using pesticides to kill weeds (%)
Physical Activity - People doing vigorous-intensity work activities (%)
Physical Activity - People doing moderate-intensity work activities (%)
Physical Activity - People walking or bicycling (%)
Physical Activity - People doing vigorous-intensity recreational activities (%)
Physical Activity - People doing moderate-intensity recreational activities (%)
Physical Activity - Average hours a day doing sedentary activities
Physical Activity - Average hours a day watching TV or videos
Physical Activity - Average hours a day using computer
Physical Functioning - People having limitations keeping them from working (%)
Physical Functioning - People limited in amount of work they can do (%)
Physical Functioning - People that need special equipment to walk (%)
Physical Functioning - People experiencing confusion/memory problems (%)
Physical Functioning - People requiring special healthcare equipment (%)
Prescription Medications - Average number of prescription medicines taking
Preventive Aspirin Use - Adults 40+ taking low-dose aspirin (%)
Reproductive Health - Vaginal deliveries (%)
Reproductive Health - Cesarean deliveries (%)
Reproductive Health - Deliveries resulted in a live birth (%)
Reproductive Health - Pregnancies resulted in a delivery (%)
Reproductive Health - Women breastfeeding newborns (%)
Reproductive Health - Women that had a hysterectomy (%)
Reproductive Health - Women that had both ovaries removed (%)
Reproductive Health - Women that have ever taken birth control pills (%)
Reproductive Health - Women taking birth control pills (%)
Reproductive Health - Women that have ever used Depo-Provera or injectables (%)
Reproductive Health - Women that have ever used female hormones (%)
Sexual Behavior - People 18+ that ever had sex (vaginal, anal, or oral) (%)
Sexual Behavior - Males 18+ that ever had vaginal sex with a woman (%)
Sexual Behavior - Males 18+ that ever performed oral sex on a woman (%)
Sexual Behavior - Males 18+ that ever had anal sex with a woman (%)
Sexual Behavior - Males 18+ that ever had any sex with a man (%)
Sexual Behavior - Females 18+ that ever had vaginal sex with a man (%)
Sexual Behavior - Females 18+ that ever performed oral sex on a man (%)
Sexual Behavior - Females 18+ that ever had anal sex with a man (%)
Sexual Behavior - Females 18+ that ever had any kind of sex with a woman (%)
Sexual Behavior - Average age people first had sex
Sexual Behavior - Average number of female sex partners in lifetime (males 18+)
Sexual Behavior - Average number of female vaginal sex partners in lifetime (males 18+)
Sexual Behavior - Average age people first performed oral sex on a woman (18+)
Sexual Behavior - Average number of woman performed oral sex on in lifetime (18+)
Sexual Behavior - Average number of male sex partners in lifetime (males 18+)
Sexual Behavior - Average number of male anal sex partners in lifetime (males 18+)
Sexual Behavior - Average age people first performed oral sex on a man (18+)
Sexual Behavior - Average number of male oral sex partners in lifetime (18+)
Sexual Behavior - People using protection when performing oral sex (%)
Sexual Behavior - Average number of times people have vaginal or anal sex a year
Sexual Behavior - People having sex without condom (%)
Sexual Behavior - Average number of male sex partners in lifetime (females 18+)
Sexual Behavior - Average number of male vaginal sex partners in lifetime (females 18+)
Sexual Behavior - Average number of female sex partners in lifetime (females 18+)
Sexual Behavior - Circumcised males 18+ (%)
Sleep Disorders - Average hours sleeping at night
Sleep Disorders - People that has trouble sleeping (%)
Smoking-Cigarette Use - People smoking cigarettes (%)
Taste & Smell - People 40+ having problems with smell (%)
Taste & Smell - People 40+ having problems with taste (%)
Taste & Smell - People 40+ that ever had wisdom teeth removed (%)
Taste & Smell - People 40+ that ever had tonsils teeth removed (%)
Taste & Smell - People 40+ that ever had a loss of consciousness because of a head injury (%)
Taste & Smell - People 40+ that ever had a broken nose or other serious injury to face or skull (%)
Taste & Smell - People 40+ that ever had two or more sinus infections (%)
Weight - Average height (inches)
Weight - Average weight (pounds)
Weight - Average BMI
Weight - People that are obese (%)
Weight - People that ever were obese (%)
Weight - People trying to lose weight (%)
According to our research of Wisconsin and other state lists, there were 7 registered sex offenders living in Muskego, Wisconsin as of April 27, 2024 . The ratio of all residents to sex offenders in Muskego is 3,536 to 1.The ratio of registered sex offenders to all residents in this city is much lower than the state average.
Officers per 1,000 residents here:
1.53Wisconsin average:
2.07
Latest news from Muskego, WI collected exclusively by city-data.com from local newspapers, TV, and radio stations
Ancestries: German (38.7%), Polish (15.1%), Irish (6.5%), American (5.9%), Italian (3.5%), Serbian (3.0%).
Current Local Time:
Land area: 31.2 square miles.
Population density: 805 people per square mile (low).
789 residents are foreign born (1.6% Europe , 0.9% Asia , 0.6% Latin America ).
This city:
3.1%Wisconsin:
5.0%
Median real estate property taxes paid for housing units with mortgages in 2022: $4,265 (1.0%)Median real estate property taxes paid for housing units with no mortgage in 2022: $4,262 (1.1%)
Nearest city with pop. 50,000+: West Allis, WI
Nearest city with pop. 200,000+: Milwaukee, WI
Nearest city with pop. 1,000,000+: Chicago, IL
Nearest cities:
Latitude: 42.90 N, Longitude: 88.12 W
Daytime population change due to commuting: -5,186 (-20.5%)Workers who live and work in this city: 3,797 (28.0%)
Single-family new house construction building permits:
2022: 31 buildings , average cost: $566,6002021: 32 buildings , average cost: $483,8002020: 67 buildings , average cost: $351,1002019: 43 buildings , average cost: $331,9002018: 67 buildings , average cost: $355,5002017: 61 buildings , average cost: $343,0002016: 69 buildings , average cost: $315,9002015: 66 buildings , average cost: $313,2002014: 78 buildings , average cost: $272,1002013: 51 buildings , average cost: $264,7002012: 55 buildings , average cost: $276,0002011: 42 buildings , average cost: $292,9002010: 51 buildings , average cost: $256,6002009: 51 buildings , average cost: $280,8002008: 69 buildings , average cost: $298,1002007: 76 buildings , average cost: $288,1002006: 133 buildings , average cost: $255,1002005: 151 buildings , average cost: $234,0002004: 182 buildings , average cost: $210,0002003: 174 buildings , average cost: $196,4002002: 140 buildings , average cost: $216,5002001: 167 buildings , average cost: $182,5002000: 105 buildings , average cost: $171,9001999: 138 buildings , average cost: $157,7001998: 119 buildings , average cost: $159,2001997: 97 buildings , average cost: $146,200Unemployment in December 2023:
Population change in the 1990s: +4,503 (+26.7%).
Most common occupations in Muskego, WI (%)
Both Males Females
Other management occupations, except farmers and farm managers (5.0%)
Other office and administrative support workers, including supervisors (4.2%)
Sales representatives, services, wholesale and manufacturing (4.0%)
Metal workers and plastic workers (3.7%)
Retail sales workers, except cashiers (3.5%)
Other production occupations, including supervisors (3.5%)
Registered nurses (3.5%)
Metal workers and plastic workers (6.7%)
Other management occupations, except farmers and farm managers (6.5%)
Electrical equipment mechanics and other installation, maintenance, and repair workers, including supervisors (5.5%)
Other production occupations, including supervisors (5.2%)
Sales representatives, services, wholesale and manufacturing (4.7%)
Driver/sales workers and truck drivers (3.9%)
Material recording, scheduling, dispatching, and distributing workers (3.7%)
Other office and administrative support workers, including supervisors (7.4%)
Secretaries and administrative assistants (6.8%)
Registered nurses (6.5%)
Information and record clerks, except customer service representatives (4.3%)
Preschool, kindergarten, elementary, and middle school teachers (3.9%)
Retail sales workers, except cashiers (3.5%)
Customer service representatives (3.5%)
Tornado activity:
Muskego-area historical tornado activity is slightly above Wisconsin state average. It is 29% greater than the overall U.S. average.
On 4/27/1984, a category F4 (max. wind speeds 207-260 mph) tornado 12.9 miles away from the Muskego city center killed one person and injured 14 people and caused between $500,000 and $5,000,000 in damages.
On 6/5/1977, a category F3 (max. wind speeds 158-206 mph) tornado 1.8 miles away from the city center injured 8 people and caused between $500,000 and $5,000,000 in damages.
Earthquake activity:
Muskego-area historical earthquake activity is significantly above Wisconsin state average. It is 17% greater than the overall U.S. average. On 4/18/2008 at 09:36:59, a magnitude 5.4 (5.1 MB, 4.8 MS, 5.4 MW, 5.2 MW, Class: Moderate, Intensity: VI - VII) earthquake occurred 308.0 miles away from Muskego center On 6/28/2004 at 06:10:52, a magnitude 4.2 (4.2 MW, Depth: 6.2 mi, Class: Light, Intensity: IV - V) earthquake occurred 107.3 miles away from Muskego center On 6/10/1987 at 23:48:54, a magnitude 5.1 (4.9 MB, 4.4 MS, 4.6 MS, 5.1 LG) earthquake occurred 282.5 miles away from Muskego center On 4/18/2008 at 09:36:59, a magnitude 5.2 (5.2 MW, Depth: 8.9 mi) earthquake occurred 308.0 miles away from Muskego center On 5/2/2015 at 16:23:07, a magnitude 4.2 (4.2 MW, Depth: 2.8 mi) earthquake occurred 144.8 miles away from Muskego center On 2/10/2010 at 09:59:35, a magnitude 3.8 (3.8 MW, Depth: 6.2 mi, Class: Light, Intensity: II - III) earthquake occurred 67.2 miles away from Muskego center Magnitude types: regional Lg-wave magnitude (LG), body-wave magnitude (MB), surface-wave magnitude (MS), moment magnitude (MW) Natural disasters: The number of natural disasters in Waukesha County (16) is near the US average (15).Major Disasters (Presidential) Declared: 12Emergencies Declared: 4Storms: 11, Floods: 9, Tornadoes: 2, Drought: 1, Hurricane: 1, Snow: 1, Wind: 1, Winter Storm: 1, Other: 1 (Note: some incidents may be assigned to more than one category). Hospitals and medical centers in Muskego: MUSKEGO HEALTH CARE CENTER (S77 W18690 JANESVILLE RD)
TUDOR OAKS HEALTH CENTER (S77 W12929 MCSHANE DR)
Other hospitals and medical centers near Muskego: HALES CORNERS CARE CTR (Nursing Home, about 5 miles away; HALES CORNERS, WI)
VENCOR HOME SERVICES INC (Home Health Center, about 5 miles away; HALES CORNERS, WI)
KINDRED HSPTL MILWAUKEE (Hospital, about 6 miles away; GREENFIELD, WI)
CPC GREENBRIAR HOSPITAL (Hospital, about 6 miles away; GREENFIELD, WI)
ATLAS HEALTHCARE INC (Home Health Center, about 6 miles away; HALES CORNERS, WI)
NEW BERLIN MEMORIAL HOSPITAL (Hospital, about 7 miles away; NEW BERLIN, WI)
LINDENGROVE NEW BERLIN (Nursing Home, about 7 miles away; NEW BERLIN, WI)
Amtrak stations near Muskego: 14 miles: MILWAUKEE (433 W. ST. PAUL AVE.) Services: ticket office, fully wheelchair accessible, enclosed waiting area, public restrooms, public payphones, full-service food facilities, paid short-term parking, paid long-term parking, call for car rental service, taxi stand, public transit connection.
18 miles: STURTEVANT (2904 WISCONSIN ST.) Services: enclosed waiting area, public restrooms, public payphones, free short-term parking, free long-term parking, call for taxi service, public transit connection.
Colleges/universities with over 2000 students nearest to Muskego:
Carroll University (about 9 miles; Waukesha, WI ; Full-time enrollment: 3,313)
Waukesha County Technical College (about 14 miles; Pewaukee, WI ; FT enrollment: 4,415)
Marquette University (about 14 miles; Milwaukee, WI ; FT enrollment: 9,844)
Milwaukee Area Technical College (about 15 miles; Milwaukee, WI ; FT enrollment: 13,156)
Milwaukee School of Engineering (about 15 miles; Milwaukee, WI ; FT enrollment: 2,386)
University of Wisconsin-Milwaukee (about 18 miles; Milwaukee, WI ; FT enrollment: 24,196)
Cardinal Stritch University (about 20 miles; Milwaukee, WI ; FT enrollment: 3,595)
Public high school in Muskego: MUSKEGO HIGH Students: 1,675, Location: W183S8750 RACINE AVE, Grades: 9-12)Public elementary/middle schools in Muskego: LAKE DENOON MIDDLE Students: 765, Location: W216S10586 CROWBAR DR, Grades: 5-8)BAY LANE MIDDLE Students: 718, Location: S75W16399 HILLTOP DR, Grades: 5-8)TESS CORNERS ELEMENTARY Students: 497, Location: W147S6800 DURHAM DR, Grades: PK-4)MILL VALLEY ELEMENTARY Students: 377, Location: W191S6445 HILLENDALE DR, Grades: PK-4)COUNTRY MEADOWS ELEMENTARY Students: 306, Location: S75W16399 HILLTOP DR, Grades: PK-4)MUSKEGO ELEMENTARY Students: 262, Location: S75W17476 JANESVILLE RD, Grades: PK-4)Private elementary/middle schools in Muskego: ST PAULS LUTHERAN SCHOOL Students: 272, Location: 566W14325 JANESVILLE RD, Grades: PK-8)
ST LEONARD SCHOOL Students: 206, Location: W173S7777 WESTWOOD DR, Grades: PK-8)
See full list of schools located in Muskego Library in Muskego: MUSKEGO PUBLIC LIBRARY Operating income: $1,196,403; Location: S73 W16663 JANESVILLE RD.; 115,203 books ; 7,012 e-books ; 7,140 audio materials ; 3,705 video materials ; 2 local licensed databases ; 28 state licensed databases ; 233 print serial subscriptions )
User-submitted facts and corrections:
please add our website www.stpaulmuskego.org along with the church name Saint Paul's Ev. Lutheran Church, if possible-- thanks
Notable locations in Muskego: (A) , Tess Corners Volunteer Fire Department Station 3 (B) , Tess Corners Volunteer Fire Department Station 4 (C) , Tess Corners Volunteer Fire Department Station 1 (D) , Tess Corners Volunteer Fire Department Station 2 (E) , Durham Hill Nursery (F) , Muskego City Hall (G) . Display/hide their locations on the map
Shopping Centers: (1) , Parkland Mall Shopping Center (2) . Display/hide their locations on the map
Churches in Muskego include: (A) , Atonement Lutheran Church (B) , Behtel Lutheran Church (C) , Bethlehem Lutheran Church (D) , Heritage Presbyterian Church (E) , Praise Fellowship Church (F) , Saint Leonards Catholic Church (G) , Saint Pauls Lutheran Church (H) . Display/hide their locations on the map
Cemeteries: (1) , Jones-Muckey School Cemetery (2) . Display/hide their locations on the map
Lakes and reservoirs: (A) , Muskego Lake (B) , Little Muskego Lake 11.6 (C) , Lake Brittany (D) , Little Muskego Lake (E) . Display/hide their locations on the map
Parks in Muskego include: (1) , Denoon Park (2) , Horn Park (3) , Idle Isle Park (4) , Jensen Park (5) , Muskego County Park (6) , Schmidt Park (7) , Kurth Park (8) , Lions Park (9) . Display/hide their locations on the map
Waukesha County has a predicted average indoor radon screening level greater than 4 pCi/L (pico curies per liter) - Highest Potential Drinking water stations with addresses in Muskego and their reported violations in the past:
HALE PARK MEADOWS (Population served: 720, Groundwater):
Past monitoring violations:
Monitoring and Reporting (DBP) - Between OCT-2011 and DEC-2011, Contaminant: Chlorine. Follow-up actions: St Compliance achieved (JAN-04-2012), St Violation/Reminder Notice (JAN-11-2012), St Public Notif issued (JAN-16-2012), St Public Notif received (JAN-19-2012)
One routine major monitoring violation
Population served: 87, Groundwater):
Past health violations:
MCL, Monthly (TCR) - In MAY-2007, Contaminant: Coliform. Follow-up actions: St Public Notif issued (JUN-15-2007), St Violation/Reminder Notice (JUN-15-2007), St Boil Water Order (JUN-15-2007), St Public Notif requested (JUN-15-2007), St Public Notif received (JUN-21-2007), St Site Visit (enforcement) (JUN-26-2007), St Compliance achieved (JUL-27-2007)
MCL, Monthly (TCR) - In JAN-2007, Contaminant: Coliform. Follow-up actions: St Public Notif issued (FEB-02-2007), St Violation/Reminder Notice (FEB-02-2007), St Boil Water Order (FEB-02-2007), St Public Notif requested (FEB-02-2007), St Public Notif received (FEB-06-2007), St Compliance achieved (MAY-15-2007), St Site Visit (enforcement) (JUN-26-2007)
Population served: 31, Groundwater):
Past health violations:
MCL, Monthly (TCR) - In MAR-2008, Contaminant: Coliform. Follow-up actions: St Public Notif requested (MAR-07-2008), St Violation/Reminder Notice (MAR-07-2008), St Boil Water Order (MAR-07-2008), St Public Notif issued (MAR-07-2008), St Public Notif received (MAR-11-2008), St Compliance achieved (MAR-19-2008)
Drinking water stations with addresses in Muskego that have no violations reported:
DURHAM MEADOWS WATER TRUST (Population served: 700, Primary Water Source Type: Groundwater)
VEOLIA ENVIRONMENTAL SERVICES-OFFICE (Population served: 164, Primary Water Source Type: Groundwater)
VEOLIA ENVIRONMENTAL SERVICES - NEW SHOP (Population served: 95, Primary Water Source Type: Groundwater)
THE TAVERN (Population served: 55, Primary Water Source Type: Groundwater)
MUG ZS PUB AND GRILL (Population served: 54, Primary Water Source Type: Groundwater)
SCHMIDTS REFUGE (Population served: 43, Primary Water Source Type: Groundwater)
MANNIGANS IRISH PUB (Population served: 28, Primary Water Source Type: Groundwater)
MATHER LANES (Population served: 27, Primary Water Source Type: Groundwater)
PICNIC BASKET NASHOTAH (Population served: 27, Primary Water Source Type: Groundwater)
VALLEY GREEN GOLF COURSE (Population served: 25, Primary Water Source Type: Groundwater)
Average household size: This city:
2.6 peopleWisconsin:
2.4 people
Percentage of family households: This city:
77.3%Whole state:
64.4%
Percentage of households with unmarried partners: This city:
4.7%Whole state:
7.3%
Likely homosexual households (counted as self-reported same-sex unmarried-partner households)
Lesbian couples: 0.4% of all households Gay men: 0.3% of all households
108 people in nursing facilities/skilled-nursing facilities in 2010people in nursing homes in 2000people in other noninstitutional group quarters in 2000
Banks with most branches in Muskego (2011 data):
BMO Harris Bank National Association: Muskego Branch, Stoney Creek Retirement Branch, Muskego Branch. Info updated 2011/07/14: Bank assets: $97,264.0 mil, Deposits: $75,624.6 mil, headquarters in Chicago, IL, positive income , 717 total offices , Holding Company: Bank Of Montreal
Citizens Bank of Mukwonago: Muskego Branch at S74 W17005 South Janesville Road, branch established on 1995/09/18; Muskego Senior Center Facility at W181 S8540 Lodge Boulevard, branch established on 2010/04/20. Info updated 2006/11/03: Bank assets: $651.0 mil, Deposits: $577.4 mil, headquarters in Mukwonago, WI, positive income , Commercial Lending Specialization, 14 total offices , Holding Company: Citizens Bank Holding, Inc.
Guaranty Bank: Muskego Sentry Foods Branch at W189 S7847 Racine Avenue, branch established on 2000/09/20. Info updated 2011/07/21: Bank assets: $1,179.1 mil, Deposits: $1,102.7 mil, headquarters in Milwaukee, WI, negative income in the last year , Mortgage Lending Specialization, 166 total offices
North Shore Bank, FSB: Muskego Branch at S74 W17095 Janesville Road, branch established on 2007/06/30. Info updated 2011/07/21: Bank assets: $1,769.3 mil, Deposits: $1,357.7 mil, headquarters in Brookfield, WI, negative income in the last year , Commercial Lending Specialization, 47 total offices
PyraMax Bank, FSB: Muskego Branch at W137 S6360 Janesville Road, branch established on 2009/02/16. Info updated 2011/07/21: Bank assets: $456.1 mil, Deposits: $366.9 mil, headquarters in Greenfield, WI, negative income in the last year , Commercial Lending Specialization, 9 total offices
Waukesha State Bank: Muskego Branch at S69w15273 Janesville Road, branch established on 2006/06/05. Info updated 2009/03/05: Bank assets: $795.9 mil, Deposits: $657.4 mil, headquarters in Waukesha, WI, positive income , Commercial Lending Specialization, 19 total offices
U.S. Bank National Association: Muskego Branch at S75w17125 Janesville Road, branch established on 1968/05/20. Info updated 2012/01/30: Bank assets: $330,470.8 mil, Deposits: $236,091.5 mil, headquarters in Cincinnati, OH, positive income , 3121 total offices , Holding Company: U.S. Bancorp
Associated Bank, National Association: Muskego Branch at S76 W17655 Janesville Road, branch established on 1968/05/13. Info updated 2008/09/12: Bank assets: $21,715.0 mil, Deposits: $15,244.4 mil, headquarters in Green Bay, WI, positive income , Commercial Lending Specialization, 282 total offices , Holding Company: Associated Banc-Corp
PNC Bank, National Association: S74-W17100 Janesville Rd Branch at S74w17100 Janesville Rd, branch established on 1923/01/01. Info updated 2012/03/20: Bank assets: $263,309.6 mil, Deposits: $197,343.0 mil, headquarters in Wilmington, DE, positive income , Commercial Lending Specialization, 3085 total offices , Holding Company: Pnc Financial Services Group, Inc., The
For population 15 years and over in Muskego:
Never married: 22.9%Now married: 62.6%Separated: 0.0%Widowed: 6.2%Divorced: 8.3% For population 25 years and over in Muskego:
High school or higher: 96.6%Bachelor's degree or higher: 42.6%Graduate or professional degree: 13.9%Unemployed: 3.3%Mean travel time to work (commute): 20.4 minutes
Education Gini index (Inequality in education) Here:
9.1Wisconsin average:
10.4
Religion statistics for Muskego, WI (based on Waukesha County data)
Religion Adherents Congregations Catholic 115,008 28 Evangelical Protestant 71,237 128 Mainline Protestant 38,654 87 Other 9,840 29 None 155,152 -
Source: Clifford Grammich, Kirk Hadaway, Richard Houseal, Dale E.Jones, Alexei Krindatch, Richie Stanley and Richard H.Taylor. 2012. 2010 U.S.Religion Census: Religious Congregations & Membership Study. Association of Statisticians of American Religious Bodies. Jones, Dale E., et al. 2002. Congregations and Membership in the United States 2000. Nashville, TN: Glenmary Research Center. Graphs represent county-level data
Food Environment Statistics: Number of grocery stores : 57Waukesha County :
1.51 / 10,000 pop.Wisconsin :
1.86 / 10,000 pop.
Number of supercenters and club stores : 1This county :
0.03 / 10,000 pop.State :
0.11 / 10,000 pop.
Number of convenience stores (no gas) : 5Waukesha County :
0.13 / 10,000 pop.State :
0.38 / 10,000 pop.
Number of convenience stores (with gas) : 106This county :
2.80 / 10,000 pop.State :
4.12 / 10,000 pop.
Number of full-service restaurants : 283Waukesha County :
7.47 / 10,000 pop.Wisconsin :
8.64 / 10,000 pop.
Adult diabetes rate : This county :
6.7%State :
7.6%
Adult obesity rate : This county :
26.8%Wisconsin :
27.5%
Low-income preschool obesity rate : This county :
13.2%Wisconsin :
13.0%
Health and Nutrition: Healthy diet rate : This city:
52.3%Wisconsin:
49.5%
Average overall health of teeth and gums : People feeling badly about themselves : Muskego:
20.3%Wisconsin:
21.4%
People not drinking alcohol at all : Average hours sleeping at night : General health condition : This city:
58.9%Wisconsin:
56.3%
Average condition of hearing : This city:
79.4%State:
78.5%
More about Health and Nutrition of Muskego, WI Residents
Local government employment and payroll (March 2022)
Function
Full-time employees
Monthly full-time payroll
Average yearly full-time wage
Part-time employees
Monthly part-time payroll
Police Protection - Officers
38 $305,492 $96,471 0 $0 Streets and Highways
20 $118,894 $71,336 2 $3,315 Other Government Administration
11 $33,108 $36,118 1 $1,302 Police - Other
9 $43,114 $57,485 0 $0 Local Libraries
9 $48,229 $64,305 13 $14,873 Financial Administration
8 $55,864 $83,796 1 $812 Sewerage
6 $38,221 $76,442 0 $0 Water Supply
4 $20,580 $61,740 0 $0 Judicial and Legal
4 $21,930 $65,790 1 $531 Parks and Recreation
2 $12,329 $73,974 13 $5,042 Other and Unallocable
1 $6,362 $76,344 0 $0 Natural Resources
1 $7,017 $84,204 1 $461
Totals for Government
113 $711,140 $75,519 32 $26,336
Muskego government finances - Expenditure in 2021 (per resident):
Construction - Regular Highways: $900,000 ($35.79)
Parks and Recreation: $417,000 ($16.58)General - Other: $363,000 ($14.43)Police Protection: $280,000 ($11.13)Sewerage: $74,000 ($2.94)Local Fire Protection: $7,000 ($0.28)Current Operations - Sewerage: $7,854,000 ($312.29)
Police Protection: $6,231,000 ($247.75)Regular Highways: $2,787,000 ($110.82)Water Utilities: $2,232,000 ($88.75)Central Staff Services: $1,463,000 ($58.17)Libraries: $1,313,000 ($52.21)Solid Waste Management: $1,226,000 ($48.75)Local Fire Protection: $838,000 ($33.32)Natural Resources - Other: $503,000 ($20.00)Parks and Recreation: $400,000 ($15.90)Judicial and Legal Services: $306,000 ($12.17)Protective Inspection and Regulation - Other: $263,000 ($10.46)General Public Buildings: $217,000 ($8.63)General - Other: $193,000 ($7.67)General - Interest on Debt: $1,634,000 ($64.97)
Other Capital Outlay - Regular Highways: $350,000 ($13.92)
General - Other: $41,000 ($1.63)
Muskego government finances - Revenue in 2021 (per resident):
Charges - Sewerage: $6,347,000 ($252.37)
Solid Waste Management: $1,122,000 ($44.61)Parks and Recreation: $327,000 ($13.00)Other: $154,000 ($6.12)Regular Highways: $138,000 ($5.49)Natural Resources - Other: $1,000 ($0.04)Federal Intergovernmental - Other: $23,000 ($0.91)
Local Intergovernmental - Other: $1,266,000 ($50.34)
Miscellaneous - Special Assessments: $1,348,000 ($53.60)
General Revenue - Other: $519,000 ($20.64)Interest Earnings: $359,000 ($14.27)Fines and Forfeits: $248,000 ($9.86)Donations From Private Sources: $110,000 ($4.37)Rents: $39,000 ($1.55)Revenue - Water Utilities: $1,738,000 ($69.11)
State Intergovernmental - Highways: $1,301,000 ($51.73)
General Local Government Support: $998,000 ($39.68)Education: $493,000 ($19.60)Other: $153,000 ($6.08)Tax - Property: $14,226,000 ($565.65)
Occupation and Business License - Other: $2,342,000 ($93.12)Other License: $509,000 ($20.24)
Muskego government finances - Debt in 2021 (per resident):
Long Term Debt - Beginning Outstanding - Unspecified Public Purpose: $49,315,000 ($1960.83)
Outstanding Unspecified Public Purpose: $40,318,000 ($1603.10)Retired Unspecified Public Purpose: $15,826,000 ($629.26)Issue, Unspecified Public Purpose: $6,828,000 ($271.49)
Businesses in Muskego, WI
Name Count Name Count
ALDI 1 H&R Block 1 Ace Hardware 1 Jimmy John's 1 Arby's 1 Kohl's 1 AutoZone 1 McDonald's 1 Curves 1 Pizza Hut 1 Dairy Queen 1 True Value 1 Domino's Pizza 1 U-Haul 1 FedEx 2 UPS 3 GNC 1 Walgreens 1 Goodwill 1 Walmart 1
Strongest AM radio stations in Muskego:
WISN (1130 AM; 50 kW; MILWAUKEE, WI; Owner: CAPSTAR TX LIMITED PARTNERSHIP)
WTMJ (620 AM; 50 kW; MILWAUKEE, WI; Owner: JOURNAL BROADCAST CORPORATION)
WEMP (1250 AM; 5 kW; MILWAUKEE, WI; Owner: ENTERCOM MILWAUKEE LICENSE, LLC)
WOKY (920 AM; 5 kW; MILWAUKEE, WI; Owner: CLEAR CHANNEL BROADCASTING LICENSES, INC.)
WAUK (1510 AM; daytime; 10 kW; WAUKESHA, WI; Owner: WALT-WEST WISCONSIN, INC.)
WMCS (1290 AM; 5 kW; GREENFIELD, WI; Owner: MILWAUKEE RADIO ALLIANCE, LLC)
WKSH (1640 AM; 10 kW; SUSSEX, WI; Owner: ABC, INC.)
WGN (720 AM; 50 kW; CHICAGO, IL; Owner: WGN CONTINENTAL BROADCASTING CO.)
WSCR (670 AM; 50 kW; CHICAGO, IL; Owner: INFINITY BROADCASTING OPERATIONS, INC.)
WBBM (780 AM; 50 kW; CHICAGO, IL; Owner: INFINITY BROADCASTING OPERATIONS, INC.)
WMVP (1000 AM; 50 kW; CHICAGO, IL; Owner: ABC, INC.)
WLS (890 AM; 50 kW; CHICAGO, IL; Owner: WLS, INC.)
WNAM (1280 AM; 50 kW; NEENAH-MENASHA, WI; Owner: CUMULUS LICENSING CORP.)
Strongest FM radio stations in Muskego:
WVCY-FM (107.7 FM; MILWAUKEE, WI; Owner: VCY AMERICA, INC.)
WFZH (105.3 FM; MUKWONAGO, WI; Owner: CARON BROADCASTING, INC.)
WMYX-FM (99.1 FM; MILWAUKEE, WI; Owner: ENTERCOM MILWAUKEE LICENSE, LLC)
WKKV-FM (100.7 FM; RACINE, WI; Owner: CLEAR CHANNEL BROADCASTING LICENSES, INC.)
WJZI (93.3 FM; MILWAUKEE, WI; Owner: MILWAUKEE RADIO ALLIANCE, LLC)
WMIL-FM (106.1 FM; WAUKESHA, WI; Owner: CLEAR CHANNEL BROADCASTING LICENSES, INC.)
WKTI-FM (94.5 FM; MILWAUKEE, WI; Owner: JOURNAL BROADCAST CORPORATION)
WLTQ (97.3 FM; MILWAUKEE, WI; Owner: CAPSTAR TX LIMITED PARTNERSHIP)
WUWM (89.7 FM; MILWAUKEE, WI; Owner: BOARD OF REGENTS, UNIVERSITY OF WISCONSIN SYSTEM)
WXSS (103.7 FM; WAUWATOSA, WI; Owner: ENTERCOM MILWAUKEE LICENSE, LLC)
WKLH (96.5 FM; MILWAUKEE, WI; Owner: LAKEFRONT COMMUNICATIONS, LLC)
WMWK (88.1 FM; MILWAUKEE, WI; Owner: FAMILY STATIONS, INC.)
WHAD (90.7 FM; DELAFIELD, WI; Owner: STATE OF WISCONSIN - EDUCATIONAL COMMUNICATIONS BOARD)
WLUM-FM (102.1 FM; MILWAUKEE, WI; Owner: MILWAUKEE RADIO ALLIANCE, LLC)
WLZR (102.9 FM; MILWAUKEE, WI; Owner: LAKEFRONT COMMUNICATIONS, LLC)
WJMR-FM (98.3 FM; MENOMONEE FALLS, WI; Owner: LAKEFRONT COMMUNICATIONS, LLC)
WRIT-FM (95.7 FM; MILWAUKEE, WI; Owner: CLEAR CHANNEL BROADCASTING LICENSES, INC.)
WEXT (104.7 FM; STURTEVANT, WI; Owner: NM LICENSING, LLC)
WEZY (92.1 FM; RACINE, WI; Owner: RACINE BROADCASTING, L.L.C.)
WFMR (106.9 FM; BROOKFIELD, WI; Owner: SAGA COMMUNICATIONS OF MILWAUKEE, LLC)
TV broadcast stations around Muskego:
WTAS-LP (Channel 43; WAUKESHA, WI; Owner: WAUKESHA TOWER ASSOCIATES)
WJJA (Channel 49; RACINE, WI; Owner: TV-49, INC.)
WPXE (Channel 55; KENOSHA, WI; Owner: PAXSON MILWAUKEE LICENSE, INC.)
WMVS (Channel 10; MILWAUKEE, WI; Owner: MILWAUKEE AREA TECHNICAL COLLEGE DISTRICT BOARD)
WDJT-TV (Channel 58; MILWAUKEE, WI; Owner: WDJT-TV LIMITED PARTNERSHIP)
WISN-TV (Channel 12; MILWAUKEE, WI; Owner: WISN HEARST-ARGYLE TV, INC. (CA CORP.))
WMVT (Channel 36; MILWAUKEE, WI; Owner: MILWAUKEE AREA TECHNICAL COLLEGE DISTRICT BOARD)
WCGV-TV (Channel 24; MILWAUKEE, WI; Owner: WCGV LICENSEE, LLC)
WMLW-CA (Channel 46; MILWAUKEE, WI; Owner: CHANNEL 41 AND 63 LIMITED PARTNERSHIP)
W63CU (Channel 63; MILWAUKEE, WI; Owner: CHANNEL 41 AND 63 LIMITED PARTNERSHIP)
WTMJ-TV (Channel 4; MILWAUKEE, WI; Owner: JOURNAL BROADCAST CORPORATION)
WVTV (Channel 18; MILWAUKEE, WI; Owner: WVTV LICENSEE, INC.)
WMKE-CA (Channel 7; MILWAUKEE, WI; Owner: KM LPTV OF MILWAUKEE, L.L.C.)
WVCY-TV (Channel 30; MILWAUKEE, WI; Owner: VCY AMERICA, INC.)
WITI (Channel 6; MILWAUKEE, WI; Owner: WITI LICENSE,INC.)
W64CQ (Channel 64; ARLINGTON HEIGHTS, IL; Owner: TRINITY BROADCASTING NETWORK)
WWRS-TV (Channel 52; MAYVILLE, WI; Owner: NATIONAL MINORITY T.V., INC.)
W34CK (Channel 34; ARLINGTON HEIGHTS, IL; Owner: FIRST UNITED, INC.)
National Bridge Inventory (NBI) Statistics 10 Number of bridges36ft / 10.8m Total length $617,000 Total costs41,192 Total average daily traffic1,130 Total average daily truck traffic47,958 Total future (year 2038) average daily traffic
New bridges - historical statistics
1 1920-1929 5 1960-1969 1 1990-1999 2 2000-2009 1 2010-2019
See full National Bridge Inventory statistics for Muskego, WI
FCC Registered Cell Phone Towers: 1 (
See the full list of FCC Registered Cell Phone Towers in Muskego )
FCC Registered Antenna Towers: 16 (
See the full list of FCC Registered Antenna Towers )
FCC Registered Private Land Mobile Towers: 3 (
See the full list of FCC Registered Private Land Mobile Towers in Muskego, WI )
FCC Registered Broadcast Land Mobile Towers: 14 (
See the full list of FCC Registered Broadcast Land Mobile Towers )
FCC Registered Microwave Towers: 3
STATION, 7278 Crowbar Dr (Lat: 42.912778 Lon: -88.187583), Overall height: 135 m, Call Sign: WNES730, Assigned Frequencies: 958.350 MHz, 957.200 MHz, 958.100 MHz, 958.750 MHz, Grant Date: 10/31/1997, Expiration Date: 11/12/2007, Cancellation Date: 01/12/2008, Phone: (414) 541-2900 STATION, Crowbar Rd Near Muskego Between Hwy 15 & St Hwy 24 (Lat: 42.902500 Lon: -88.186194), Overall height: 61 m, Call Sign: KTY96, Assigned Frequencies: 958.550 MHz, Grant Date: 03/04/1993, Expiration Date: 03/04/1998, Phone: (608) 255-7294 BIG BEND, W217 S7760 S Crowbar Rd (Lat: 42.902500 Lon: -88.186194), Type: Tower, Structure height: 134.1 m, Overall height: 139.9 m, Call Sign: WHT380, Assigned Frequencies: 2178.00 MHz, 2168.40 MHz, 2174.80 MHz, 6315.84 MHz, 6345.49 MHz, 6256.54 MHz, Grant Date: 02/27/2001, Expiration Date: 02/01/2011, Cancellation Date: 10/05/2005, Certifier: Kenneth R Meyers, Registrant: Holland & Knight LLP, 2099 Pennsylvania Ave., N.W., Suite #100, Washington, DC 20006-6801, Phone: (202) 955-3000, Fax: (202) 955-5564, Email:
FCC Registered Paging Towers: 2
W183 S8750 Racine Ave (Lat: 42.885833 Lon: -88.148694), Overall height: 46.9 m, Call Sign: KNKO362, Assigned Frequencies: 931.337 MHz, Grant Date: 08/14/2018, Expiration Date: 07/01/2028, Certifier: J. Roy Pottle, Registrant: Wilkinson Barker Knauer, LLP, 1800 M Street, N.W., Suite 800n, Washington, DC 20036, Phone: (202) 783-4141, Fax: (202) 783-5851, Email:
7240 Crowbar Road (Lat: 42.912778 Lon: -88.187583), Overall height: 135 m, Call Sign: KNKO592, Assigned Frequencies: 931.687 MHz, Grant Date: 08/01/1997, Expiration Date: 02/08/2005, Cancellation Date: 11/12/2004, Certifier: Paul H Kuzia, Registrant: Wilkinson Barker Knauer, LLP, 2300 N Street, N.W., 7th Floor, Washington, DC 20037, Phone: (202) 783-4141, Fax: (202) 783-5851, Email:
FCC Registered Amateur Radio Licenses: 90 (
See the full list of FCC Registered Amateur Radio Licenses in Muskego )
FAA Registered Aircraft: 16 (
See the full list of FAA Registered Aircraft in Muskego )
Home Mortgage Disclosure Act Aggregated Statistics For Year 2009(Based on 4 full and 1 partial tracts) A) FHA, FSA/RHS & VA B) Conventional C) Refinancings D) Home Improvement Loans E) Loans on Dwellings For 5+ Families F) Non-occupant Loans on Number Average Value Number Average Value Number Average Value Number Average Value Number Average Value Number Average Value
LOANS ORIGINATED 44 $190,040 191 $232,702 1,366 $205,940 57 $93,142 3 $756,333 24 $212,610 APPLICATIONS APPROVED, NOT ACCEPTED 2 $212,500 11 $235,600 80 $220,404 7 $118,296 0 $0 1 $462,000 APPLICATIONS DENIED 7 $160,000 17 $253,942 205 $245,325 17 $32,547 2 $232,500 6 $312,833 APPLICATIONS WITHDRAWN 3 $164,667 15 $189,486 128 $229,917 7 $83,703 0 $0 4 $240,250 FILES CLOSED FOR INCOMPLETENESS 1 $193,000 5 $229,242 39 $238,329 4 $27,672 0 $0 0 $0
Aggregated Statistics For Year 2008(Based on 4 full and 1 partial tracts) A) FHA, FSA/RHS & VA B) Conventional C) Refinancings D) Home Improvement Loans E) Loans on Dwellings For 5+ Families F) Non-occupant Loans on Number Average Value Number Average Value Number Average Value Number Average Value Number Average Value Number Average Value
LOANS ORIGINATED 18 $225,661 215 $230,988 570 $214,113 79 $98,600 6 $968,860 19 $201,754 APPLICATIONS APPROVED, NOT ACCEPTED 0 $0 12 $246,798 53 $187,547 10 $51,902 1 $530,000 2 $60,510 APPLICATIONS DENIED 1 $247,000 15 $261,910 126 $210,844 28 $64,140 0 $0 3 $308,000 APPLICATIONS WITHDRAWN 1 $192,000 9 $210,720 79 $214,223 11 $106,509 0 $0 1 $356,000 FILES CLOSED FOR INCOMPLETENESS 0 $0 2 $277,815 14 $190,011 9 $57,988 0 $0 0 $0
Aggregated Statistics For Year 2007(Based on 4 full and 1 partial tracts) A) FHA, FSA/RHS & VA B) Conventional C) Refinancings D) Home Improvement Loans E) Loans on Dwellings For 5+ Families F) Non-occupant Loans on Number Average Value Number Average Value Number Average Value Number Average Value Number Average Value Number Average Value
LOANS ORIGINATED 5 $174,800 346 $232,681 567 $200,354 98 $77,022 5 $477,800 28 $224,170 APPLICATIONS APPROVED, NOT ACCEPTED 0 $0 25 $276,255 80 $184,792 15 $58,243 0 $0 3 $232,333 APPLICATIONS DENIED 0 $0 24 $242,661 185 $215,935 28 $73,009 0 $0 11 $208,365 APPLICATIONS WITHDRAWN 0 $0 23 $253,978 106 $195,277 9 $125,682 0 $0 1 $209,950 FILES CLOSED FOR INCOMPLETENESS 0 $0 4 $243,310 42 $225,360 5 $102,800 0 $0 0 $0
Aggregated Statistics For Year 2006(Based on 4 full and 1 partial tracts) A) FHA, FSA/RHS & VA B) Conventional C) Refinancings D) Home Improvement Loans E) Loans on Dwellings For 5+ Families F) Non-occupant Loans on G) Loans On Manufactured Number Average Value Number Average Value Number Average Value Number Average Value Number Average Value Number Average Value Number Average Value
LOANS ORIGINATED 9 $193,534 412 $216,642 548 $182,527 88 $53,756 2 $390,500 35 $185,165 0 $0 APPLICATIONS APPROVED, NOT ACCEPTED 0 $0 14 $235,531 60 $210,283 10 $46,093 0 $0 2 $234,500 0 $0 APPLICATIONS DENIED 1 $116,000 43 $155,912 174 $238,759 27 $86,054 0 $0 2 $1,234,310 0 $0 APPLICATIONS WITHDRAWN 0 $0 23 $227,191 116 $211,639 9 $67,479 0 $0 2 $251,500 1 $200,000 FILES CLOSED FOR INCOMPLETENESS 0 $0 6 $190,833 48 $202,576 1 $46,140 0 $0 1 $205,000 0 $0
Aggregated Statistics For Year 2005(Based on 4 full and 1 partial tracts) A) FHA, FSA/RHS & VA B) Conventional C) Refinancings D) Home Improvement Loans E) Loans on Dwellings For 5+ Families F) Non-occupant Loans on Number Average Value Number Average Value Number Average Value Number Average Value Number Average Value Number Average Value
LOANS ORIGINATED 6 $220,000 470 $221,838 719 $176,334 83 $67,103 10 $1,151,700 44 $247,162 APPLICATIONS APPROVED, NOT ACCEPTED 0 $0 24 $168,138 72 $163,694 13 $36,251 1 $350,000 2 $71,000 APPLICATIONS DENIED 1 $175,000 47 $246,484 170 $187,054 23 $141,597 0 $0 7 $178,000 APPLICATIONS WITHDRAWN 3 $226,000 37 $174,651 139 $201,842 12 $176,075 0 $0 8 $211,030 FILES CLOSED FOR INCOMPLETENESS 0 $0 18 $180,344 111 $207,151 4 $47,250 0 $0 1 $200,000
Aggregated Statistics For Year 2004(Based on 4 full and 1 partial tracts) A) FHA, FSA/RHS & VA B) Conventional C) Refinancings D) Home Improvement Loans E) Loans on Dwellings For 5+ Families F) Non-occupant Loans on G) Loans On Manufactured Number Average Value Number Average Value Number Average Value Number Average Value Number Average Value Number Average Value Number Average Value
LOANS ORIGINATED 6 $192,167 401 $203,806 836 $168,385 68 $52,858 3 $758,333 32 $159,060 0 $0 APPLICATIONS APPROVED, NOT ACCEPTED 0 $0 19 $233,402 82 $162,090 13 $25,600 0 $0 3 $124,667 0 $0 APPLICATIONS DENIED 1 $138,000 30 $193,120 154 $164,758 26 $49,172 0 $0 6 $116,905 0 $0 APPLICATIONS WITHDRAWN 0 $0 23 $197,810 91 $181,403 15 $103,867 1 $395,000 3 $261,667 2 $290,000 FILES CLOSED FOR INCOMPLETENESS 1 $220,000 7 $238,136 71 $198,930 6 $91,667 0 $0 2 $105,000 0 $0
Aggregated Statistics For Year 2003(Based on 4 full and 1 partial tracts) A) FHA, FSA/RHS & VA B) Conventional C) Refinancings D) Home Improvement Loans E) Loans on Dwellings For 5+ Families F) Non-occupant Loans on Number Average Value Number Average Value Number Average Value Number Average Value Number Average Value Number Average Value
LOANS ORIGINATED 16 $143,176 482 $190,573 2,288 $146,833 108 $32,067 2 $5,550,500 52 $178,079 APPLICATIONS APPROVED, NOT ACCEPTED 0 $0 21 $158,919 133 $145,228 6 $36,672 1 $836,000 2 $236,940 APPLICATIONS DENIED 0 $0 15 $145,950 255 $151,349 19 $20,628 0 $0 8 $139,375 APPLICATIONS WITHDRAWN 1 $206,000 41 $154,142 128 $158,984 2 $40,000 0 $0 6 $133,167 FILES CLOSED FOR INCOMPLETENESS 0 $0 6 $190,952 35 $155,754 3 $46,000 0 $0 1 $105,000
Aggregated Statistics For Year 2002(Based on 4 full tracts) A) FHA, FSA/RHS & VA B) Conventional C) Refinancings D) Home Improvement Loans E) Loans on Dwellings For 5+ Families F) Non-occupant Loans on Number Average Value Number Average Value Number Average Value Number Average Value Number Average Value Number Average Value
LOANS ORIGINATED 9 $156,333 468 $171,464 1,623 $143,771 84 $29,262 8 $538,875 30 $171,733 APPLICATIONS APPROVED, NOT ACCEPTED 0 $0 20 $145,350 118 $136,695 4 $33,000 0 $0 4 $178,250 APPLICATIONS DENIED 1 $216,000 30 $134,867 104 $130,173 18 $18,556 0 $0 4 $85,750 APPLICATIONS WITHDRAWN 2 $195,000 31 $139,806 102 $154,598 5 $13,400 0 $0 3 $94,667 FILES CLOSED FOR INCOMPLETENESS 1 $97,000 6 $103,667 30 $120,667 1 $20,000 0 $0 0 $0
Aggregated Statistics For Year 2001(Based on 4 full tracts) A) FHA, FSA/RHS & VA B) Conventional C) Refinancings D) Home Improvement Loans E) Loans on Dwellings For 5+ Families F) Non-occupant Loans on Number Average Value Number Average Value Number Average Value Number Average Value Number Average Value Number Average Value
LOANS ORIGINATED 19 $147,579 400 $160,895 1,163 $134,900 59 $25,203 9 $595,889 31 $153,129 APPLICATIONS APPROVED, NOT ACCEPTED 0 $0 14 $113,214 77 $137,584 6 $20,167 0 $0 2 $109,500 APPLICATIONS DENIED 0 $0 23 $113,957 116 $109,845 11 $18,818 0 $0 2 $145,500 APPLICATIONS WITHDRAWN 3 $142,333 23 $168,478 124 $149,242 11 $17,545 0 $0 4 $258,500 FILES CLOSED FOR INCOMPLETENESS 1 $167,000 1 $332,000 27 $123,593 0 $0 0 $0 0 $0
Aggregated Statistics For Year 2000(Based on 4 full tracts) A) FHA, FSA/RHS & VA B) Conventional C) Refinancings D) Home Improvement Loans E) Loans on Dwellings For 5+ Families F) Non-occupant Loans on Number Average Value Number Average Value Number Average Value Number Average Value Number Average Value Number Average Value
LOANS ORIGINATED 9 $119,333 313 $158,821 210 $106,657 86 $19,814 8 $418,500 13 $110,154 APPLICATIONS APPROVED, NOT ACCEPTED 0 $0 13 $130,462 24 $111,417 5 $15,400 0 $0 0 $0 APPLICATIONS DENIED 1 $132,000 24 $135,000 82 $91,378 24 $27,125 0 $0 2 $50,000 APPLICATIONS WITHDRAWN 0 $0 19 $185,105 57 $66,947 9 $49,444 1 $430,000 0 $0 FILES CLOSED FOR INCOMPLETENESS 1 $76,000 5 $108,000 11 $114,091 1 $40,000 0 $0 0 $0
Aggregated Statistics For Year 1999(Based on 4 full and 1 partial tracts) A) FHA, FSA/RHS & VA B) Conventional C) Refinancings D) Home Improvement Loans E) Loans on Dwellings For 5+ Families F) Non-occupant Loans on Number Average Value Number Average Value Number Average Value Number Average Value Number Average Value Number Average Value
LOANS ORIGINATED 17 $139,784 398 $146,468 522 $108,938 102 $23,891 7 $500,000 18 $100,828 APPLICATIONS APPROVED, NOT ACCEPTED 1 $170,540 19 $139,969 57 $106,224 12 $15,228 0 $0 1 $9,990 APPLICATIONS DENIED 1 $196,830 20 $123,102 94 $103,531 17 $27,679 0 $0 3 $205,600 APPLICATIONS WITHDRAWN 0 $0 20 $160,707 61 $111,479 25 $75,850 0 $0 1 $129,880 FILES CLOSED FOR INCOMPLETENESS 1 $170,850 5 $182,622 22 $110,349 0 $0 0 $0 0 $0
Detailed HMDA statistics for the following Tracts:
2015.04
, 2017.01 , 2017.02 , 2018.00 , 2019.00
Private Mortgage Insurance Companies Aggregated Statistics For Year 2009(Based on 4 full and 1 partial tracts) A) Conventional B) Refinancings Number Average Value Number Average Value
LOANS ORIGINATED 24 $256,502 18 $239,856 APPLICATIONS APPROVED, NOT ACCEPTED 4 $236,775 4 $235,330 APPLICATIONS DENIED 2 $229,000 4 $336,978 APPLICATIONS WITHDRAWN 1 $232,000 2 $284,500 FILES CLOSED FOR INCOMPLETENESS 0 $0 0 $0
Aggregated Statistics For Year 2008(Based on 4 full and 1 partial tracts) A) Conventional B) Refinancings Number Average Value Number Average Value
LOANS ORIGINATED 15 $198,167 15 $267,337 APPLICATIONS APPROVED, NOT ACCEPTED 5 $228,272 4 $334,082 APPLICATIONS DENIED 0 $0 0 $0 APPLICATIONS WITHDRAWN 2 $222,000 0 $0 FILES CLOSED FOR INCOMPLETENESS 0 $0 0 $0
Aggregated Statistics For Year 2007(Based on 4 full and 1 partial tracts) A) Conventional B) Refinancings C) Non-occupant Loans on Number Average Value Number Average Value Number Average Value
LOANS ORIGINATED 25 $209,739 21 $228,880 1 $274,120 APPLICATIONS APPROVED, NOT ACCEPTED 2 $331,260 4 $262,208 1 $228,000 APPLICATIONS DENIED 0 $0 2 $351,405 0 $0 APPLICATIONS WITHDRAWN 1 $285,000 3 $294,667 0 $0 FILES CLOSED FOR INCOMPLETENESS 0 $0 0 $0 0 $0
Aggregated Statistics For Year 2006(Based on 4 full and 1 partial tracts) A) Conventional B) Refinancings C) Non-occupant Loans on Number Average Value Number Average Value Number Average Value
LOANS ORIGINATED 13 $237,365 7 $249,796 1 $265,000 APPLICATIONS APPROVED, NOT ACCEPTED 2 $413,810 2 $296,100 0 $0 APPLICATIONS DENIED 1 $242,000 0 $0 0 $0 APPLICATIONS WITHDRAWN 0 $0 2 $222,000 0 $0 FILES CLOSED FOR INCOMPLETENESS 0 $0 0 $0 0 $0
Aggregated Statistics For Year 2005(Based on 4 full and 1 partial tracts) A) Conventional B) Refinancings C) Non-occupant Loans on Number Average Value Number Average Value Number Average Value
LOANS ORIGINATED 25 $215,892 10 $213,329 1 $200,000 APPLICATIONS APPROVED, NOT ACCEPTED 11 $303,507 4 $310,470 0 $0 APPLICATIONS DENIED 0 $0 0 $0 0 $0 APPLICATIONS WITHDRAWN 0 $0 1 $203,000 0 $0 FILES CLOSED FOR INCOMPLETENESS 0 $0 1 $158,000 0 $0
Aggregated Statistics For Year 2004(Based on 4 full and 1 partial tracts) A) Conventional B) Refinancings Number Average Value Number Average Value
LOANS ORIGINATED 21 $233,507 8 $214,164 APPLICATIONS APPROVED, NOT ACCEPTED 12 $263,896 3 $219,870 APPLICATIONS DENIED 0 $0 0 $0 APPLICATIONS WITHDRAWN 0 $0 1 $335,130 FILES CLOSED FOR INCOMPLETENESS 0 $0 0 $0
Aggregated Statistics For Year 2003(Based on 4 full and 1 partial tracts) A) Conventional B) Refinancings C) Non-occupant Loans on Number Average Value Number Average Value Number Average Value
LOANS ORIGINATED 31 $228,831 39 $160,032 1 $243,000 APPLICATIONS APPROVED, NOT ACCEPTED 8 $232,489 6 $212,205 0 $0 APPLICATIONS DENIED 0 $0 0 $0 0 $0 APPLICATIONS WITHDRAWN 0 $0 0 $0 0 $0 FILES CLOSED FOR INCOMPLETENESS 0 $0 0 $0 0 $0
Aggregated Statistics For Year 2002(Based on 4 full tracts) A) Conventional B) Refinancings Number Average Value Number Average Value
LOANS ORIGINATED 45 $182,044 24 $155,583 APPLICATIONS APPROVED, NOT ACCEPTED 9 $229,556 4 $163,250 APPLICATIONS DENIED 0 $0 0 $0 APPLICATIONS WITHDRAWN 1 $198,000 1 $145,000 FILES CLOSED FOR INCOMPLETENESS 0 $0 0 $0
Aggregated Statistics For Year 2001(Based on 4 full tracts) A) Conventional B) Refinancings Number Average Value Number Average Value
LOANS ORIGINATED 40 $192,100 23 $177,913 APPLICATIONS APPROVED, NOT ACCEPTED 4 $190,500 5 $153,400 APPLICATIONS DENIED 0 $0 0 $0 APPLICATIONS WITHDRAWN 0 $0 1 $215,000 FILES CLOSED FOR INCOMPLETENESS 0 $0 1 $252,000
Aggregated Statistics For Year 2000(Based on 3 full tracts) A) Conventional B) Refinancings Number Average Value Number Average Value
LOANS ORIGINATED 25 $160,800 1 $192,000 APPLICATIONS APPROVED, NOT ACCEPTED 0 $0 0 $0 APPLICATIONS DENIED 3 $194,667 0 $0 APPLICATIONS WITHDRAWN 1 $77,000 0 $0 FILES CLOSED FOR INCOMPLETENESS 1 $97,000 0 $0
Aggregated Statistics For Year 1999(Based on 4 full and 1 partial tracts) A) Conventional B) Refinancings C) Non-occupant Loans on Number Average Value Number Average Value Number Average Value
LOANS ORIGINATED 38 $167,906 9 $185,148 0 $0 APPLICATIONS APPROVED, NOT ACCEPTED 4 $148,618 4 $183,042 0 $0 APPLICATIONS DENIED 0 $0 2 $179,960 1 $135,000 APPLICATIONS WITHDRAWN 0 $0 1 $101,910 0 $0 FILES CLOSED FOR INCOMPLETENESS 0 $0 0 $0 0 $0
Detailed PMIC statistics for the following Tracts:
2015.04
, 2017.01 , 2017.02 , 2018.00 , 2019.00
Most common first names in Muskego, WI among deceased individuals Name Count Lived (average)
John 76 75.8 years Robert 69 72.1 years William 51 78.0 years Edward 47 80.6 years George 45 77.6 years Dorothy 40 80.0 years Ruth 39 82.8 years Joseph 36 77.4 years Frank 35 80.4 years Mary 35 81.3 years
Most common last names in Muskego, WI among deceased individuals Last name Count Lived (average)
Miller 20 78.9 years Schneider 14 71.9 years Schmidt 12 70.4 years Schultz 10 78.2 years Johnson 9 80.1 years Anderson 9 74.7 years Meyer 9 82.2 years Martin 9 79.3 years Wollman 8 89.0 years Olson 8 79.9 years
Muskego compared to Wisconsin state average:
Median household income above state average. Median house value above state average. Unemployed percentage significantly below state average. Black race population percentage significantly below state average. Renting percentage below state average. Length of stay since moving in above state average. House age below state average. Percentage of population with a bachelor's degree or higher above state average.
Top Patent Applicants
John A. Krueger (20)
Jeroen Valensa (11)
Lucas Boesel (8)
Robert F. Lloyd (8)
John R. Schneiker (8)
Randall E. Hammer (7)
Jesse Marcelle (7)
Gregory J. Shuler (7)
Darin Robert Okerlund (6)
Melissa Drechsel Kidd (6)
Total of 293 patent applications in 2008-2024.


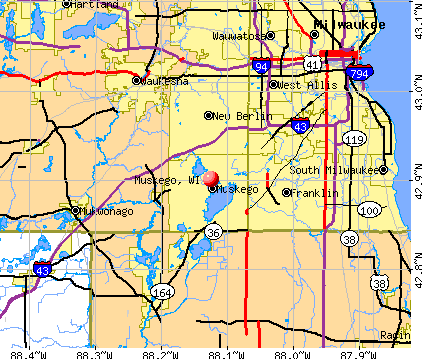


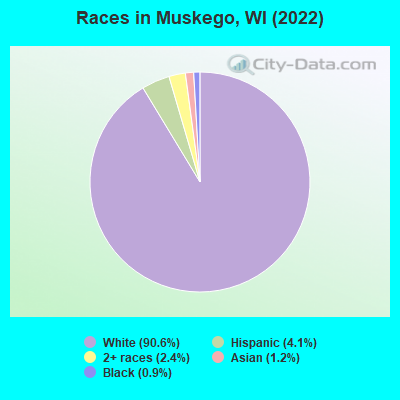
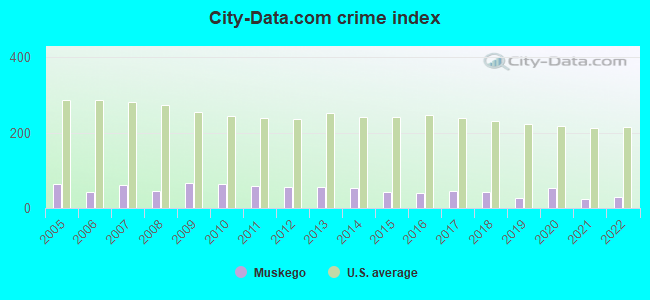
 Recent articles from our blog. Our writers, many of them Ph.D. graduates or candidates, create easy-to-read articles on a wide variety of topics.

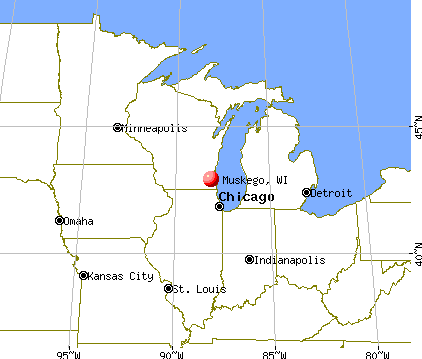
 (9.1 miles
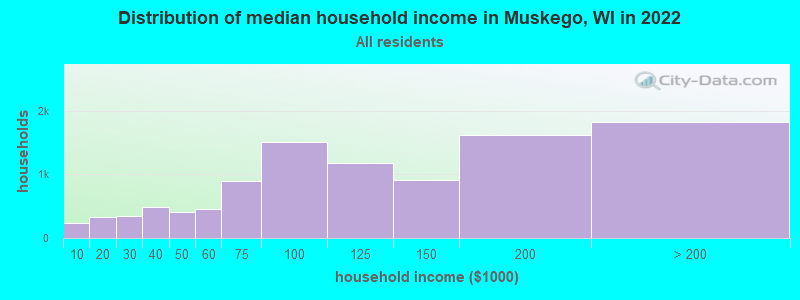
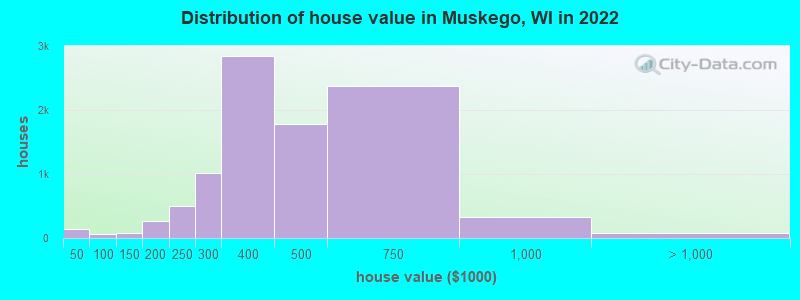
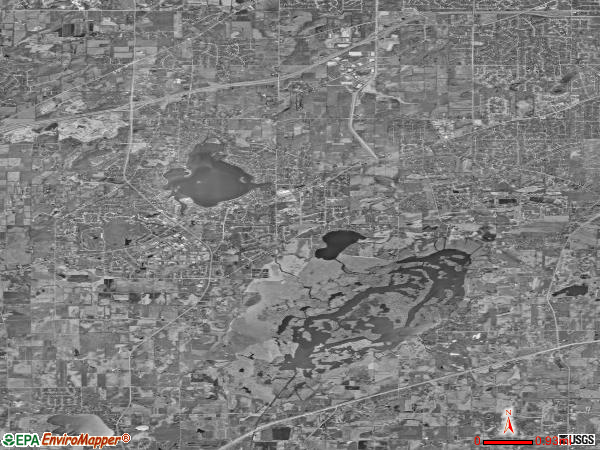
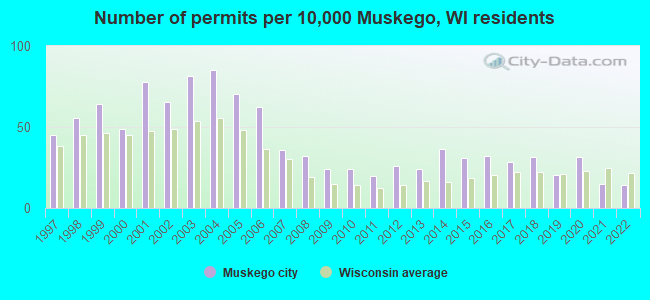
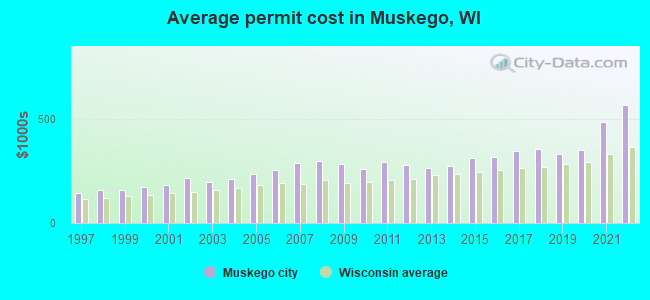
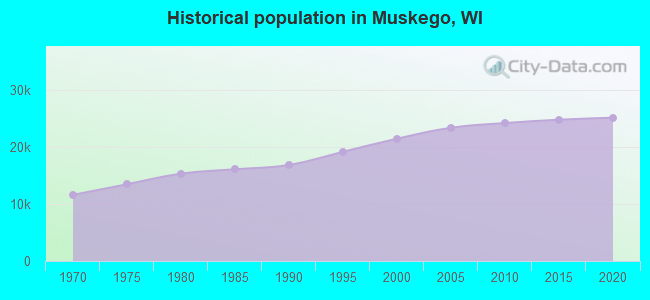
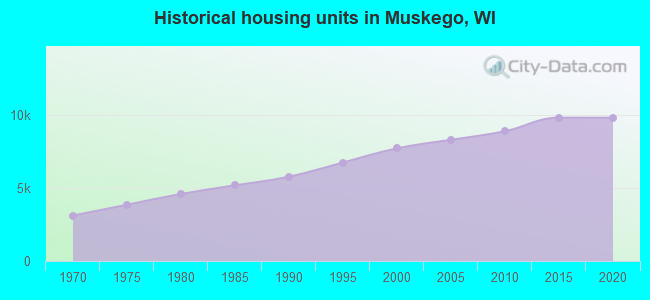
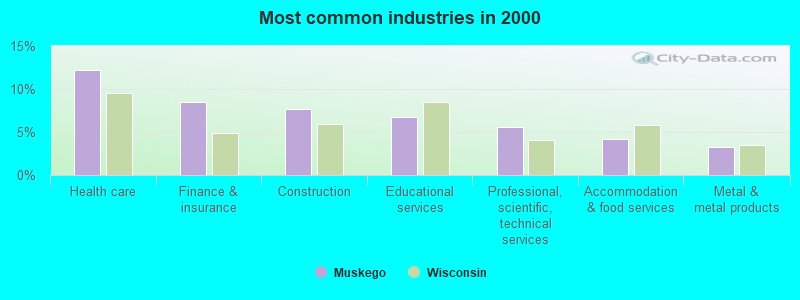
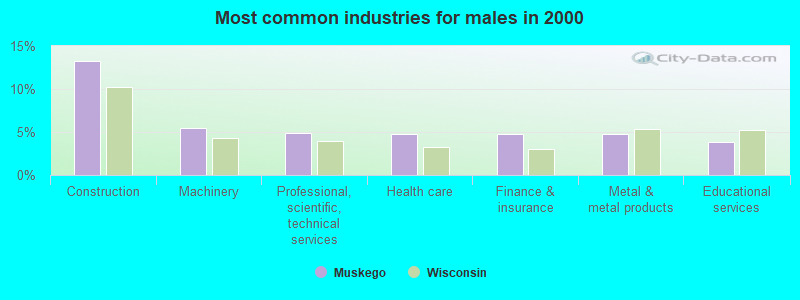
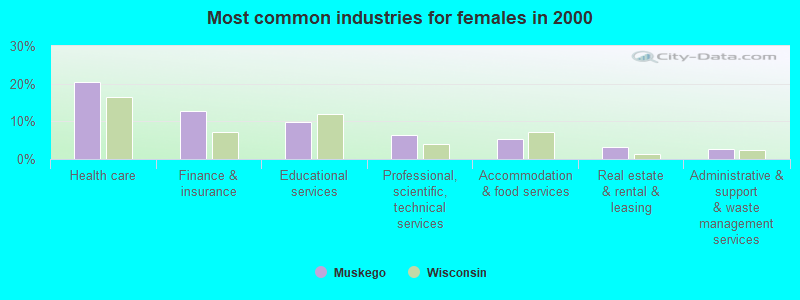
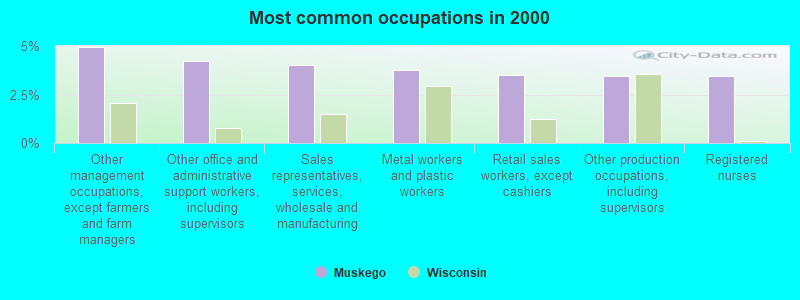
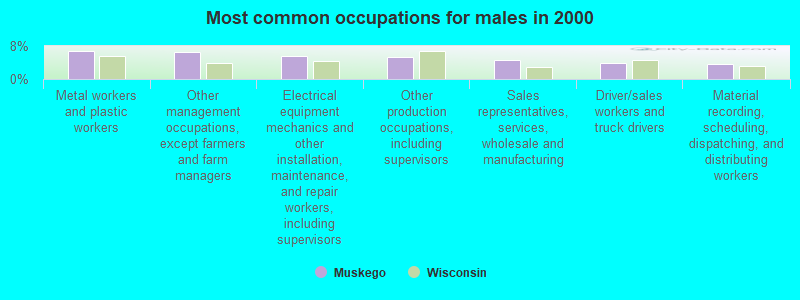
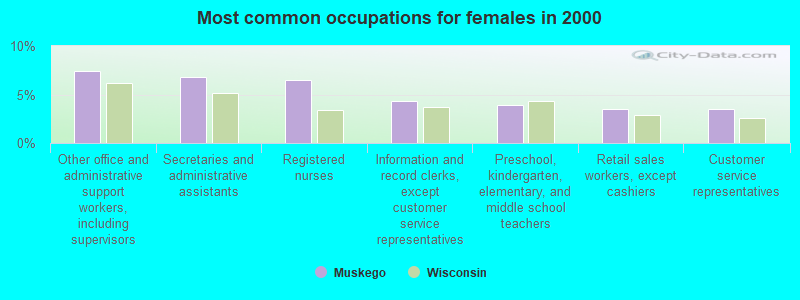
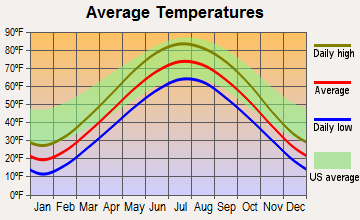
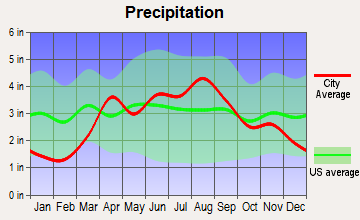
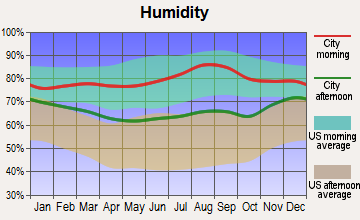
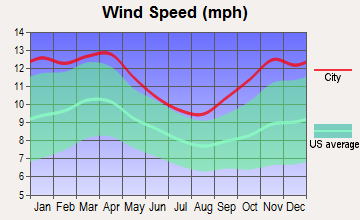
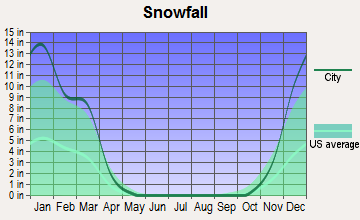
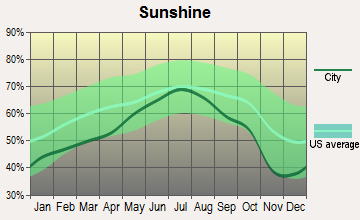
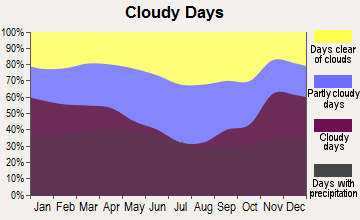


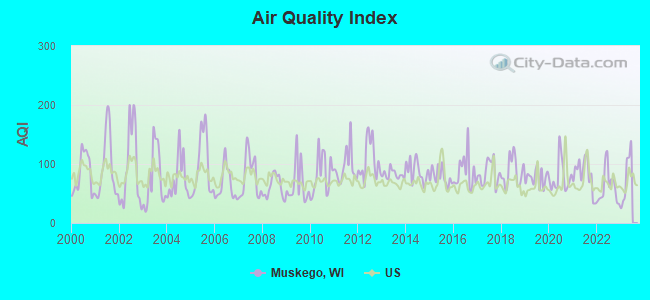
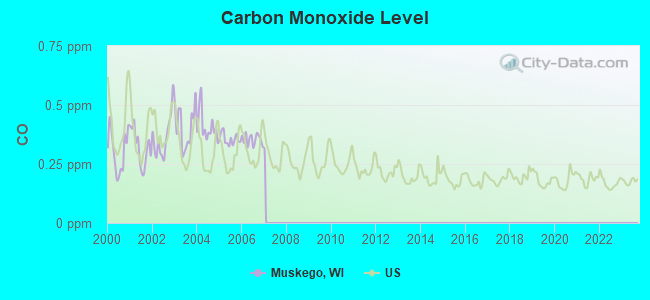
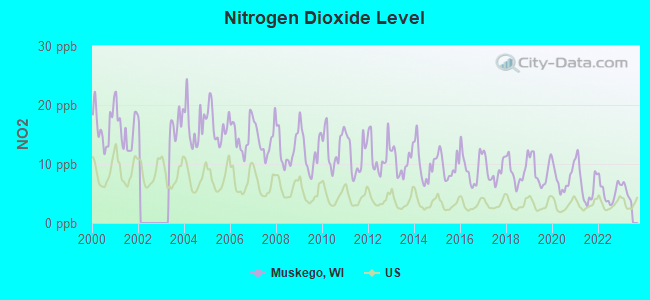
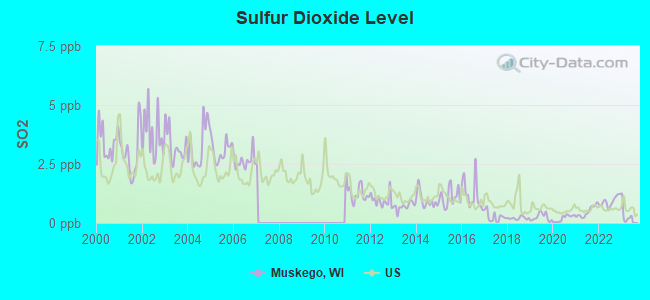
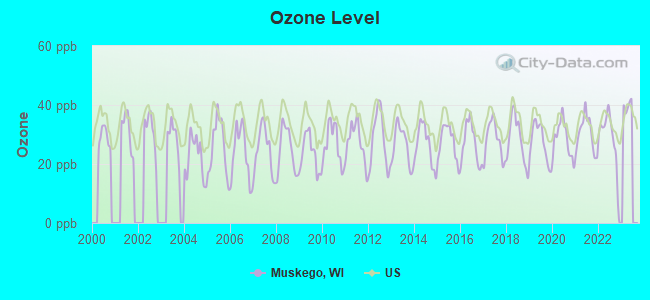
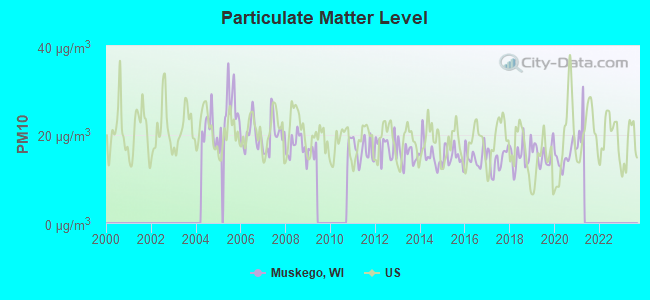
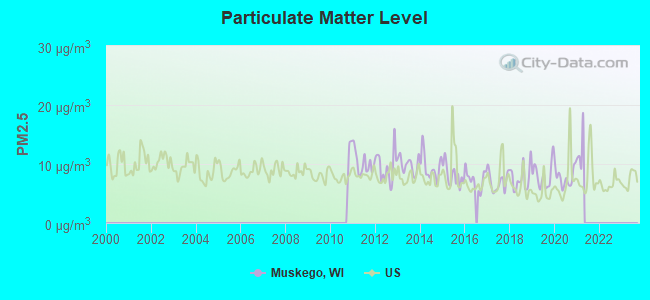
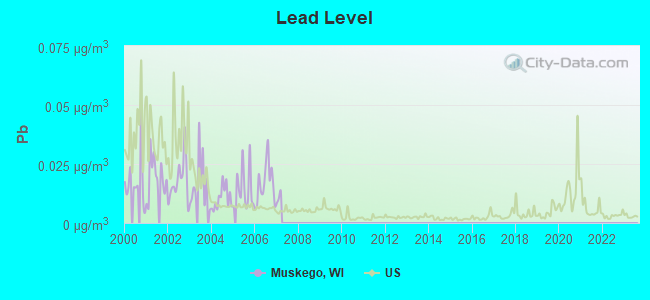
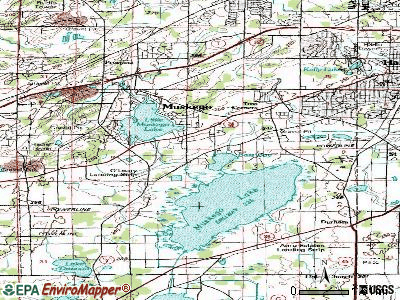
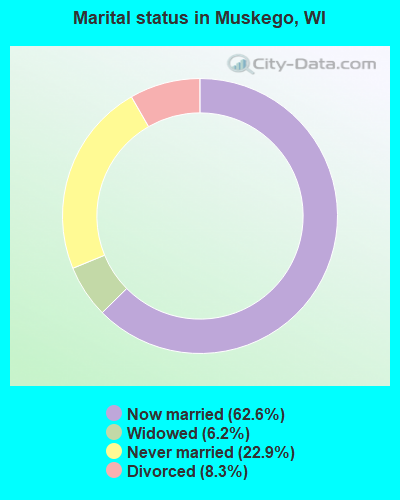
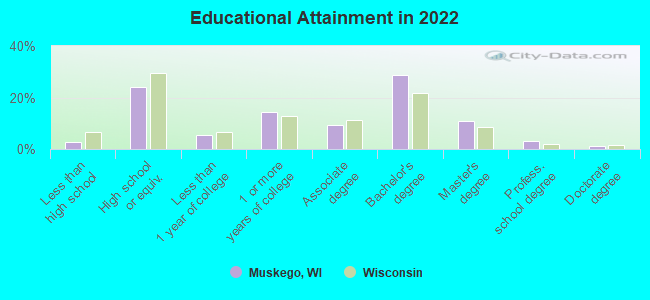
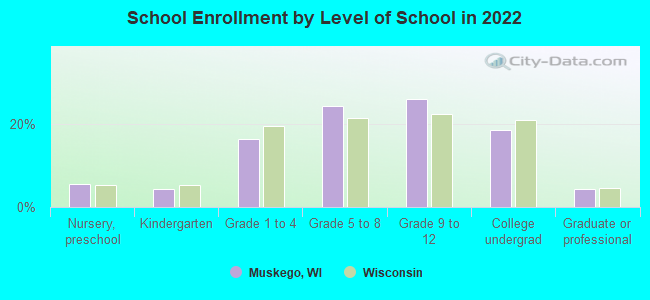
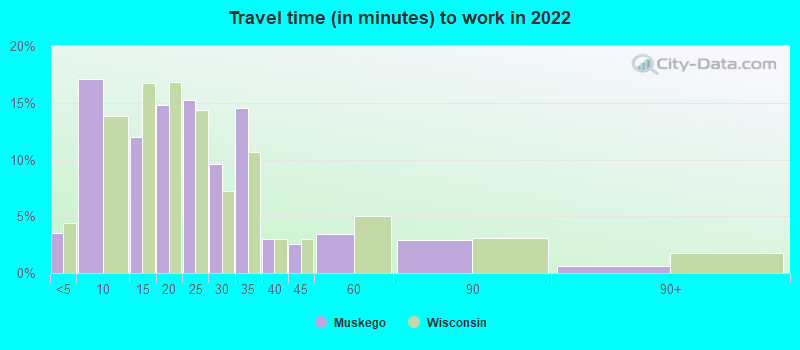
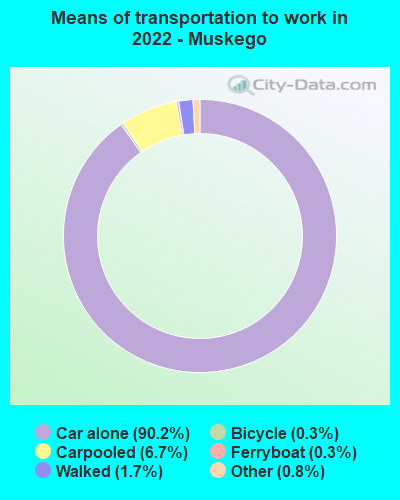
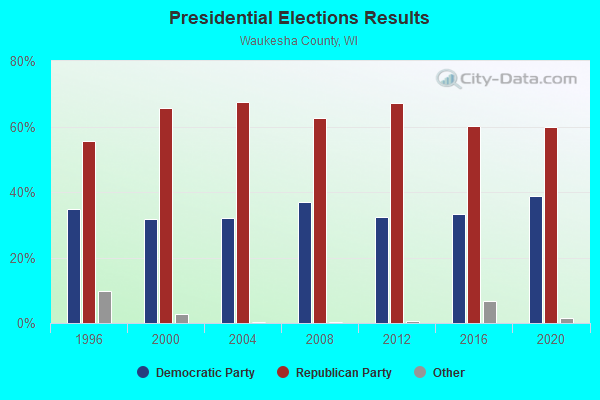
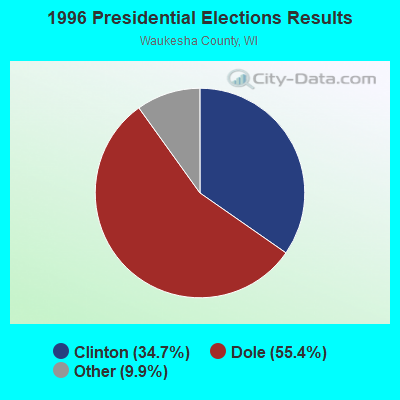
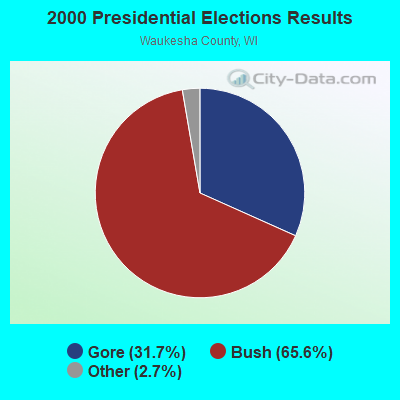
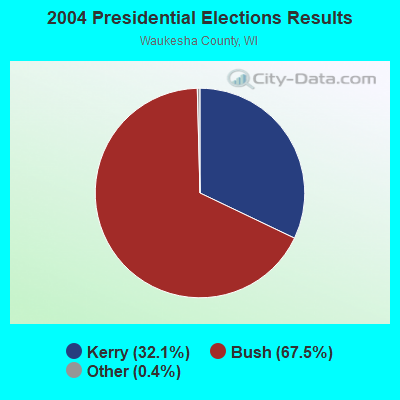
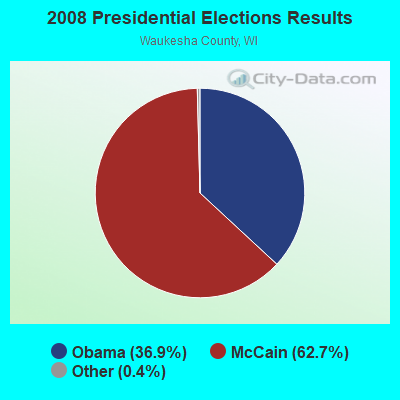

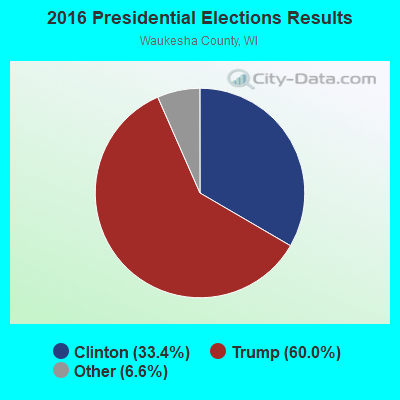
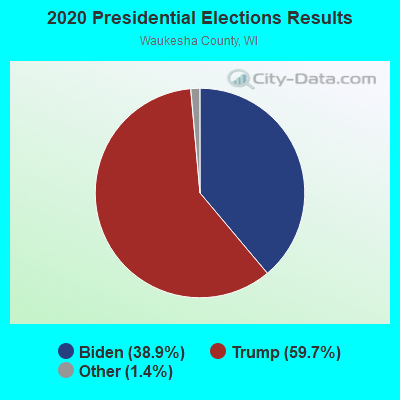
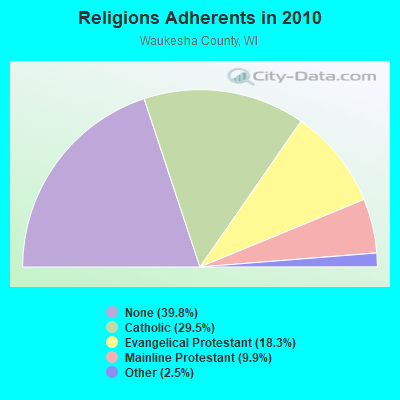
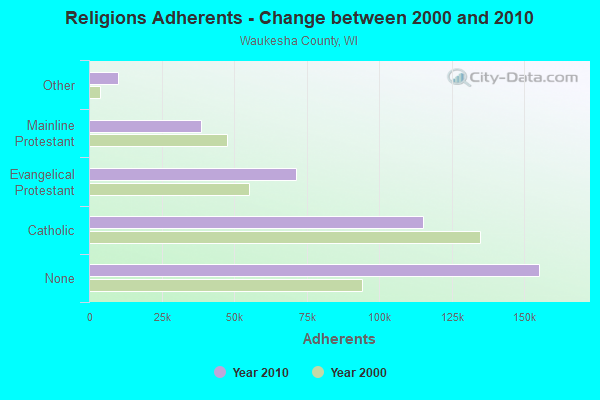
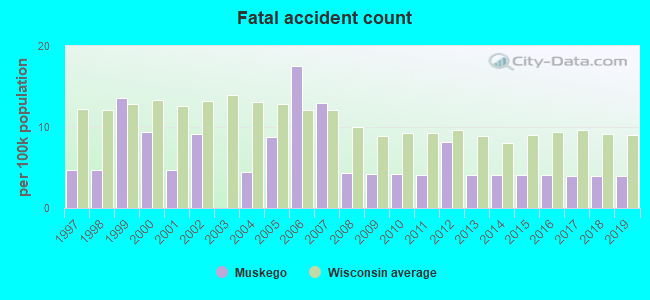
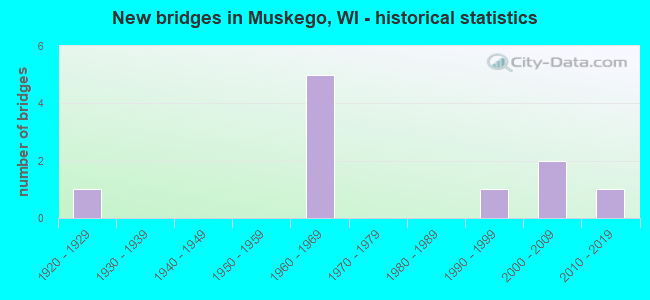
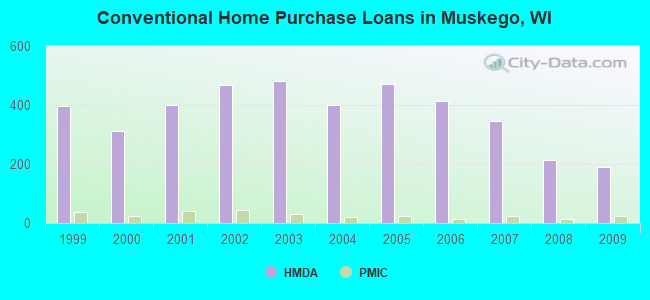
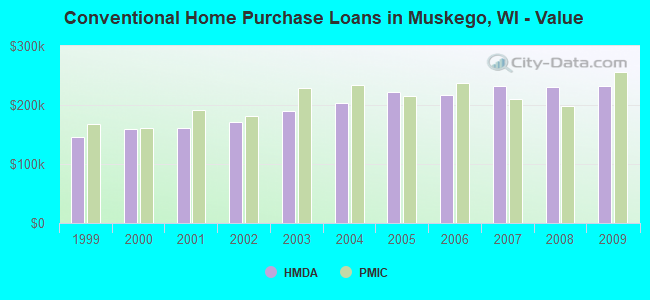
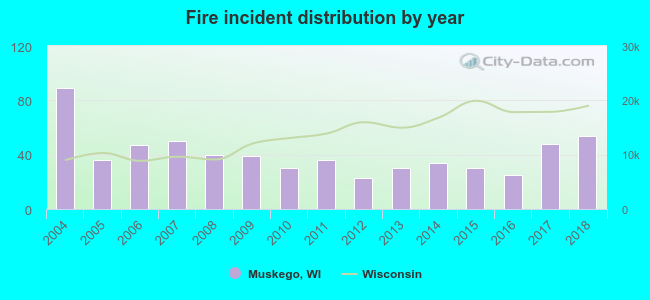 According to the data from the years 2004 - 2018 the average number of fires per year is 41. The highest number of reported fires - 89 took place in 2004, and the least - 23 in 2012. The data has a dropping trend.
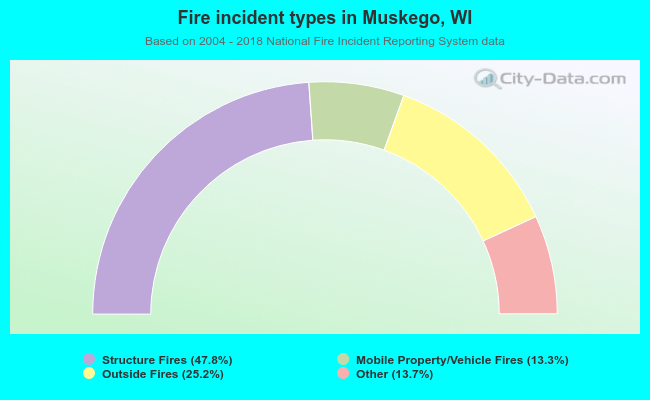 When looking into fire subcategories, the most incidents belonged to: Structure Fires (47.8%), and Outside Fires (25.2%).