New Berlin, Wisconsin Submit your own pictures of this city and show them to the world
OSM Map
General Map
Google Map
MSN Map
OSM Map
General Map
Google Map
MSN Map
OSM Map
General Map
Google Map
MSN Map
OSM Map
General Map
Google Map
MSN Map
Please wait while loading the map...
Population in 2022: 40,315 (95% urban, 5% rural). Population change since 2000: +5.5%Males: 20,412 Females: 19,903
March 2022 cost of living index in New Berlin: 98.9 (near average, U.S. average is 100) Percentage of residents living in poverty in 2022: 3.5%for White Non-Hispanic residents , 20.0% for Black residents , 0.5% for Hispanic or Latino residents , 2.6% for two or more races residents )
Profiles of local businesses
Business Search - 14 Million verified businesses
Data:
Median household income ($)
Median household income (% change since 2000)
Household income diversity
Ratio of average income to average house value (%)
Ratio of average income to average rent
Median household income ($) - White
Median household income ($) - Black or African American
Median household income ($) - Asian
Median household income ($) - Hispanic or Latino
Median household income ($) - American Indian and Alaska Native
Median household income ($) - Multirace
Median household income ($) - Other Race
Median household income for houses/condos with a mortgage ($)
Median household income for apartments without a mortgage ($)
Races - White alone (%)
Races - White alone (% change since 2000)
Races - Black alone (%)
Races - Black alone (% change since 2000)
Races - American Indian alone (%)
Races - American Indian alone (% change since 2000)
Races - Asian alone (%)
Races - Asian alone (% change since 2000)
Races - Hispanic (%)
Races - Hispanic (% change since 2000)
Races - Native Hawaiian and Other Pacific Islander alone (%)
Races - Native Hawaiian and Other Pacific Islander alone (% change since 2000)
Races - Two or more races (%)
Races - Two or more races (% change since 2000)
Races - Other race alone (%)
Races - Other race alone (% change since 2000)
Racial diversity
Unemployment (%)
Unemployment (% change since 2000)
Unemployment (%) - White
Unemployment (%) - Black or African American
Unemployment (%) - Asian
Unemployment (%) - Hispanic or Latino
Unemployment (%) - American Indian and Alaska Native
Unemployment (%) - Multirace
Unemployment (%) - Other Race
Population density (people per square mile)
Population - Males (%)
Population - Females (%)
Population - Males (%) - White
Population - Males (%) - Black or African American
Population - Males (%) - Asian
Population - Males (%) - Hispanic or Latino
Population - Males (%) - American Indian and Alaska Native
Population - Males (%) - Multirace
Population - Males (%) - Other Race
Population - Females (%) - White
Population - Females (%) - Black or African American
Population - Females (%) - Asian
Population - Females (%) - Hispanic or Latino
Population - Females (%) - American Indian and Alaska Native
Population - Females (%) - Multirace
Population - Females (%) - Other Race
Coronavirus confirmed cases (Apr 27, 2024)
Deaths caused by coronavirus (Apr 27, 2024)
Coronavirus confirmed cases (per 100k population) (Apr 27, 2024)
Deaths caused by coronavirus (per 100k population) (Apr 27, 2024)
Daily increase in number of cases (Apr 27, 2024)
Weekly increase in number of cases (Apr 27, 2024)
Cases doubled (in days) (Apr 27, 2024)
Hospitalized patients (Apr 18, 2022)
Negative test results (Apr 18, 2022)
Total test results (Apr 18, 2022)
COVID Vaccine doses distributed (per 100k population) (Sep 19, 2023)
COVID Vaccine doses administered (per 100k population) (Sep 19, 2023)
COVID Vaccine doses distributed (Sep 19, 2023)
COVID Vaccine doses administered (Sep 19, 2023)
Likely homosexual households (%)
Likely homosexual households (% change since 2000)
Likely homosexual households - Lesbian couples (%)
Likely homosexual households - Lesbian couples (% change since 2000)
Likely homosexual households - Gay men (%)
Likely homosexual households - Gay men (% change since 2000)
Cost of living index
Median gross rent ($)
Median contract rent ($)
Median monthly housing costs ($)
Median house or condo value ($)
Median house or condo value ($ change since 2000)
Mean house or condo value by units in structure - 1, detached ($)
Mean house or condo value by units in structure - 1, attached ($)
Mean house or condo value by units in structure - 2 ($)
Mean house or condo value by units in structure by units in structure - 3 or 4 ($)
Mean house or condo value by units in structure - 5 or more ($)
Mean house or condo value by units in structure - Boat, RV, van, etc. ($)
Mean house or condo value by units in structure - Mobile home ($)
Median house or condo value ($) - White
Median house or condo value ($) - Black or African American
Median house or condo value ($) - Asian
Median house or condo value ($) - Hispanic or Latino
Median house or condo value ($) - American Indian and Alaska Native
Median house or condo value ($) - Multirace
Median house or condo value ($) - Other Race
Median resident age
Resident age diversity
Median resident age - Males
Median resident age - Females
Median resident age - White
Median resident age - Black or African American
Median resident age - Asian
Median resident age - Hispanic or Latino
Median resident age - American Indian and Alaska Native
Median resident age - Multirace
Median resident age - Other Race
Median resident age - Males - White
Median resident age - Males - Black or African American
Median resident age - Males - Asian
Median resident age - Males - Hispanic or Latino
Median resident age - Males - American Indian and Alaska Native
Median resident age - Males - Multirace
Median resident age - Males - Other Race
Median resident age - Females - White
Median resident age - Females - Black or African American
Median resident age - Females - Asian
Median resident age - Females - Hispanic or Latino
Median resident age - Females - American Indian and Alaska Native
Median resident age - Females - Multirace
Median resident age - Females - Other Race
Commute - mean travel time to work (minutes)
Travel time to work - Less than 5 minutes (%)
Travel time to work - Less than 5 minutes (% change since 2000)
Travel time to work - 5 to 9 minutes (%)
Travel time to work - 5 to 9 minutes (% change since 2000)
Travel time to work - 10 to 19 minutes (%)
Travel time to work - 10 to 19 minutes (% change since 2000)
Travel time to work - 20 to 29 minutes (%)
Travel time to work - 20 to 29 minutes (% change since 2000)
Travel time to work - 30 to 39 minutes (%)
Travel time to work - 30 to 39 minutes (% change since 2000)
Travel time to work - 40 to 59 minutes (%)
Travel time to work - 40 to 59 minutes (% change since 2000)
Travel time to work - 60 to 89 minutes (%)
Travel time to work - 60 to 89 minutes (% change since 2000)
Travel time to work - 90 or more minutes (%)
Travel time to work - 90 or more minutes (% change since 2000)
Marital status - Never married (%)
Marital status - Now married (%)
Marital status - Separated (%)
Marital status - Widowed (%)
Marital status - Divorced (%)
Median family income ($)
Median family income (% change since 2000)
Median non-family income ($)
Median non-family income (% change since 2000)
Median per capita income ($)
Median per capita income (% change since 2000)
Median family income ($) - White
Median family income ($) - Black or African American
Median family income ($) - Asian
Median family income ($) - Hispanic or Latino
Median family income ($) - American Indian and Alaska Native
Median family income ($) - Multirace
Median family income ($) - Other Race
Median year house/condo built
Median year apartment built
Year house built - Built 2005 or later (%)
Year house built - Built 2000 to 2004 (%)
Year house built - Built 1990 to 1999 (%)
Year house built - Built 1980 to 1989 (%)
Year house built - Built 1970 to 1979 (%)
Year house built - Built 1960 to 1969 (%)
Year house built - Built 1950 to 1959 (%)
Year house built - Built 1940 to 1949 (%)
Year house built - Built 1939 or earlier (%)
Average household size
Household density (households per square mile)
Average household size - White
Average household size - Black or African American
Average household size - Asian
Average household size - Hispanic or Latino
Average household size - American Indian and Alaska Native
Average household size - Multirace
Average household size - Other Race
Occupied housing units (%)
Vacant housing units (%)
Owner occupied housing units (%)
Renter occupied housing units (%)
Vacancy status - For rent (%)
Vacancy status - For sale only (%)
Vacancy status - Rented or sold, not occupied (%)
Vacancy status - For seasonal, recreational, or occasional use (%)
Vacancy status - For migrant workers (%)
Vacancy status - Other vacant (%)
Residents with income below the poverty level (%)
Residents with income below 50% of the poverty level (%)
Children below poverty level (%)
Poor families by family type - Married-couple family (%)
Poor families by family type - Male, no wife present (%)
Poor families by family type - Female, no husband present (%)
Poverty status for native-born residents (%)
Poverty status for foreign-born residents (%)
Poverty among high school graduates not in families (%)
Poverty among people who did not graduate high school not in families (%)
Residents with income below the poverty level (%) - White
Residents with income below the poverty level (%) - Black or African American
Residents with income below the poverty level (%) - Asian
Residents with income below the poverty level (%) - Hispanic or Latino
Residents with income below the poverty level (%) - American Indian and Alaska Native
Residents with income below the poverty level (%) - Multirace
Residents with income below the poverty level (%) - Other Race
Air pollution - Air Quality Index (AQI)
Air pollution - CO
Air pollution - NO2
Air pollution - SO2
Air pollution - Ozone
Air pollution - PM10
Air pollution - PM25
Air pollution - Pb
Crime - Murders per 100,000 population
Crime - Rapes per 100,000 population
Crime - Robberies per 100,000 population
Crime - Assaults per 100,000 population
Crime - Burglaries per 100,000 population
Crime - Thefts per 100,000 population
Crime - Auto thefts per 100,000 population
Crime - Arson per 100,000 population
Crime - City-data.com crime index
Crime - Violent crime index
Crime - Property crime index
Crime - Murders per 100,000 population (5 year average)
Crime - Rapes per 100,000 population (5 year average)
Crime - Robberies per 100,000 population (5 year average)
Crime - Assaults per 100,000 population (5 year average)
Crime - Burglaries per 100,000 population (5 year average)
Crime - Thefts per 100,000 population (5 year average)
Crime - Auto thefts per 100,000 population (5 year average)
Crime - Arson per 100,000 population (5 year average)
Crime - City-data.com crime index (5 year average)
Crime - Violent crime index (5 year average)
Crime - Property crime index (5 year average)
1996 Presidential Elections Results (%) - Democratic Party (Clinton)
1996 Presidential Elections Results (%) - Republican Party (Dole)
1996 Presidential Elections Results (%) - Other
2000 Presidential Elections Results (%) - Democratic Party (Gore)
2000 Presidential Elections Results (%) - Republican Party (Bush)
2000 Presidential Elections Results (%) - Other
2004 Presidential Elections Results (%) - Democratic Party (Kerry)
2004 Presidential Elections Results (%) - Republican Party (Bush)
2004 Presidential Elections Results (%) - Other
2008 Presidential Elections Results (%) - Democratic Party (Obama)
2008 Presidential Elections Results (%) - Republican Party (McCain)
2008 Presidential Elections Results (%) - Other
2012 Presidential Elections Results (%) - Democratic Party (Obama)
2012 Presidential Elections Results (%) - Republican Party (Romney)
2012 Presidential Elections Results (%) - Other
2016 Presidential Elections Results (%) - Democratic Party (Clinton)
2016 Presidential Elections Results (%) - Republican Party (Trump)
2016 Presidential Elections Results (%) - Other
2020 Presidential Elections Results (%) - Democratic Party (Biden)
2020 Presidential Elections Results (%) - Republican Party (Trump)
2020 Presidential Elections Results (%) - Other
Ancestries Reported - Arab (%)
Ancestries Reported - Czech (%)
Ancestries Reported - Danish (%)
Ancestries Reported - Dutch (%)
Ancestries Reported - English (%)
Ancestries Reported - French (%)
Ancestries Reported - French Canadian (%)
Ancestries Reported - German (%)
Ancestries Reported - Greek (%)
Ancestries Reported - Hungarian (%)
Ancestries Reported - Irish (%)
Ancestries Reported - Italian (%)
Ancestries Reported - Lithuanian (%)
Ancestries Reported - Norwegian (%)
Ancestries Reported - Polish (%)
Ancestries Reported - Portuguese (%)
Ancestries Reported - Russian (%)
Ancestries Reported - Scotch-Irish (%)
Ancestries Reported - Scottish (%)
Ancestries Reported - Slovak (%)
Ancestries Reported - Subsaharan African (%)
Ancestries Reported - Swedish (%)
Ancestries Reported - Swiss (%)
Ancestries Reported - Ukrainian (%)
Ancestries Reported - United States (%)
Ancestries Reported - Welsh (%)
Ancestries Reported - West Indian (%)
Ancestries Reported - Other (%)
Educational Attainment - No schooling completed (%)
Educational Attainment - Less than high school (%)
Educational Attainment - High school or equivalent (%)
Educational Attainment - Less than 1 year of college (%)
Educational Attainment - 1 or more years of college (%)
Educational Attainment - Associate degree (%)
Educational Attainment - Bachelor's degree (%)
Educational Attainment - Master's degree (%)
Educational Attainment - Professional school degree (%)
Educational Attainment - Doctorate degree (%)
School Enrollment - Nursery, preschool (%)
School Enrollment - Kindergarten (%)
School Enrollment - Grade 1 to 4 (%)
School Enrollment - Grade 5 to 8 (%)
School Enrollment - Grade 9 to 12 (%)
School Enrollment - College undergrad (%)
School Enrollment - Graduate or professional (%)
School Enrollment - Not enrolled in school (%)
School enrollment - Public schools (%)
School enrollment - Private schools (%)
School enrollment - Not enrolled (%)
Median number of rooms in houses and condos
Median number of rooms in apartments
Housing units lacking complete plumbing facilities (%)
Housing units lacking complete kitchen facilities (%)
Density of houses
Urban houses (%)
Rural houses (%)
Households with people 60 years and over (%)
Households with people 65 years and over (%)
Households with people 75 years and over (%)
Households with one or more nonrelatives (%)
Households with no nonrelatives (%)
Population in households (%)
Family households (%)
Nonfamily households (%)
Population in families (%)
Family households with own children (%)
Median number of bedrooms in owner occupied houses
Mean number of bedrooms in owner occupied houses
Median number of bedrooms in renter occupied houses
Mean number of bedrooms in renter occupied houses
Median number of vehichles in owner occupied houses
Mean number of vehichles in owner occupied houses
Median number of vehichles in renter occupied houses
Mean number of vehichles in renter occupied houses
Mortgage status - with mortgage (%)
Mortgage status - with second mortgage (%)
Mortgage status - with home equity loan (%)
Mortgage status - with both second mortgage and home equity loan (%)
Mortgage status - without a mortgage (%)
Average family size
Average family size - White
Average family size - Black or African American
Average family size - Asian
Average family size - Hispanic or Latino
Average family size - American Indian and Alaska Native
Average family size - Multirace
Average family size - Other Race
Geographical mobility - Same house 1 year ago (%)
Geographical mobility - Moved within same county (%)
Geographical mobility - Moved from different county within same state (%)
Geographical mobility - Moved from different state (%)
Geographical mobility - Moved from abroad (%)
Place of birth - Born in state of residence (%)
Place of birth - Born in other state (%)
Place of birth - Native, outside of US (%)
Place of birth - Foreign born (%)
Housing units in structures - 1, detached (%)
Housing units in structures - 1, attached (%)
Housing units in structures - 2 (%)
Housing units in structures - 3 or 4 (%)
Housing units in structures - 5 to 9 (%)
Housing units in structures - 10 to 19 (%)
Housing units in structures - 20 to 49 (%)
Housing units in structures - 50 or more (%)
Housing units in structures - Mobile home (%)
Housing units in structures - Boat, RV, van, etc. (%)
House/condo owner moved in on average (years ago)
Renter moved in on average (years ago)
Year householder moved into unit - Moved in 1999 to March 2000 (%)
Year householder moved into unit - Moved in 1995 to 1998 (%)
Year householder moved into unit - Moved in 1990 to 1994 (%)
Year householder moved into unit - Moved in 1980 to 1989 (%)
Year householder moved into unit - Moved in 1970 to 1979 (%)
Year householder moved into unit - Moved in 1969 or earlier (%)
Means of transportation to work - Drove car alone (%)
Means of transportation to work - Carpooled (%)
Means of transportation to work - Public transportation (%)
Means of transportation to work - Bus or trolley bus (%)
Means of transportation to work - Streetcar or trolley car (%)
Means of transportation to work - Subway or elevated (%)
Means of transportation to work - Railroad (%)
Means of transportation to work - Ferryboat (%)
Means of transportation to work - Taxicab (%)
Means of transportation to work - Motorcycle (%)
Means of transportation to work - Bicycle (%)
Means of transportation to work - Walked (%)
Means of transportation to work - Other means (%)
Working at home (%)
Industry diversity
Most Common Industries - Agriculture, forestry, fishing and hunting, and mining (%)
Most Common Industries - Agriculture, forestry, fishing and hunting (%)
Most Common Industries - Mining, quarrying, and oil and gas extraction (%)
Most Common Industries - Construction (%)
Most Common Industries - Manufacturing (%)
Most Common Industries - Wholesale trade (%)
Most Common Industries - Retail trade (%)
Most Common Industries - Transportation and warehousing, and utilities (%)
Most Common Industries - Transportation and warehousing (%)
Most Common Industries - Utilities (%)
Most Common Industries - Information (%)
Most Common Industries - Finance and insurance, and real estate and rental and leasing (%)
Most Common Industries - Finance and insurance (%)
Most Common Industries - Real estate and rental and leasing (%)
Most Common Industries - Professional, scientific, and management, and administrative and waste management services (%)
Most Common Industries - Professional, scientific, and technical services (%)
Most Common Industries - Management of companies and enterprises (%)
Most Common Industries - Administrative and support and waste management services (%)
Most Common Industries - Educational services, and health care and social assistance (%)
Most Common Industries - Educational services (%)
Most Common Industries - Health care and social assistance (%)
Most Common Industries - Arts, entertainment, and recreation, and accommodation and food services (%)
Most Common Industries - Arts, entertainment, and recreation (%)
Most Common Industries - Accommodation and food services (%)
Most Common Industries - Other services, except public administration (%)
Most Common Industries - Public administration (%)
Occupation diversity
Most Common Occupations - Management, business, science, and arts occupations (%)
Most Common Occupations - Management, business, and financial occupations (%)
Most Common Occupations - Management occupations (%)
Most Common Occupations - Business and financial operations occupations (%)
Most Common Occupations - Computer, engineering, and science occupations (%)
Most Common Occupations - Computer and mathematical occupations (%)
Most Common Occupations - Architecture and engineering occupations (%)
Most Common Occupations - Life, physical, and social science occupations (%)
Most Common Occupations - Education, legal, community service, arts, and media occupations (%)
Most Common Occupations - Community and social service occupations (%)
Most Common Occupations - Legal occupations (%)
Most Common Occupations - Education, training, and library occupations (%)
Most Common Occupations - Arts, design, entertainment, sports, and media occupations (%)
Most Common Occupations - Healthcare practitioners and technical occupations (%)
Most Common Occupations - Health diagnosing and treating practitioners and other technical occupations (%)
Most Common Occupations - Health technologists and technicians (%)
Most Common Occupations - Service occupations (%)
Most Common Occupations - Healthcare support occupations (%)
Most Common Occupations - Protective service occupations (%)
Most Common Occupations - Fire fighting and prevention, and other protective service workers including supervisors (%)
Most Common Occupations - Law enforcement workers including supervisors (%)
Most Common Occupations - Food preparation and serving related occupations (%)
Most Common Occupations - Building and grounds cleaning and maintenance occupations (%)
Most Common Occupations - Personal care and service occupations (%)
Most Common Occupations - Sales and office occupations (%)
Most Common Occupations - Sales and related occupations (%)
Most Common Occupations - Office and administrative support occupations (%)
Most Common Occupations - Natural resources, construction, and maintenance occupations (%)
Most Common Occupations - Farming, fishing, and forestry occupations (%)
Most Common Occupations - Construction and extraction occupations (%)
Most Common Occupations - Installation, maintenance, and repair occupations (%)
Most Common Occupations - Production, transportation, and material moving occupations (%)
Most Common Occupations - Production occupations (%)
Most Common Occupations - Transportation occupations (%)
Most Common Occupations - Material moving occupations (%)
People in Group quarters - Institutionalized population (%)
People in Group quarters - Correctional institutions (%)
People in Group quarters - Federal prisons and detention centers (%)
People in Group quarters - Halfway houses (%)
People in Group quarters - Local jails and other confinement facilities (including police lockups) (%)
People in Group quarters - Military disciplinary barracks (%)
People in Group quarters - State prisons (%)
People in Group quarters - Other types of correctional institutions (%)
People in Group quarters - Nursing homes (%)
People in Group quarters - Hospitals/wards, hospices, and schools for the handicapped (%)
People in Group quarters - Hospitals/wards and hospices for chronically ill (%)
People in Group quarters - Hospices or homes for chronically ill (%)
People in Group quarters - Military hospitals or wards for chronically ill (%)
People in Group quarters - Other hospitals or wards for chronically ill (%)
People in Group quarters - Hospitals or wards for drug/alcohol abuse (%)
People in Group quarters - Mental (Psychiatric) hospitals or wards (%)
People in Group quarters - Schools, hospitals, or wards for the mentally retarded (%)
People in Group quarters - Schools, hospitals, or wards for the physically handicapped (%)
People in Group quarters - Institutions for the deaf (%)
People in Group quarters - Institutions for the blind (%)
People in Group quarters - Orthopedic wards and institutions for the physically handicapped (%)
People in Group quarters - Wards in general hospitals for patients who have no usual home elsewhere (%)
People in Group quarters - Wards in military hospitals for patients who have no usual home elsewhere (%)
People in Group quarters - Juvenile institutions (%)
People in Group quarters - Long-term care (%)
People in Group quarters - Homes for abused, dependent, and neglected children (%)
People in Group quarters - Residential treatment centers for emotionally disturbed children (%)
People in Group quarters - Training schools for juvenile delinquents (%)
People in Group quarters - Short-term care, detention or diagnostic centers for delinquent children (%)
People in Group quarters - Type of juvenile institution unknown (%)
People in Group quarters - Noninstitutionalized population (%)
People in Group quarters - College dormitories (includes college quarters off campus) (%)
People in Group quarters - Military quarters (%)
People in Group quarters - On base (%)
People in Group quarters - Barracks, unaccompanied personnel housing (UPH), (Enlisted/Officer), ;and similar group living quarters for military personnel (%)
People in Group quarters - Transient quarters for temporary residents (%)
People in Group quarters - Military ships (%)
People in Group quarters - Group homes (%)
People in Group quarters - Homes or halfway houses for drug/alcohol abuse (%)
People in Group quarters - Homes for the mentally ill (%)
People in Group quarters - Homes for the mentally retarded (%)
People in Group quarters - Homes for the physically handicapped (%)
People in Group quarters - Other group homes (%)
People in Group quarters - Religious group quarters (%)
People in Group quarters - Dormitories (%)
People in Group quarters - Agriculture workers' dormitories on farms (%)
People in Group quarters - Job Corps and vocational training facilities (%)
People in Group quarters - Other workers' dormitories (%)
People in Group quarters - Crews of maritime vessels (%)
People in Group quarters - Other nonhousehold living situations (%)
People in Group quarters - Other noninstitutional group quarters (%)
Residents speaking English at home (%)
Residents speaking English at home - Born in the United States (%)
Residents speaking English at home - Native, born elsewhere (%)
Residents speaking English at home - Foreign born (%)
Residents speaking Spanish at home (%)
Residents speaking Spanish at home - Born in the United States (%)
Residents speaking Spanish at home - Native, born elsewhere (%)
Residents speaking Spanish at home - Foreign born (%)
Residents speaking other language at home (%)
Residents speaking other language at home - Born in the United States (%)
Residents speaking other language at home - Native, born elsewhere (%)
Residents speaking other language at home - Foreign born (%)
Class of Workers - Employee of private company (%)
Class of Workers - Self-employed in own incorporated business (%)
Class of Workers - Private not-for-profit wage and salary workers (%)
Class of Workers - Local government workers (%)
Class of Workers - State government workers (%)
Class of Workers - Federal government workers (%)
Class of Workers - Self-employed workers in own not incorporated business and Unpaid family workers (%)
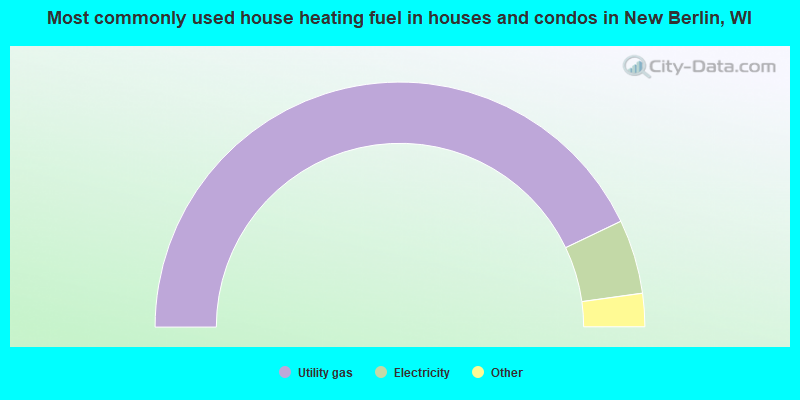
House heating fuel used in houses and condos - Utility gas (%)
House heating fuel used in houses and condos - Bottled, tank, or LP gas (%)
House heating fuel used in houses and condos - Electricity (%)
House heating fuel used in houses and condos - Fuel oil, kerosene, etc. (%)
House heating fuel used in houses and condos - Coal or coke (%)
House heating fuel used in houses and condos - Wood (%)
House heating fuel used in houses and condos - Solar energy (%)
House heating fuel used in houses and condos - Other fuel (%)
House heating fuel used in houses and condos - No fuel used (%)
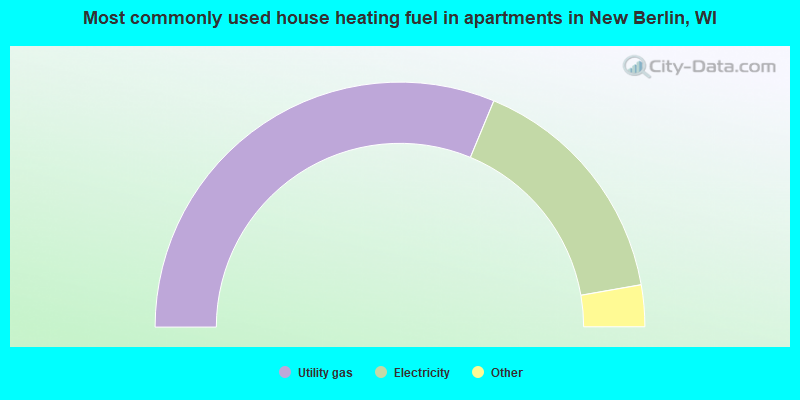
House heating fuel used in apartments - Utility gas (%)
House heating fuel used in apartments - Bottled, tank, or LP gas (%)
House heating fuel used in apartments - Electricity (%)
House heating fuel used in apartments - Fuel oil, kerosene, etc. (%)
House heating fuel used in apartments - Coal or coke (%)
House heating fuel used in apartments - Wood (%)
House heating fuel used in apartments - Solar energy (%)
House heating fuel used in apartments - Other fuel (%)
House heating fuel used in apartments - No fuel used (%)
Armed forces status - In Armed Forces (%)
Armed forces status - Civilian (%)
Armed forces status - Civilian - Veteran (%)
Armed forces status - Civilian - Nonveteran (%)
Fatal accidents locations in years 2005-2021
Fatal accidents locations in 2005
Fatal accidents locations in 2006
Fatal accidents locations in 2007
Fatal accidents locations in 2008
Fatal accidents locations in 2009
Fatal accidents locations in 2010
Fatal accidents locations in 2011
Fatal accidents locations in 2012
Fatal accidents locations in 2013
Fatal accidents locations in 2014
Fatal accidents locations in 2015
Fatal accidents locations in 2016
Fatal accidents locations in 2017
Fatal accidents locations in 2018
Fatal accidents locations in 2019
Fatal accidents locations in 2020
Fatal accidents locations in 2021
Alcohol use - People drinking some alcohol every month (%)
Alcohol use - People not drinking at all (%)
Alcohol use - Average days/month drinking alcohol
Alcohol use - Average drinks/week
Alcohol use - Average days/year people drink much
Audiometry - Average condition of hearing (%)
Audiometry - People that can hear a whisper from across a quiet room (%)
Audiometry - People that can hear normal voice from across a quiet room (%)
Audiometry - Ears ringing, roaring, buzzing (%)
Audiometry - Had a job exposure to loud noise (%)
Audiometry - Had off-work exposure to loud noise (%)
Blood Pressure & Cholesterol - Has high blood pressure (%)
Blood Pressure & Cholesterol - Checking blood pressure at home (%)
Blood Pressure & Cholesterol - Frequently checking blood cholesterol (%)
Blood Pressure & Cholesterol - Has high cholesterol level (%)
Consumer Behavior - Money monthly spent on food at supermarket/grocery store
Consumer Behavior - Money monthly spent on food at other stores
Consumer Behavior - Money monthly spent on eating out
Consumer Behavior - Money monthly spent on carryout/delivered foods
Consumer Behavior - Income spent on food at supermarket/grocery store (%)
Consumer Behavior - Income spent on food at other stores (%)
Consumer Behavior - Income spent on eating out (%)
Consumer Behavior - Income spent on carryout/delivered foods (%)
Current Health Status - General health condition (%)
Current Health Status - Blood donors (%)
Current Health Status - Has blood ever tested for HIV virus (%)
Current Health Status - Left-handed people (%)
Dermatology - People using sunscreen (%)
Diabetes - Diabetics (%)
Diabetes - Had a blood test for high blood sugar (%)
Diabetes - People taking insulin (%)
Diet Behavior & Nutrition - Diet health (%)
Diet Behavior & Nutrition - Milk product consumption (# of products/month)
Diet Behavior & Nutrition - Meals not home prepared (#/week)
Diet Behavior & Nutrition - Meals from fast food or pizza place (#/week)
Diet Behavior & Nutrition - Ready-to-eat foods (#/month)
Diet Behavior & Nutrition - Frozen meals/pizza (#/month)
Drug Use - People that ever used marijuana or hashish (%)
Drug Use - Ever used hard drugs (%)
Drug Use - Ever used any form of cocaine (%)
Drug Use - Ever used heroin (%)
Drug Use - Ever used methamphetamine (%)
Health Insurance - People covered by health insurance (%)
Kidney Conditions-Urology - Avg. # of times urinating at night
Medical Conditions - People with asthma (%)
Medical Conditions - People with anemia (%)
Medical Conditions - People with psoriasis (%)
Medical Conditions - People with overweight (%)
Medical Conditions - Elderly people having difficulties in thinking or remembering (%)
Medical Conditions - People who ever received blood transfusion (%)
Medical Conditions - People having trouble seeing even with glass/contacts (%)
Medical Conditions - People with arthritis (%)
Medical Conditions - People with gout (%)
Medical Conditions - People with congestive heart failure (%)
Medical Conditions - People with coronary heart disease (%)
Medical Conditions - People with angina pectoris (%)
Medical Conditions - People who ever had heart attack (%)
Medical Conditions - People who ever had stroke (%)
Medical Conditions - People with emphysema (%)
Medical Conditions - People with thyroid problem (%)
Medical Conditions - People with chronic bronchitis (%)
Medical Conditions - People with any liver condition (%)
Medical Conditions - People who ever had cancer or malignancy (%)
Mental Health - People who have little interest in doing things (%)
Mental Health - People feeling down, depressed, or hopeless (%)
Mental Health - People who have trouble sleeping or sleeping too much (%)
Mental Health - People feeling tired or having little energy (%)
Mental Health - People with poor appetite or overeating (%)
Mental Health - People feeling bad about themself (%)
Mental Health - People who have trouble concentrating on things (%)
Mental Health - People moving or speaking slowly or too fast (%)
Mental Health - People having thoughts they would be better off dead (%)
Oral Health - Average years since last visit a dentist
Oral Health - People embarrassed because of mouth (%)
Oral Health - People with gum disease (%)
Oral Health - General health of teeth and gums (%)
Oral Health - Average days a week using dental floss/device
Oral Health - Average days a week using mouthwash for dental problem
Oral Health - Average number of teeth
Pesticide Use - Households using pesticides to control insects (%)
Pesticide Use - Households using pesticides to kill weeds (%)
Physical Activity - People doing vigorous-intensity work activities (%)
Physical Activity - People doing moderate-intensity work activities (%)
Physical Activity - People walking or bicycling (%)
Physical Activity - People doing vigorous-intensity recreational activities (%)
Physical Activity - People doing moderate-intensity recreational activities (%)
Physical Activity - Average hours a day doing sedentary activities
Physical Activity - Average hours a day watching TV or videos
Physical Activity - Average hours a day using computer
Physical Functioning - People having limitations keeping them from working (%)
Physical Functioning - People limited in amount of work they can do (%)
Physical Functioning - People that need special equipment to walk (%)
Physical Functioning - People experiencing confusion/memory problems (%)
Physical Functioning - People requiring special healthcare equipment (%)
Prescription Medications - Average number of prescription medicines taking
Preventive Aspirin Use - Adults 40+ taking low-dose aspirin (%)
Reproductive Health - Vaginal deliveries (%)
Reproductive Health - Cesarean deliveries (%)
Reproductive Health - Deliveries resulted in a live birth (%)
Reproductive Health - Pregnancies resulted in a delivery (%)
Reproductive Health - Women breastfeeding newborns (%)
Reproductive Health - Women that had a hysterectomy (%)
Reproductive Health - Women that had both ovaries removed (%)
Reproductive Health - Women that have ever taken birth control pills (%)
Reproductive Health - Women taking birth control pills (%)
Reproductive Health - Women that have ever used Depo-Provera or injectables (%)
Reproductive Health - Women that have ever used female hormones (%)
Sexual Behavior - People 18+ that ever had sex (vaginal, anal, or oral) (%)
Sexual Behavior - Males 18+ that ever had vaginal sex with a woman (%)
Sexual Behavior - Males 18+ that ever performed oral sex on a woman (%)
Sexual Behavior - Males 18+ that ever had anal sex with a woman (%)
Sexual Behavior - Males 18+ that ever had any sex with a man (%)
Sexual Behavior - Females 18+ that ever had vaginal sex with a man (%)
Sexual Behavior - Females 18+ that ever performed oral sex on a man (%)
Sexual Behavior - Females 18+ that ever had anal sex with a man (%)
Sexual Behavior - Females 18+ that ever had any kind of sex with a woman (%)
Sexual Behavior - Average age people first had sex
Sexual Behavior - Average number of female sex partners in lifetime (males 18+)
Sexual Behavior - Average number of female vaginal sex partners in lifetime (males 18+)
Sexual Behavior - Average age people first performed oral sex on a woman (18+)
Sexual Behavior - Average number of woman performed oral sex on in lifetime (18+)
Sexual Behavior - Average number of male sex partners in lifetime (males 18+)
Sexual Behavior - Average number of male anal sex partners in lifetime (males 18+)
Sexual Behavior - Average age people first performed oral sex on a man (18+)
Sexual Behavior - Average number of male oral sex partners in lifetime (18+)
Sexual Behavior - People using protection when performing oral sex (%)
Sexual Behavior - Average number of times people have vaginal or anal sex a year
Sexual Behavior - People having sex without condom (%)
Sexual Behavior - Average number of male sex partners in lifetime (females 18+)
Sexual Behavior - Average number of male vaginal sex partners in lifetime (females 18+)
Sexual Behavior - Average number of female sex partners in lifetime (females 18+)
Sexual Behavior - Circumcised males 18+ (%)
Sleep Disorders - Average hours sleeping at night
Sleep Disorders - People that has trouble sleeping (%)
Smoking-Cigarette Use - People smoking cigarettes (%)
Taste & Smell - People 40+ having problems with smell (%)
Taste & Smell - People 40+ having problems with taste (%)
Taste & Smell - People 40+ that ever had wisdom teeth removed (%)
Taste & Smell - People 40+ that ever had tonsils teeth removed (%)
Taste & Smell - People 40+ that ever had a loss of consciousness because of a head injury (%)
Taste & Smell - People 40+ that ever had a broken nose or other serious injury to face or skull (%)
Taste & Smell - People 40+ that ever had two or more sinus infections (%)
Weight - Average height (inches)
Weight - Average weight (pounds)
Weight - Average BMI
Weight - People that are obese (%)
Weight - People that ever were obese (%)
Weight - People trying to lose weight (%)
According to our research of Wisconsin and other state lists, there were 30 registered sex offenders living in New Berlin, Wisconsin as of April 27, 2024 . The ratio of all residents to sex offenders in New Berlin is 1,332 to 1.The ratio of registered sex offenders to all residents in this city is much lower than the state average.
Officers per 1,000 residents here:
1.76Wisconsin average:
2.07
Latest news from New Berlin, WI collected exclusively by city-data.com from local newspapers, TV, and radio stations
Ancestries: German (35.3%), Polish (11.4%), American (5.9%), Irish (4.3%), European (4.0%), Norwegian (3.2%).
Current Local Time:
Land area: 36.8 square miles.
Population density: 1,094 people per square mile (low).
2,523 residents are foreign born (3.7% Asia , 1.5% Europe , 0.7% Latin America ).
This city:
6.2%Wisconsin:
5.0%
Median real estate property taxes paid for housing units with mortgages in 2022: $4,214 (1.2%)Median real estate property taxes paid for housing units with no mortgage in 2022: $4,112 (1.3%)
Nearest city with pop. 50,000+: West Allis, WI
Nearest city with pop. 200,000+: Milwaukee, WI
Nearest city with pop. 1,000,000+: Chicago, IL
Nearest cities:
Latitude: 42.98 N, Longitude: 88.11 W
Nickname or alias (official or unofficial): City Living with a Touch of Country., New Bizzle, New Beezy
Daytime population change due to commuting: +2,667 (+6.6%)Workers who live and work in this city: 5,392 (25.8%)
Area code commonly used in this area: 262
Single-family new house construction building permits:
2022: 18 buildings , average cost: $600,7002021: 33 buildings , average cost: $598,5002020: 28 buildings , average cost: $487,4002019: 40 buildings , average cost: $463,0002018: 74 buildings , average cost: $393,9002017: 23 buildings , average cost: $479,0002016: 18 buildings , average cost: $448,2002015: 21 buildings , average cost: $377,4002014: 31 buildings , average cost: $317,0002013: 43 buildings , average cost: $313,4002012: 21 buildings , average cost: $423,7002011: 16 buildings , average cost: $381,9002010: 25 buildings , average cost: $437,9002009: 20 buildings , average cost: $357,0002008: 38 buildings , average cost: $352,9002007: 51 buildings , average cost: $356,5002006: 97 buildings , average cost: $290,6002005: 47 buildings , average cost: $211,8002004: 33 buildings , average cost: $219,6002003: 72 buildings , average cost: $205,4002002: 64 buildings , average cost: $215,2002001: 74 buildings , average cost: $213,0002000: 120 buildings , average cost: $220,6001999: 205 buildings , average cost: $195,5001998: 201 buildings , average cost: $180,0001997: 113 buildings , average cost: $166,200Unemployment in December 2023:
Population change in the 1990s: +4,549 (+13.5%).
Most common occupations in New Berlin, WI (%)
Both Males Females
Other office and administrative support workers, including supervisors (5.1%)
Sales representatives, services, wholesale and manufacturing (4.9%)
Other management occupations, except farmers and farm managers (4.5%)
Computer specialists (3.8%)
Other sales and related occupations, including supervisors (3.7%)
Secretaries and administrative assistants (3.5%)
Preschool, kindergarten, elementary, and middle school teachers (3.1%)
Sales representatives, services, wholesale and manufacturing (6.2%)
Other management occupations, except farmers and farm managers (5.8%)
Top executives (4.5%)
Other production occupations, including supervisors (4.2%)
Engineers (4.0%)
Other sales and related occupations, including supervisors (3.8%)
Electrical equipment mechanics and other installation, maintenance, and repair workers, including supervisors (3.8%)
Other office and administrative support workers, including supervisors (8.2%)
Secretaries and administrative assistants (7.2%)
Registered nurses (5.6%)
Preschool, kindergarten, elementary, and middle school teachers (5.6%)
Computer specialists (3.9%)
Retail sales workers, except cashiers (3.8%)
Other sales and related occupations, including supervisors (3.5%)
Tornado activity:
New Berlin-area historical tornado activity is slightly above Wisconsin state average. It is 28% greater than the overall U.S. average.
On 4/27/1984, a category F4 (max. wind speeds 207-260 mph) tornado 8.4 miles away from the New Berlin city center killed one person and injured 14 people and caused between $500,000 and $5,000,000 in damages.
On 6/5/1977, a category F3 (max. wind speeds 158-206 mph) tornado 4.1 miles away from the city center injured 8 people and caused between $500,000 and $5,000,000 in damages.
Earthquake activity:
New Berlin-area historical earthquake activity is significantly above Wisconsin state average. It is 14% greater than the overall U.S. average. On 4/18/2008 at 09:36:59, a magnitude 5.4 (5.1 MB, 4.8 MS, 5.4 MW, 5.2 MW, Class: Moderate, Intensity: VI - VII) earthquake occurred 313.3 miles away from New Berlin center On 6/28/2004 at 06:10:52, a magnitude 4.2 (4.2 MW, Depth: 6.2 mi, Class: Light, Intensity: IV - V) earthquake occurred 112.6 miles away from the city center On 6/10/1987 at 23:48:54, a magnitude 5.1 (4.9 MB, 4.4 MS, 4.6 MS, 5.1 LG) earthquake occurred 287.8 miles away from New Berlin center On 4/18/2008 at 09:36:59, a magnitude 5.2 (5.2 MW, Depth: 8.9 mi) earthquake occurred 313.4 miles away from New Berlin center On 5/2/2015 at 16:23:07, a magnitude 4.2 (4.2 MW, Depth: 2.8 mi) earthquake occurred 145.8 miles away from the city center On 2/10/2010 at 09:59:35, a magnitude 3.8 (3.8 MW, Depth: 6.2 mi, Class: Light, Intensity: II - III) earthquake occurred 72.6 miles away from the city center Magnitude types: regional Lg-wave magnitude (LG), body-wave magnitude (MB), surface-wave magnitude (MS), moment magnitude (MW) Natural disasters: The number of natural disasters in Waukesha County (16) is near the US average (15).Major Disasters (Presidential) Declared: 12Emergencies Declared: 4Storms: 11, Floods: 9, Tornadoes: 2, Drought: 1, Hurricane: 1, Snow: 1, Wind: 1, Winter Storm: 1, Other: 1 (Note: some incidents may be assigned to more than one category). Main business address for: MERCHANTS & MANUFACTURERS BANCORPORATION INC STATE COMMERCIAL BANKS ).
Hospitals and medical centers in New Berlin: NEW BERLIN MEMORIAL HOSPITAL (13750 WEST NATIONAL AVENUE) LINDENGROVE NEW BERLIN (13755 W FIELDPOINTE DR)
Other hospitals and medical centers near New Berlin: AURORA VISITING NURSE ASSOCIATION OF WI (Home Health Center, about 3 miles away; MILWAUKEE, WI)
HOME HEALTH SERVICES INC (Home Health Center, about 4 miles away; MILWAUKEE, WI)
CHARTER BEHAVRL HLTH SYS OF WI/W ALLIS (Hospital, about 4 miles away; WEST ALLIS, WI)
CPC GREENBRIAR HOSPITAL (Hospital, about 4 miles away; GREENFIELD, WI)
KINDRED HSPTL MILWAUKEE (Hospital, about 4 miles away; GREENFIELD, WI)
SURGICENTER OF GREATER MILW (Hospital, about 4 miles away; MILWAUKEE, WI)
PROF HOMECARE SVCS (Home Health Center, about 4 miles away; WEST ALLIS, WI)
Airports located in New Berlin: Amtrak station near New Berlin: 11 miles: MILWAUKEE (433 W. ST. PAUL AVE.) Services: ticket office, fully wheelchair accessible, enclosed waiting area, public restrooms, public payphones, full-service food facilities, paid short-term parking, paid long-term parking, call for car rental service, taxi stand, public transit connection.
Colleges/universities with over 2000 students nearest to New Berlin:
Carroll University (about 7 miles; Waukesha, WI ; Full-time enrollment: 3,313)
Waukesha County Technical College (about 10 miles; Pewaukee, WI ; FT enrollment: 4,415)
Marquette University (about 11 miles; Milwaukee, WI ; FT enrollment: 9,844)
Milwaukee Area Technical College (about 11 miles; Milwaukee, WI ; FT enrollment: 13,156)
Milwaukee School of Engineering (about 12 miles; Milwaukee, WI ; FT enrollment: 2,386)
University of Wisconsin-Milwaukee (about 14 miles; Milwaukee, WI ; FT enrollment: 24,196)
Cardinal Stritch University (about 16 miles; Milwaukee, WI ; FT enrollment: 3,595)
Public high schools in New Berlin:
Public elementary/middle schools in New Berlin: RONALD REAGAN ELEMENTARY Students: 667, Location: 4225 S CALHOUN RD, Grades: PK-6)POPLAR CREEK ELEMENTARY Students: 500, Location: 17401 W CLEVELAND AVE, Grades: PK-6)ELMWOOD ELEMENTARY Students: 499, Location: 5900 S SUNNYSLOPE RD, Grades: PK-6)HOOVER ELEMENTARY Students: 428, Location: 12705 W EUCLID AVE, Grades: PK-5)ORCHARD LANE ELEMENTARY Students: 335, Location: 2015 S SUNNYSLOPE RD, Grades: PK-6)Private elementary/middle schools in New Berlin: HOLY APOSTLES SCHOOL Students: 411, Location: 3875 S 159TH ST, Grades: PK-8)
STAR OF BETHLEHEM LUTHERAN SCHOOL Students: 181, Location: 3700 S CASPER DR, Grades: PK-8)
See full list of schools located in New Berlin Library in New Berlin: NEW BERLIN PUBLIC LIBRARY Operating income: $1,261,135; Location: 15105 LIBRARY LANE; 136,494 books ; 10,778 audio materials ; 10,956 video materials ; 9 local licensed databases ; 28 state licensed databases ; 267 print serial subscriptions ; 6 electronic serial subscriptions )
Notable locations in New Berlin: (A) , Patterson Orchard (B) , Moorland Park Industrial Park (C) , New Berlin Industrial Park (D) , New Berlin Hills Golf Course (E) , New Berlin Fire Department Station 3 (F) , New Berlin Fire Department Station 4 (G) , New Berlin Fire Department Station 5 (H) , Shady Acres Perennial Nursery (I) , New Berlin Public Library (J) , New Berlin Fire Department Station 2 (K) , New Berlin Fire Department Station 1 (L) , New Berlin City Hall (M) , Brookfield Fire Department Station 3 (N) . Display/hide their locations on the map
Shopping Centers: (1) , New Berlin Plaza Shopping Center (2) . Display/hide their locations on the map
Main business address in New Berlin: (A) . Display/hide its location on the map
Church in New Berlin: (A) . Display/hide its location on the map
Cemeteries: (1) , Highland Memorial Park (2) , Sunnyside Cemetery (3) , Saint Pauls Lutheran Cemetery (4) , Holy Apostles Cemetery (5) . Display/hide their locations on the map
Lakes: (A) , Linie Lac (B) , Lower Kelly Lake (C) . Display/hide their locations on the map
Parks in New Berlin include: (1) , Calhoun Park (2) , Gatewood Park (3) , Regal Park (4) , Valley View Park (5) , Lions Park (6) , Fountain Square Nature Area (7) , John J Malone Park (8) . Display/hide their locations on the map
Hotels: (1) , Holiday Inn Exp Ste New Berlin (15451 West Beloit) (2) , La Quinta Inn Milwaukee SW-NewBerlin (15300 West Rock Ridge Road) (3) , Bridgestreet Worldwide Corporate Housing (2105 South Clubhouse Drive) (4) . Display/hide their approximate locations on the map
Birthplace of: Jason Chappell - College basketball player (Wisconsin Badgers), John Chappell - College basketball player (South Carolina Gamecocks).
Waukesha County has a predicted average indoor radon screening level greater than 4 pCi/L (pico curies per liter) - Highest Potential Drinking water stations with addresses in New Berlin and their reported violations in the past:
WESTBROOK WESLEYAN CHURCH (Population served: 201, Groundwater):
Past health violations:
MCL, Monthly (TCR) - In MAR-2005, Contaminant: Coliform. Follow-up actions: St Violation/Reminder Notice (MAR-07-2005), St Public Notif received (MAR-23-2005), St Compliance achieved (MAR-23-2005), St Public Notif requested (MAR-27-2005), St Boil Water Order (MAR-27-2005)
Population served: 53, Groundwater):
Past health violations:
MCL, Monthly (TCR) - In MAY-2012, Contaminant: Coliform. Follow-up actions: St Public Notif requested (MAY-02-2012), St Boil Water Order (MAY-02-2012), St Violation/Reminder Notice (MAY-02-2012), St Public Notif received (MAY-08-2012), St Public Notif issued (MAY-08-2012), St Compliance achieved (MAY-25-2012)
MCL, Monthly (TCR) - In MAR-2012, Contaminant: Coliform. Follow-up actions: St Public Notif requested (MAR-16-2012), St Boil Water Order (MAR-16-2012), St Violation/Reminder Notice (MAR-16-2012), St Public Notif issued (MAR-21-2012), St Public Notif received (MAR-21-2012), St Compliance achieved (APR-16-2012)
Drinking water stations with addresses in New Berlin that have no violations reported:
MOORLAND GOLF CENTER (Population served: 533, Primary Water Source Type: Groundwater)
POPLAR CREEK CHURCH & SCHOOL (Population served: 453, Primary Water Source Type: Groundwater)
PEACE LUTHERAN CHURCH (Population served: 262, Primary Water Source Type: Groundwater)
MUSTANG SHELLYS ROADHOUSE (Population served: 100, Primary Water Source Type: Groundwater)
RINDT CITGO (Population served: 78, Primary Water Source Type: Groundwater)
RICHYS (Population served: 52, Primary Water Source Type: Groundwater)
THE BRICK HOUSE (Population served: 50, Primary Water Source Type: Groundwater)
MATTYS BAR AND GRILL (Population served: 50, Primary Water Source Type: Groundwater)
RAINBOW RESTAURANT (Population served: 50, Primary Water Source Type: Groundwater)
PATCH WORK LTD (Population served: 35, Primary Water Source Type: Groundwater)
Average household size: This city:
2.4 peopleWisconsin:
2.4 people
Percentage of family households: This city:
69.5%Whole state:
64.4%
Percentage of households with unmarried partners: This city:
4.7%Whole state:
7.3%
Likely homosexual households (counted as self-reported same-sex unmarried-partner households)
Lesbian couples: 0.3% of all households Gay men: 0.2% of all households
People in group quarters in New Berlin in 2010:
125 people in nursing facilities/skilled-nursing facilities
26 people in group homes intended for adults
10 people in residential treatment centers for adults
people in nursing homes in 2000people in other noninstitutional group quarters in 2000Banks with most branches in New Berlin (2011 data):
BMO Harris Bank National Association: New Berlin Branch, New Berlin Wi Facility, Deer Creek Village Branch. Info updated 2011/07/14: Bank assets: $97,264.0 mil, Deposits: $75,624.6 mil, headquarters in Chicago, IL, positive income , 717 total offices , Holding Company: Bank Of Montreal
JPMorgan Chase Bank, National Association: New Berlin Branch at 15525 West National Avenue, branch established on 1960/01/04. Info updated 2011/11/10: Bank assets: $1,811,678.0 mil, Deposits: $1,190,738.0 mil, headquarters in Columbus, OH, positive income , International Specialization, 5577 total offices , Holding Company: Jpmorgan Chase & Co.
AnchorBank, fsb: 15600 W Cleveland Ave Branch at 15600 W Cleveland Ave, branch established on 1989/06/30. Info updated 2011/07/21: Bank assets: $3,067.4 mil, Deposits: $2,481.9 mil, headquarters in Madison, WI, negative income in the last year , Commercial Lending Specialization, 56 total offices
Guaranty Bank: New Berlin Branch at 15445 W National Ave, branch established on 2006/03/22. Info updated 2011/07/21: Bank assets: $1,179.1 mil, Deposits: $1,102.7 mil, headquarters in Milwaukee, WI, negative income in the last year , Mortgage Lending Specialization, 166 total offices
Mitchell Bank: New Berlin Branch at 12400 West National Avenue, branch established on 2003/11/03. Info updated 2006/11/03: Bank assets: $57.2 mil, Deposits: $48.5 mil, headquarters in Milwaukee, WI, negative income in the last year , Commercial Lending Specialization, 3 total offices , Holding Company: M.S. Investment Co.
U.S. Bank National Association: New Berlin Branch at 15305 West National Avenue, branch established on 1995/01/17. Info updated 2012/01/30: Bank assets: $330,470.8 mil, Deposits: $236,091.5 mil, headquarters in Cincinnati, OH, positive income , 3121 total offices , Holding Company: U.S. Bancorp
PNC Bank, National Association: New Berlin Branch at 3670 S Moorland, branch established on 1989/06/30. Info updated 2012/03/20: Bank assets: $263,309.6 mil, Deposits: $197,343.0 mil, headquarters in Wilmington, DE, positive income , Commercial Lending Specialization, 3085 total offices , Holding Company: Pnc Financial Services Group, Inc., The
Citizens Bank of Mukwonago: New Berlin Branch at 5450 South Moorland Road, branch established on 1999/12/13. Info updated 2006/11/03: Bank assets: $651.0 mil, Deposits: $577.4 mil, headquarters in Mukwonago, WI, positive income , Commercial Lending Specialization, 14 total offices , Holding Company: Citizens Bank Holding, Inc.
Wells Fargo Bank, National Association: New Berlin Branch at 16001 West Cleveland Avenue, branch established on 1992/01/01. Info updated 2011/04/05: Bank assets: $1,161,490.0 mil, Deposits: $905,653.0 mil, headquarters in Sioux Falls, SD, positive income , 6395 total offices , Holding Company: Wells Fargo & Company
4 other banks with 4 local branches
For population 15 years and over in New Berlin:
Never married: 22.7%Now married: 61.5%Separated: 0.4%Widowed: 6.4%Divorced: 9.0% For population 25 years and over in New Berlin:
High school or higher: 96.9%Bachelor's degree or higher: 46.0%Graduate or professional degree: 15.0%Unemployed: 2.8%Mean travel time to work (commute): 19.2 minutes
Education Gini index (Inequality in education) Here:
9.5Wisconsin average:
10.4
Religion statistics for New Berlin, WI (based on Waukesha County data)
Religion Adherents Congregations Catholic 115,008 28 Evangelical Protestant 71,237 128 Mainline Protestant 38,654 87 Other 9,840 29 None 155,152 -
Source: Clifford Grammich, Kirk Hadaway, Richard Houseal, Dale E.Jones, Alexei Krindatch, Richie Stanley and Richard H.Taylor. 2012. 2010 U.S.Religion Census: Religious Congregations & Membership Study. Association of Statisticians of American Religious Bodies. Jones, Dale E., et al. 2002. Congregations and Membership in the United States 2000. Nashville, TN: Glenmary Research Center. Graphs represent county-level data
Food Environment Statistics: Number of grocery stores : 57This county :
1.51 / 10,000 pop.Wisconsin :
1.86 / 10,000 pop.
Number of supercenters and club stores : 1This county :
0.03 / 10,000 pop.Wisconsin :
0.11 / 10,000 pop.
Number of convenience stores (no gas) : 5Waukesha County :
0.13 / 10,000 pop.Wisconsin :
0.38 / 10,000 pop.
Number of convenience stores (with gas) : 106Here :
2.80 / 10,000 pop.Wisconsin :
4.12 / 10,000 pop.
Number of full-service restaurants : 283Waukesha County :
7.47 / 10,000 pop.State :
8.64 / 10,000 pop.
Adult obesity rate : This county :
26.8%State :
27.5%
Low-income preschool obesity rate : Waukesha County :
13.2%State :
13.0%
Health and Nutrition: Healthy diet rate : Here:
54.5%Wisconsin:
49.5%
Average overall health of teeth and gums : New Berlin:
53.8%State:
46.6%
Average BMI : New Berlin:
28.3Wisconsin:
28.7
People feeling badly about themselves : New Berlin:
19.7%Wisconsin:
21.4%
People not drinking alcohol at all : New Berlin:
8.4%Wisconsin:
10.2%
Average hours sleeping at night : This city:
6.9Wisconsin:
6.8
Overweight people : New Berlin:
34.9%Wisconsin:
34.0%
General health condition : New Berlin:
61.1%Wisconsin:
56.3%
Average condition of hearing : New Berlin:
80.0%Wisconsin:
78.5%
More about Health and Nutrition of New Berlin, WI Residents
Local government employment and payroll (March 2022)
Function
Full-time employees
Monthly full-time payroll
Average yearly full-time wage
Part-time employees
Monthly part-time payroll
Police Protection - Officers
66 $489,623 $89,022 0 $0 Firefighters
36 $277,242 $92,414 8 $14,865 Streets and Highways
29 $160,863 $66,564 0 $0 Other Government Administration
18 $100,004 $66,669 9 $7,212 Police - Other
14 $88,645 $75,981 1 $2,496 Other and Unallocable
12 $63,275 $63,275 3 $6,762 Parks and Recreation
12 $60,162 $60,162 14 $4,184 Financial Administration
11 $72,438 $79,023 2 $4,668 Sewerage
10 $67,226 $80,671 1 $73 Water Supply
8 $55,822 $83,733 1 $73 Local Libraries
7 $38,901 $66,687 23 $31,817 Fire - Other
6 $48,781 $97,562 0 $0 Judicial and Legal
1 $5,649 $67,788 3 $6,642 Solid Waste Management
0 $0 3 $1,039
Totals for Government
230 $1,528,630 $79,755 68 $79,829
New Berlin government finances - Expenditure in 2021 (per resident):
Construction - Regular Highways: $4,632,000 ($114.90)
Parks and Recreation: $2,618,000 ($64.94)General Public Buildings: $2,409,000 ($59.75)Local Fire Protection: $1,451,000 ($35.99)Libraries: $281,000 ($6.97)Health - Other: $263,000 ($6.52)Police Protection: $201,000 ($4.99)Current Operations - Police Protection: $10,600,000 ($262.93)
Sewerage: $10,089,000 ($250.25)Local Fire Protection: $5,086,000 ($126.16)Water Utilities: $4,915,000 ($121.91)Regular Highways: $4,288,000 ($106.36)Central Staff Services: $2,205,000 ($54.69)Solid Waste Management: $1,920,000 ($47.62)Parks and Recreation: $1,653,000 ($41.00)Libraries: $1,653,000 ($41.00)Health - Other: $1,474,000 ($36.56)Financial Administration: $935,000 ($23.19)Natural Resources - Other: $707,000 ($17.54)General Public Buildings: $634,000 ($15.73)General - Other: $613,000 ($15.21)Protective Inspection and Regulation - Other: $535,000 ($13.27)Judicial and Legal Services: $456,000 ($11.31)General - Interest on Debt: $1,540,000 ($38.20)
Other Capital Outlay - Regular Highways: $966,000 ($23.96)
General - Other: $121,000 ($3.00)
New Berlin government finances - Revenue in 2021 (per resident):
Charges - Sewerage: $11,119,000 ($275.80)
Regular Highways: $1,784,000 ($44.25)Solid Waste Management: $1,777,000 ($44.08)Other: $1,750,000 ($43.41)Parks and Recreation: $249,000 ($6.18)Natural Resources - Other: $107,000 ($2.65)Federal Intergovernmental - Other: $261,000 ($6.47)
Health and Hospitals: $32,000 ($0.79)Local Intergovernmental - Other: $1,555,000 ($38.57)
Miscellaneous - General Revenue - Other: $813,000 ($20.17)
Interest Earnings: $406,000 ($10.07)Rents: $332,000 ($8.24)Fines and Forfeits: $287,000 ($7.12)Donations From Private Sources: $42,000 ($1.04)Sale of Property: $12,000 ($0.30)Special Assessments: $4,000 ($0.10)Revenue - Water Utilities: $4,366,000 ($108.30)
State Intergovernmental - Highways: $2,439,000 ($60.50)
General Local Government Support: $2,083,000 ($51.67)Education: $858,000 ($21.28)Other: $254,000 ($6.30)Tax - Property: $25,947,000 ($643.61)
Other License: $811,000 ($20.12)Occupation and Business License - Other: $602,000 ($14.93)Other Selective Sales: $175,000 ($4.34)
New Berlin government finances - Debt in 2021 (per resident):
Long Term Debt - Outstanding Unspecified Public Purpose: $59,075,000 ($1465.34)
Beginning Outstanding - Unspecified Public Purpose: $53,140,000 ($1318.12)Issue, Unspecified Public Purpose: $19,935,000 ($494.48)Retired Unspecified Public Purpose: $14,000,000 ($347.27)Short Term Debt Outstanding - End of Fiscal Year: $2,917,000 ($72.36)
Beginning: $1,944,000 ($48.22)
Businesses in New Berlin, WI
Name Count Name Count
AT&T 1 Penske 1 Applebee's 1 Pizza Hut 1 Buffalo Wild Wings 1 Qdoba Mexican Grill 1 Burger King 1 Quiznos 1 FedEx 6 Sprint Nextel 1 Firestone Complete Auto Care 1 Starbucks 1 H&R Block 1 T-Mobile 2 Holiday Inn 1 Taco Bell 1 Jimmy John's 1 Target 1 La Quinta 1 The Athlete's Foot 1 MasterBrand Cabinets 2 True Value 1 McDonald's 2 UPS 10 New Balance 2 Vans 1 Nike 8 Walmart 1 OfficeMax 1 Wendy's 1
Strongest AM radio stations in New Berlin:
WOKY (920 AM; 5 kW; MILWAUKEE, WI; Owner: CLEAR CHANNEL BROADCASTING LICENSES, INC.)
WEMP (1250 AM; 5 kW; MILWAUKEE, WI; Owner: ENTERCOM MILWAUKEE LICENSE, LLC)
WAUK (1510 AM; daytime; 10 kW; WAUKESHA, WI; Owner: WALT-WEST WISCONSIN, INC.)
WTMJ (620 AM; 50 kW; MILWAUKEE, WI; Owner: JOURNAL BROADCAST CORPORATION)
WISN (1130 AM; 50 kW; MILWAUKEE, WI; Owner: CAPSTAR TX LIMITED PARTNERSHIP)
WKSH (1640 AM; 10 kW; SUSSEX, WI; Owner: ABC, INC.)
WMCS (1290 AM; 5 kW; GREENFIELD, WI; Owner: MILWAUKEE RADIO ALLIANCE, LLC)
WGN (720 AM; 50 kW; CHICAGO, IL; Owner: WGN CONTINENTAL BROADCASTING CO.)
WSCR (670 AM; 50 kW; CHICAGO, IL; Owner: INFINITY BROADCASTING OPERATIONS, INC.)
WBBM (780 AM; 50 kW; CHICAGO, IL; Owner: INFINITY BROADCASTING OPERATIONS, INC.)
WJYI (1340 AM; 1 kW; MILWAUKEE, WI; Owner: LAKEFRONT COMMUNICATIONS, LLC)
WGLB (1560 AM; 0 kW; ELM GROVE, WI)
WMVP (1000 AM; 50 kW; CHICAGO, IL; Owner: ABC, INC.)
Strongest FM radio stations in New Berlin:
WVCY-FM (107.7 FM; MILWAUKEE, WI; Owner: VCY AMERICA, INC.)
WFZH (105.3 FM; MUKWONAGO, WI; Owner: CARON BROADCASTING, INC.)
WMYX-FM (99.1 FM; MILWAUKEE, WI; Owner: ENTERCOM MILWAUKEE LICENSE, LLC)
WJZI (93.3 FM; MILWAUKEE, WI; Owner: MILWAUKEE RADIO ALLIANCE, LLC)
WMIL-FM (106.1 FM; WAUKESHA, WI; Owner: CLEAR CHANNEL BROADCASTING LICENSES, INC.)
WKTI-FM (94.5 FM; MILWAUKEE, WI; Owner: JOURNAL BROADCAST CORPORATION)
WLTQ (97.3 FM; MILWAUKEE, WI; Owner: CAPSTAR TX LIMITED PARTNERSHIP)
WUWM (89.7 FM; MILWAUKEE, WI; Owner: BOARD OF REGENTS, UNIVERSITY OF WISCONSIN SYSTEM)
WLZR (102.9 FM; MILWAUKEE, WI; Owner: LAKEFRONT COMMUNICATIONS, LLC)
WXSS (103.7 FM; WAUWATOSA, WI; Owner: ENTERCOM MILWAUKEE LICENSE, LLC)
WJMR-FM (98.3 FM; MENOMONEE FALLS, WI; Owner: LAKEFRONT COMMUNICATIONS, LLC)
WKLH (96.5 FM; MILWAUKEE, WI; Owner: LAKEFRONT COMMUNICATIONS, LLC)
WMWK (88.1 FM; MILWAUKEE, WI; Owner: FAMILY STATIONS, INC.)
WLUM-FM (102.1 FM; MILWAUKEE, WI; Owner: MILWAUKEE RADIO ALLIANCE, LLC)
WRIT-FM (95.7 FM; MILWAUKEE, WI; Owner: CLEAR CHANNEL BROADCASTING LICENSES, INC.)
WHAD (90.7 FM; DELAFIELD, WI; Owner: STATE OF WISCONSIN - EDUCATIONAL COMMUNICATIONS BOARD)
WKKV-FM (100.7 FM; RACINE, WI; Owner: CLEAR CHANNEL BROADCASTING LICENSES, INC.)
WFMR (106.9 FM; BROOKFIELD, WI; Owner: SAGA COMMUNICATIONS OF MILWAUKEE, LLC)
WYMS (88.9 FM; MILWAUKEE, WI; Owner: MILWAUKEE BOARD OF SCHOOL DIRECTORS)
WEXT (104.7 FM; STURTEVANT, WI; Owner: NM LICENSING, LLC)
TV broadcast stations around New Berlin:
WTAS-LP (Channel 43; WAUKESHA, WI; Owner: WAUKESHA TOWER ASSOCIATES)
WDJT-TV (Channel 58; MILWAUKEE, WI; Owner: WDJT-TV LIMITED PARTNERSHIP)
WISN-TV (Channel 12; MILWAUKEE, WI; Owner: WISN HEARST-ARGYLE TV, INC. (CA CORP.))
WPXE (Channel 55; KENOSHA, WI; Owner: PAXSON MILWAUKEE LICENSE, INC.)
WMVS (Channel 10; MILWAUKEE, WI; Owner: MILWAUKEE AREA TECHNICAL COLLEGE DISTRICT BOARD)
WMVT (Channel 36; MILWAUKEE, WI; Owner: MILWAUKEE AREA TECHNICAL COLLEGE DISTRICT BOARD)
WCGV-TV (Channel 24; MILWAUKEE, WI; Owner: WCGV LICENSEE, LLC)
WMLW-CA (Channel 46; MILWAUKEE, WI; Owner: CHANNEL 41 AND 63 LIMITED PARTNERSHIP)
W63CU (Channel 63; MILWAUKEE, WI; Owner: CHANNEL 41 AND 63 LIMITED PARTNERSHIP)
WVTV (Channel 18; MILWAUKEE, WI; Owner: WVTV LICENSEE, INC.)
WTMJ-TV (Channel 4; MILWAUKEE, WI; Owner: JOURNAL BROADCAST CORPORATION)
WMKE-CA (Channel 7; MILWAUKEE, WI; Owner: KM LPTV OF MILWAUKEE, L.L.C.)
WVCY-TV (Channel 30; MILWAUKEE, WI; Owner: VCY AMERICA, INC.)
WITI (Channel 6; MILWAUKEE, WI; Owner: WITI LICENSE,INC.)
WJJA (Channel 49; RACINE, WI; Owner: TV-49, INC.)
WWRS-TV (Channel 52; MAYVILLE, WI; Owner: NATIONAL MINORITY T.V., INC.)
W64CQ (Channel 64; ARLINGTON HEIGHTS, IL; Owner: TRINITY BROADCASTING NETWORK)
National Bridge Inventory (NBI) Statistics 46 Number of bridges371ft / 113m Total length $1,923,000 Total costs866,772 Total average daily traffic30,105 Total average daily truck traffic
New bridges - historical statistics
2 1950-1959 22 1960-1969 2 1980-1989 3 1990-1999 15 2000-2009 2 2010-2019
See full National Bridge Inventory statistics for New Berlin, WI
Home Mortgage Disclosure Act Aggregated Statistics For Year 2009(Based on 6 full and 3 partial tracts) A) FHA, FSA/RHS & VA B) Conventional C) Refinancings D) Home Improvement Loans E) Loans on Dwellings For 5+ Families F) Non-occupant Loans on Number Average Value Number Average Value Number Average Value Number Average Value Number Average Value Number Average Value
LOANS ORIGINATED 99 $197,589 268 $195,692 1,879 $179,909 107 $72,845 2 $929,000 15 $159,588 APPLICATIONS APPROVED, NOT ACCEPTED 4 $169,250 13 $213,003 112 $218,242 16 $46,766 1 $2,459,000 1 $188,000 APPLICATIONS DENIED 7 $185,817 23 $198,473 255 $220,429 20 $45,948 0 $0 8 $169,025 APPLICATIONS WITHDRAWN 8 $209,055 16 $186,319 237 $195,179 9 $54,990 0 $0 6 $138,667 FILES CLOSED FOR INCOMPLETENESS 1 $300,000 3 $157,170 49 $216,184 3 $27,770 0 $0 0 $0
Aggregated Statistics For Year 2008(Based on 6 full and 3 partial tracts) A) FHA, FSA/RHS & VA B) Conventional C) Refinancings D) Home Improvement Loans E) Loans on Dwellings For 5+ Families F) Non-occupant Loans on Number Average Value Number Average Value Number Average Value Number Average Value Number Average Value Number Average Value
LOANS ORIGINATED 51 $219,270 382 $198,095 804 $187,256 117 $54,846 7 $2,188,891 21 $198,468 APPLICATIONS APPROVED, NOT ACCEPTED 1 $232,520 27 $161,693 88 $195,445 20 $97,678 0 $0 4 $135,338 APPLICATIONS DENIED 3 $177,260 22 $211,179 199 $219,436 37 $67,638 1 $645,890 4 $245,890 APPLICATIONS WITHDRAWN 6 $226,952 30 $205,775 104 $209,630 13 $48,527 0 $0 7 $204,320 FILES CLOSED FOR INCOMPLETENESS 0 $0 8 $234,811 29 $234,532 6 $107,057 0 $0 1 $266,000
Aggregated Statistics For Year 2007(Based on 6 full and 3 partial tracts) A) FHA, FSA/RHS & VA B) Conventional C) Refinancings D) Home Improvement Loans E) Loans on Dwellings For 5+ Families F) Non-occupant Loans on Number Average Value Number Average Value Number Average Value Number Average Value Number Average Value Number Average Value
LOANS ORIGINATED 10 $180,707 520 $204,829 746 $177,708 155 $63,215 1 $8,373,500 21 $188,284 APPLICATIONS APPROVED, NOT ACCEPTED 1 $163,000 37 $174,799 106 $155,370 33 $37,596 0 $0 3 $166,667 APPLICATIONS DENIED 1 $218,000 41 $170,513 253 $195,200 47 $40,809 0 $0 10 $221,251 APPLICATIONS WITHDRAWN 3 $173,667 33 $231,867 147 $192,239 17 $117,160 0 $0 5 $211,488 FILES CLOSED FOR INCOMPLETENESS 0 $0 5 $233,232 45 $200,624 3 $23,030 0 $0 0 $0
Aggregated Statistics For Year 2006(Based on 6 full and 3 partial tracts) A) FHA, FSA/RHS & VA B) Conventional C) Refinancings D) Home Improvement Loans E) Loans on Dwellings For 5+ Families F) Non-occupant Loans on Number Average Value Number Average Value Number Average Value Number Average Value Number Average Value Number Average Value
LOANS ORIGINATED 19 $213,634 587 $189,857 779 $151,117 156 $47,848 3 $2,471,333 42 $198,542 APPLICATIONS APPROVED, NOT ACCEPTED 1 $258,000 55 $157,454 102 $150,616 20 $79,183 0 $0 4 $157,168 APPLICATIONS DENIED 2 $183,000 39 $226,783 245 $176,084 39 $56,397 0 $0 8 $481,155 APPLICATIONS WITHDRAWN 2 $274,000 35 $198,569 163 $190,204 8 $109,630 0 $0 5 $155,400 FILES CLOSED FOR INCOMPLETENESS 0 $0 6 $198,217 85 $193,004 4 $96,965 0 $0 1 $161,460
Aggregated Statistics For Year 2005(Based on 6 full and 3 partial tracts) A) FHA, FSA/RHS & VA B) Conventional C) Refinancings D) Home Improvement Loans E) Loans on Dwellings For 5+ Families F) Non-occupant Loans on G) Loans On Manufactured Number Average Value Number Average Value Number Average Value Number Average Value Number Average Value Number Average Value Number Average Value
LOANS ORIGINATED 7 $167,490 718 $173,150 1,015 $160,000 115 $56,940 7 $3,006,714 41 $208,564 0 $0 APPLICATIONS APPROVED, NOT ACCEPTED 0 $0 44 $174,421 115 $156,424 20 $58,486 0 $0 3 $111,927 1 $20,000 APPLICATIONS DENIED 2 $96,500 45 $156,098 293 $172,866 33 $74,062 0 $0 7 $119,194 1 $43,000 APPLICATIONS WITHDRAWN 1 $110,200 46 $146,554 209 $169,194 20 $170,521 0 $0 6 $171,748 2 $72,000 FILES CLOSED FOR INCOMPLETENESS 0 $0 16 $164,791 126 $192,291 4 $34,975 0 $0 3 $132,667 0 $0
Aggregated Statistics For Year 2004(Based on 6 full and 3 partial tracts) A) FHA, FSA/RHS & VA B) Conventional C) Refinancings D) Home Improvement Loans E) Loans on Dwellings For 5+ Families F) Non-occupant Loans on G) Loans On Manufactured Number Average Value Number Average Value Number Average Value Number Average Value Number Average Value Number Average Value Number Average Value
LOANS ORIGINATED 16 $183,124 604 $170,351 1,300 $156,631 123 $47,314 7 $2,347,857 39 $173,503 1 $24,000 APPLICATIONS APPROVED, NOT ACCEPTED 0 $0 35 $185,823 106 $149,631 21 $51,434 0 $0 3 $73,000 1 $8,550 APPLICATIONS DENIED 0 $0 40 $139,147 270 $154,066 35 $54,759 0 $0 8 $159,440 2 $45,680 APPLICATIONS WITHDRAWN 1 $202,990 48 $220,478 173 $171,804 11 $91,116 1 $457,660 5 $153,600 0 $0 FILES CLOSED FOR INCOMPLETENESS 0 $0 11 $172,421 106 $166,607 4 $20,782 0 $0 0 $0 0 $0
Aggregated Statistics For Year 2003(Based on 6 full and 3 partial tracts) A) FHA, FSA/RHS & VA B) Conventional C) Refinancings D) Home Improvement Loans E) Loans on Dwellings For 5+ Families F) Non-occupant Loans on Number Average Value Number Average Value Number Average Value Number Average Value Number Average Value Number Average Value
LOANS ORIGINATED 14 $163,130 659 $167,326 3,671 $137,318 226 $33,550 2 $3,720,000 47 $170,999 APPLICATIONS APPROVED, NOT ACCEPTED 0 $0 28 $157,299 239 $135,514 14 $32,268 0 $0 5 $150,482 APPLICATIONS DENIED 2 $175,495 28 $164,235 378 $138,968 17 $31,636 1 $7,250,000 8 $122,160 APPLICATIONS WITHDRAWN 3 $176,333 82 $168,275 235 $152,353 8 $27,946 0 $0 5 $96,360 FILES CLOSED FOR INCOMPLETENESS 0 $0 9 $164,930 37 $145,848 1 $62,360 1 $1,320,000 1 $112,000
Aggregated Statistics For Year 2002(Based on 2 full and 2 partial tracts) A) FHA, FSA/RHS & VA B) Conventional C) Refinancings D) Home Improvement Loans E) Loans on Dwellings For 5+ Families F) Non-occupant Loans on Number Average Value Number Average Value Number Average Value Number Average Value Number Average Value Number Average Value
LOANS ORIGINATED 11 $148,323 432 $147,803 1,430 $128,988 102 $25,750 3 $2,009,617 24 $126,797 APPLICATIONS APPROVED, NOT ACCEPTED 1 $130,710 19 $157,459 128 $130,719 10 $11,940 0 $0 3 $123,727 APPLICATIONS DENIED 1 $99,950 15 $169,718 101 $119,655 26 $18,682 0 $0 2 $40,000 APPLICATIONS WITHDRAWN 2 $110,500 26 $141,535 103 $128,414 8 $15,886 0 $0 3 $72,560 FILES CLOSED FOR INCOMPLETENESS 0 $0 8 $63,750 23 $166,413 3 $108,453 0 $0 1 $88,000
Aggregated Statistics For Year 2001(Based on 2 full and 2 partial tracts) A) FHA, FSA/RHS & VA B) Conventional C) Refinancings D) Home Improvement Loans E) Loans on Dwellings For 5+ Families F) Non-occupant Loans on Number Average Value Number Average Value Number Average Value Number Average Value Number Average Value Number Average Value
LOANS ORIGINATED 18 $127,466 394 $136,702 1,047 $120,490 76 $26,506 9 $896,667 19 $75,719 APPLICATIONS APPROVED, NOT ACCEPTED 1 $105,190 18 $130,180 70 $117,366 5 $39,034 0 $0 1 $125,490 APPLICATIONS DENIED 0 $0 20 $124,001 112 $112,648 13 $35,495 0 $0 1 $33,000 APPLICATIONS WITHDRAWN 2 $86,600 24 $133,680 87 $120,315 2 $7,210 0 $0 4 $113,248 FILES CLOSED FOR INCOMPLETENESS 0 $0 2 $73,980 19 $106,764 1 $19,000 0 $0 0 $0
Aggregated Statistics For Year 2000(Based on 2 full and 2 partial tracts) A) FHA, FSA/RHS & VA B) Conventional C) Refinancings D) Home Improvement Loans E) Loans on Dwellings For 5+ Families F) Non-occupant Loans on Number Average Value Number Average Value Number Average Value Number Average Value Number Average Value Number Average Value
LOANS ORIGINATED 22 $130,333 314 $137,360 219 $98,320 82 $18,318 3 $584,707 15 $81,300 APPLICATIONS APPROVED, NOT ACCEPTED 0 $0 15 $126,165 28 $77,090 12 $25,983 0 $0 2 $37,845 APPLICATIONS DENIED 2 $133,500 19 $115,623 61 $89,286 25 $18,447 0 $0 4 $59,462 APPLICATIONS WITHDRAWN 2 $138,550 18 $144,246 39 $90,760 11 $43,499 0 $0 1 $112,570 FILES CLOSED FOR INCOMPLETENESS 0 $0 2 $127,590 10 $114,249 1 $20,000 0 $0 1 $11,110
Aggregated Statistics For Year 1999(Based on 3 full and 3 partial tracts) A) FHA, FSA/RHS & VA B) Conventional C) Refinancings D) Home Improvement Loans E) Loans on Dwellings For 5+ Families F) Non-occupant Loans on Number Average Value Number Average Value Number Average Value Number Average Value Number Average Value Number Average Value
LOANS ORIGINATED 20 $130,384 774 $140,950 751 $103,118 176 $21,728 3 $2,744,450 24 $102,977 APPLICATIONS APPROVED, NOT ACCEPTED 0 $0 23 $113,598 101 $101,402 17 $24,445 0 $0 3 $81,363 APPLICATIONS DENIED 5 $144,078 36 $123,466 138 $99,772 25 $24,378 0 $0 2 $60,120 APPLICATIONS WITHDRAWN 5 $122,900 39 $134,336 111 $100,143 28 $61,053 0 $0 2 $86,945 FILES CLOSED FOR INCOMPLETENESS 2 $97,435 5 $195,704 36 $115,897 0 $0 0 $0 0 $0
Detailed mortgage data for all 9 tracts in New Berlin, WI
Private Mortgage Insurance Companies Aggregated Statistics For Year 2009(Based on 5 full and 3 partial tracts) A) Conventional B) Refinancings Number Average Value Number Average Value
LOANS ORIGINATED 88 $203,305 82 $218,350 APPLICATIONS APPROVED, NOT ACCEPTED 10 $217,292 15 $230,912 APPLICATIONS DENIED 11 $178,421 13 $235,248 APPLICATIONS WITHDRAWN 2 $275,110 2 $308,885 FILES CLOSED FOR INCOMPLETENESS 1 $174,280 2 $254,000
Aggregated Statistics For Year 2008(Based on 5 full and 3 partial tracts) A) Conventional B) Refinancings C) Non-occupant Loans on Number Average Value Number Average Value Number Average Value
LOANS ORIGINATED 128 $204,484 66 $226,028 0 $0 APPLICATIONS APPROVED, NOT ACCEPTED 20 $260,591 17 $254,929 0 $0 APPLICATIONS DENIED 5 $207,544 9 $200,760 0 $0 APPLICATIONS WITHDRAWN 2 $208,685 2 $279,500 0 $0 FILES CLOSED FOR INCOMPLETENESS 0 $0 1 $168,000 1 $168,000
Aggregated Statistics For Year 2007(Based on 5 full and 3 partial tracts) A) Conventional B) Refinancings C) Non-occupant Loans on Number Average Value Number Average Value Number Average Value
LOANS ORIGINATED 136 $205,389 52 $248,942 3 $174,627 APPLICATIONS APPROVED, NOT ACCEPTED 12 $240,577 10 $309,075 0 $0 APPLICATIONS DENIED 1 $252,000 3 $204,033 0 $0 APPLICATIONS WITHDRAWN 3 $166,947 4 $204,275 0 $0 FILES CLOSED FOR INCOMPLETENESS 0 $0 0 $0 0 $0
Aggregated Statistics For Year 2006(Based on 5 full and 3 partial tracts) A) Conventional B) Refinancings C) Non-occupant Loans on Number Average Value Number Average Value Number Average Value
LOANS ORIGINATED 119 $213,106 36 $214,926 4 $188,675 APPLICATIONS APPROVED, NOT ACCEPTED 16 $198,394 8 $233,136 1 $136,000 APPLICATIONS DENIED 2 $228,000 0 $0 1 $184,000 APPLICATIONS WITHDRAWN 2 $292,500 3 $208,620 0 $0 FILES CLOSED FOR INCOMPLETENESS 0 $0 0 $0 0 $0
Aggregated Statistics For Year 2005(Based on 5 full and 3 partial tracts) A) Conventional B) Refinancings C) Non-occupant Loans on Number Average Value Number Average Value Number Average Value
LOANS ORIGINATED 126 $202,176 53 $203,345 5 $208,410 APPLICATIONS APPROVED, NOT ACCEPTED 14 $220,055 11 $208,015 0 $0 APPLICATIONS DENIED 1 $210,380 3 $315,430 0 $0 APPLICATIONS WITHDRAWN 5 $216,650 2 $182,120 2 $140,000 FILES CLOSED FOR INCOMPLETENESS 1 $184,540 0 $0 0 $0
Aggregated Statistics For Year 2004(Based on 5 full and 3 partial tracts) A) Conventional B) Refinancings C) Non-occupant Loans on Number Average Value Number Average Value Number Average Value
LOANS ORIGINATED 125 $202,706 51 $199,696 2 $231,170 APPLICATIONS APPROVED, NOT ACCEPTED 29 $202,506 15 $154,597 0 $0 APPLICATIONS DENIED 2 $156,025 0 $0 1 $158,050 APPLICATIONS WITHDRAWN 5 $168,068 5 $165,174 0 $0 FILES CLOSED FOR INCOMPLETENESS 0 $0 0 $0 0 $0
Aggregated Statistics For Year 2003(Based on 5 full and 3 partial tracts) A) Conventional B) Refinancings C) Non-occupant Loans on Number Average Value Number Average Value Number Average Value
LOANS ORIGINATED 176 $175,713 201 $171,530 3 $153,000 APPLICATIONS APPROVED, NOT ACCEPTED 16 $207,478 36 $173,863 1 $153,000 APPLICATIONS DENIED 2 $160,000 1 $119,000 1 $149,000 APPLICATIONS WITHDRAWN 5 $172,038 7 $177,563 0 $0 FILES CLOSED FOR INCOMPLETENESS 1 $222,000 2 $182,000 0 $0
Aggregated Statistics For Year 2002(Based on 2 full and 2 partial tracts) A) Conventional B) Refinancings C) Non-occupant Loans on Number Average Value Number Average Value Number Average Value
LOANS ORIGINATED 149 $158,607 111 $160,828 3 $107,667 APPLICATIONS APPROVED, NOT ACCEPTED 19 $161,716 9 $143,033 0 $0 APPLICATIONS DENIED 1 $152,070 0 $0 0 $0 APPLICATIONS WITHDRAWN 1 $222,120 5 $156,730 0 $0 FILES CLOSED FOR INCOMPLETENESS 0 $0 1 $147,000 0 $0
Aggregated Statistics For Year 2001(Based on 2 full and 2 partial tracts) A) Conventional B) Refinancings C) Non-occupant Loans on Number Average Value Number Average Value Number Average Value
LOANS ORIGINATED 149 $154,803 89 $146,888 1 $83,000 APPLICATIONS APPROVED, NOT ACCEPTED 17 $145,715 20 $170,012 0 $0 APPLICATIONS DENIED 2 $89,500 2 $142,095 0 $0 APPLICATIONS WITHDRAWN 2 $96,000 5 $123,400 0 $0 FILES CLOSED FOR INCOMPLETENESS 0 $0 3 $127,017 0 $0
Aggregated Statistics For Year 2000(Based on 2 full and 2 partial tracts) A) Conventional B) Refinancings Number Average Value Number Average Value
LOANS ORIGINATED 117 $137,305 12 $137,479 APPLICATIONS APPROVED, NOT ACCEPTED 14 $142,721 1 $194,690 APPLICATIONS DENIED 4 $155,802 1 $119,000 APPLICATIONS WITHDRAWN 3 $193,000 0 $0 FILES CLOSED FOR INCOMPLETENESS 0 $0 0 $0
Aggregated Statistics For Year 1999(Based on 3 full and 3 partial tracts) A) Conventional B) Refinancings C) Non-occupant Loans on Number Average Value Number Average Value Number Average Value
LOANS ORIGINATED 235 $149,478 51 $139,488 2 $116,785 APPLICATIONS APPROVED, NOT ACCEPTED 13 $179,480 14 $174,178 0 $0 APPLICATIONS DENIED 4 $122,198 2 $141,660 0 $0 APPLICATIONS WITHDRAWN 3 $140,467 0 $0 0 $0 FILES CLOSED FOR INCOMPLETENESS 0 $0 0 $0 0 $0
Detailed PMIC statistics for the following Tracts:
2013.00
, 2014.01 , 2014.02 , 2015.03 , 2015.04 , 2015.05 , 2015.06 , 2016.00 Fire-safe hotels and motels in New Berlin, Wisconsin:
La Quinta Inn & Suites, 15300 W Rock Ridge Rd, New Berlin, Wisconsin 53151 Phone: (262) 717-0900, Fax: (262) 717-0905
Holiday Inn Express Hotel & Suites, 15451 W Beloit Rd, New Berlin, Wisconsin 53151 Phone: (262) 787-0700, Fax: (262) 787-0738
All 2 fire-safe hotels and motels in New Berlin, Wisconsin
Most common first names in New Berlin, WI among deceased individuals Name Count Lived (average)
John 170 73.8 years Mary 139 80.6 years Robert 128 73.8 years William 107 73.7 years Helen 102 82.5 years George 98 77.1 years Joseph 95 75.6 years Dorothy 90 80.8 years Edward 90 75.9 years Richard 77 69.7 years
Most common last names in New Berlin, WI among deceased individuals Last name Count Lived (average)
Johnson 30 80.1 years Schmidt 26 79.3 years Miller 25 72.8 years Smith 22 72.1 years Anderson 21 74.2 years Martin 20 80.0 years Weber 19 80.1 years Peterson 18 77.1 years Jones 17 79.3 years Meyer 16 69.2 years
New Berlin compared to Wisconsin state average:
Unemployed percentage significantly below state average. Black race population percentage significantly below state average. Hispanic race population percentage below state average. Length of stay since moving in significantly above state average. Percentage of population with a bachelor's degree or higher above state average. New Berlin on our top lists :
#46 on the list of "Top 101 cities where residents moved in more then 10 years ago (10,000+ households)"
#1 on the list of "Top 101 counties with the lowest percentage of residents relocating from foreign countries between 2010 and 2011"
#7 on the list of "Top 101 counties with the lowest number of infant deaths per 1000 residents 2007-2013 (pop. 50,000+)"
#7 on the list of "Top 101 counties with the largest decrease in the number of infant deaths per 1000 residents 2000-2006 to 2007-2013 (pop. 50,000+)"
#12 on the list of "Top 101 counties with the largest number of people without health insurance coverage in 2000 (pop. 50,000+)"
#44 on the list of "Top 101 counties with the lowest number of births per 1000 residents 2007-2013"
Top Patent Applicants
Dennis J. Grzybowski (20)
Thomas A. Helf (20)
David D. Brandt (19)
Richard A. Lukaszewski (16)
Mirko Zakula (16)
Jan Pingel (15)
Alan J. Campbell (12)
Mark Allan Juds (12)
Jiahua Fan (11)
Mark Lazar (10)
Total of 696 patent applications in 2008-2024.


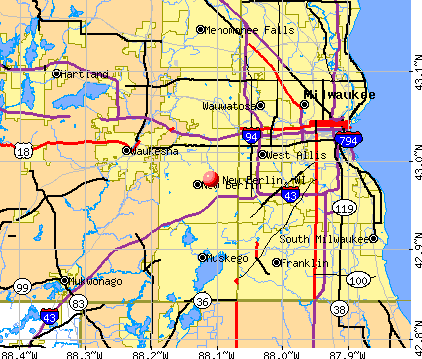


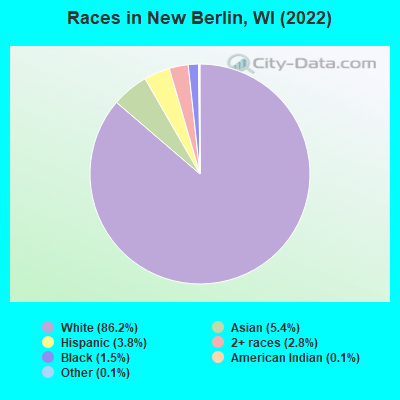
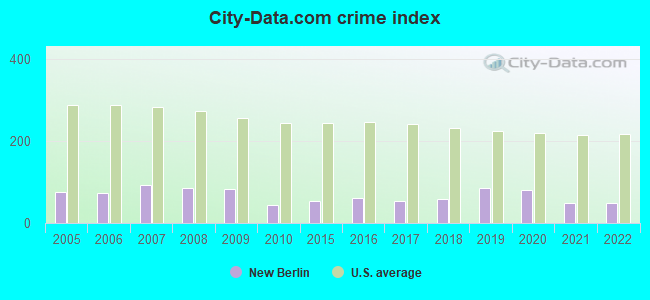
 Recent articles from our blog. Our writers, many of them Ph.D. graduates or candidates, create easy-to-read articles on a wide variety of topics.

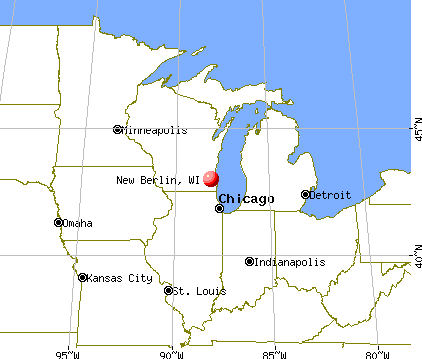
 (5.0 miles
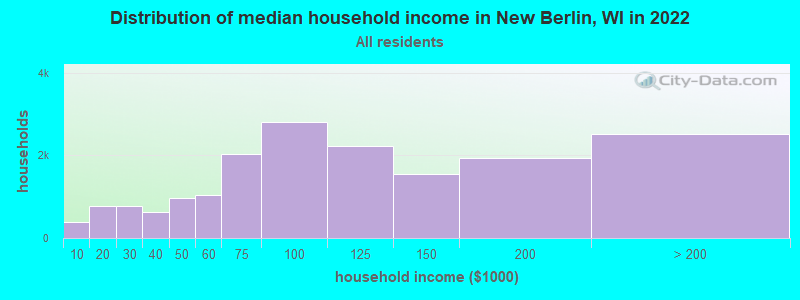
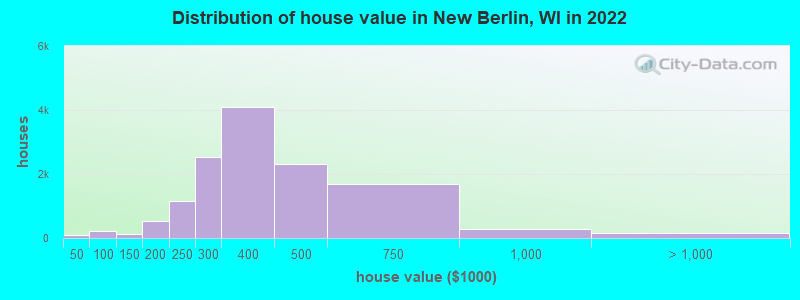
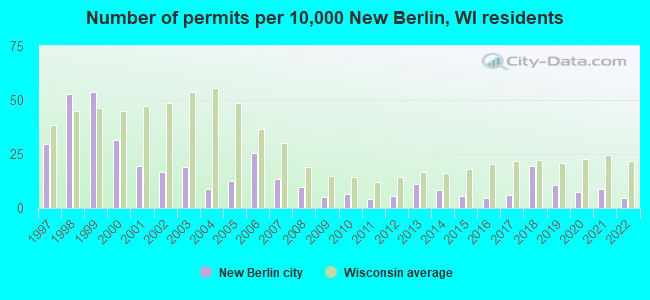
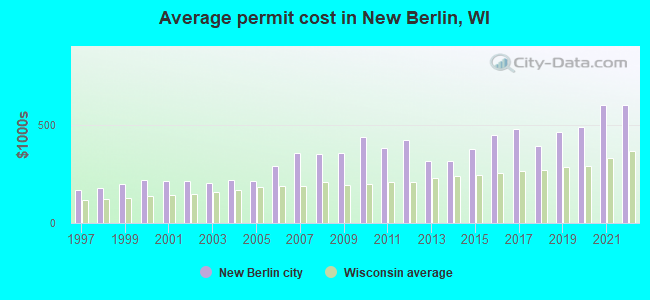
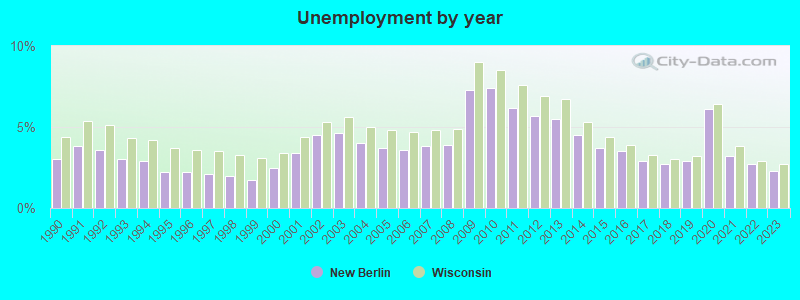
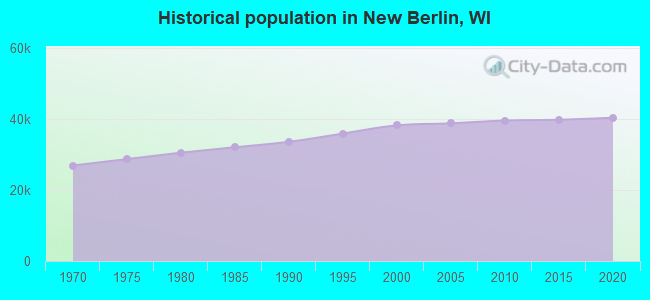
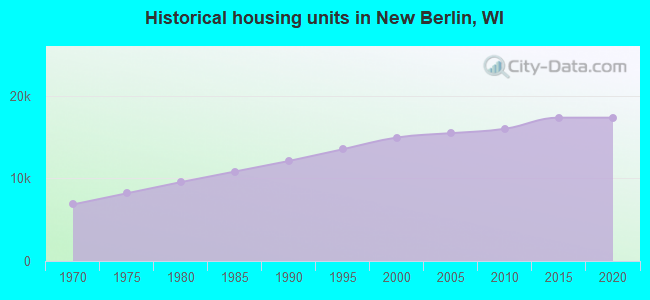
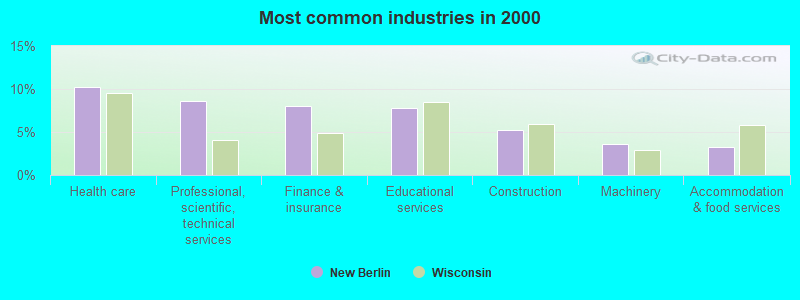
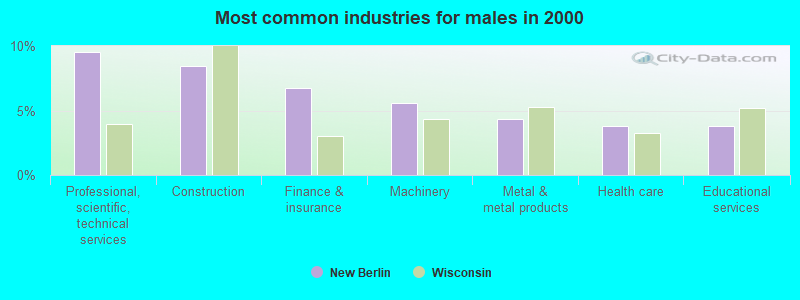
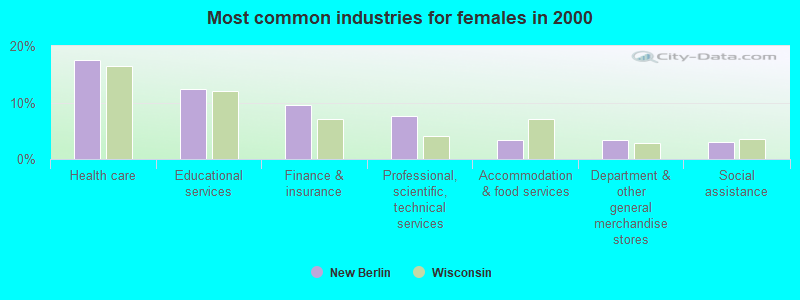
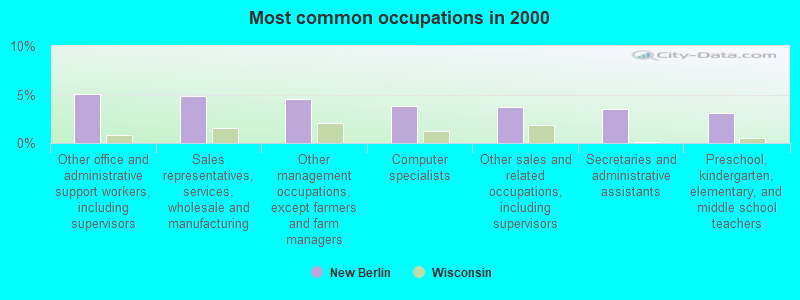
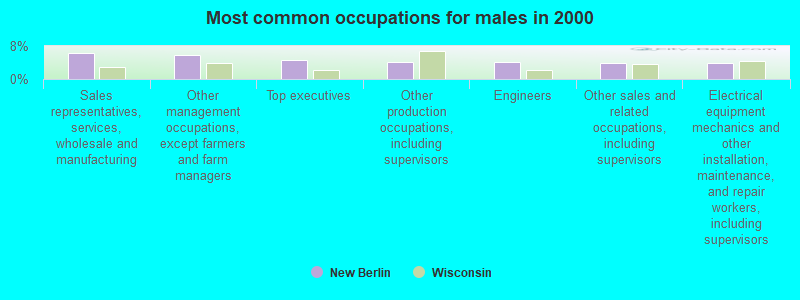
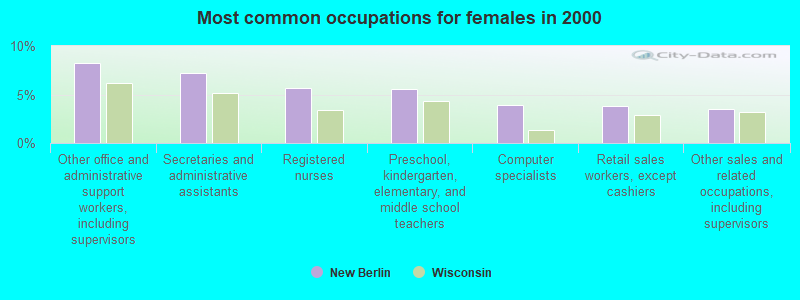
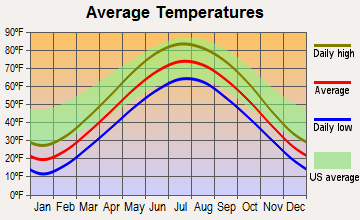
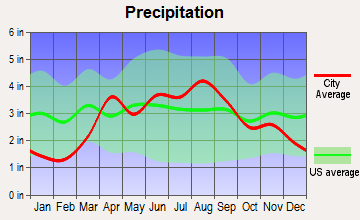
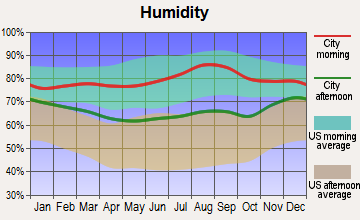
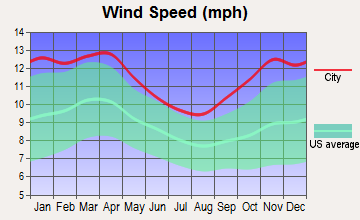
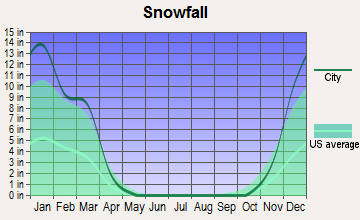
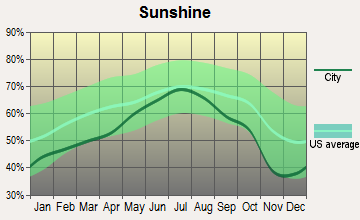
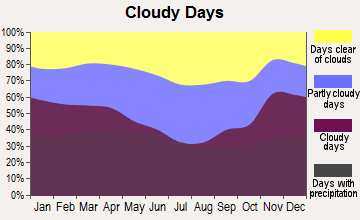


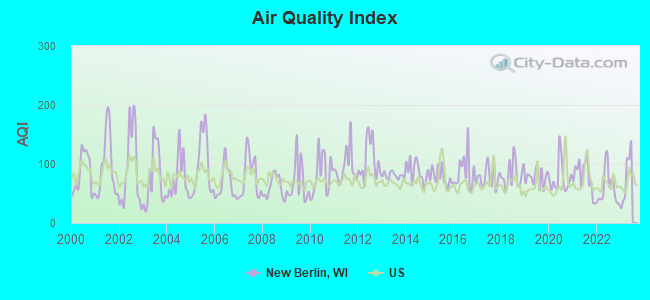
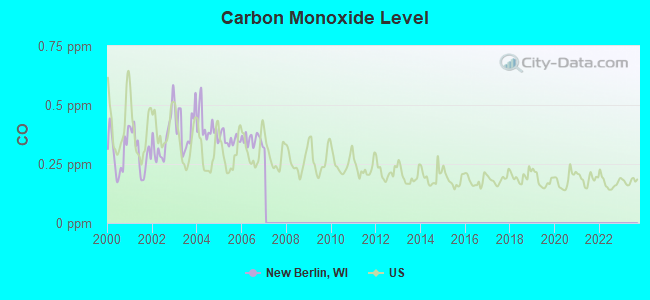

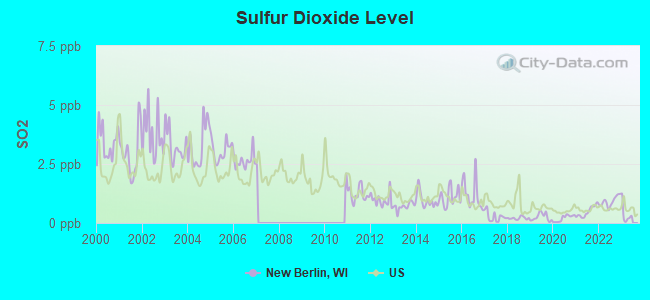
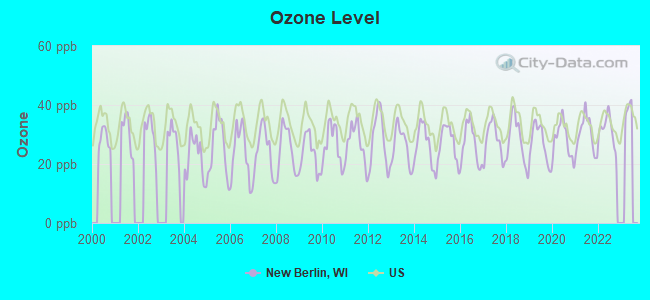
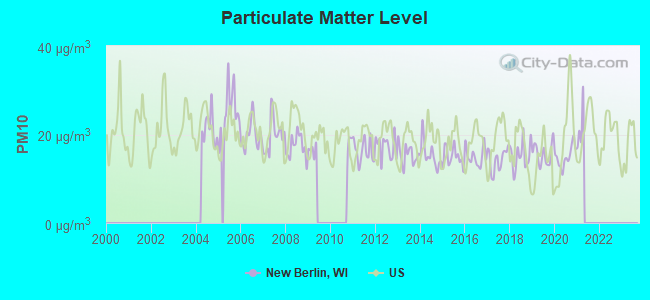
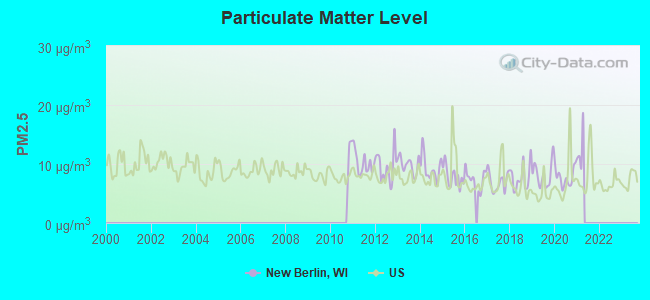
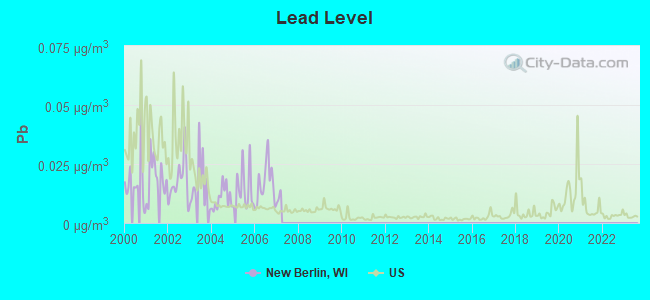
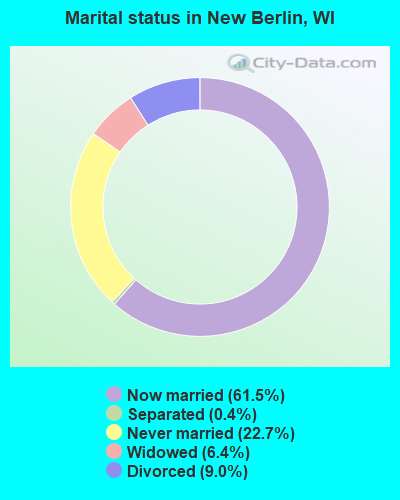
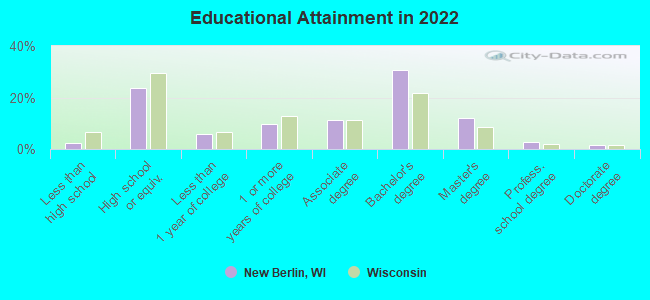
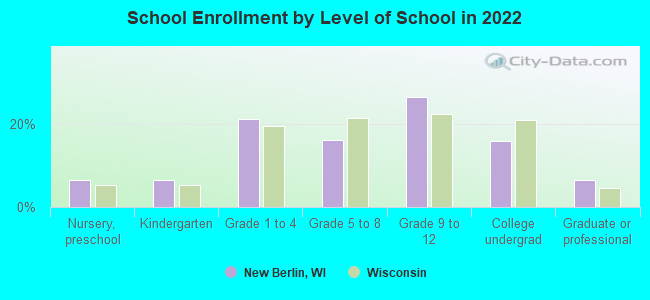
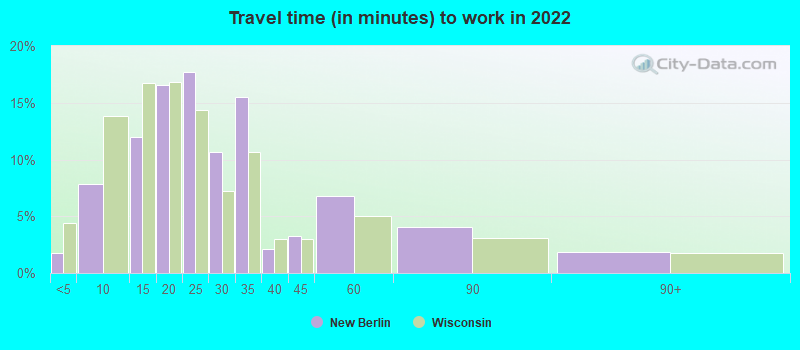
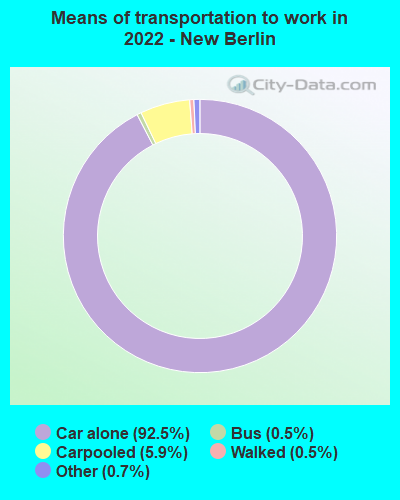
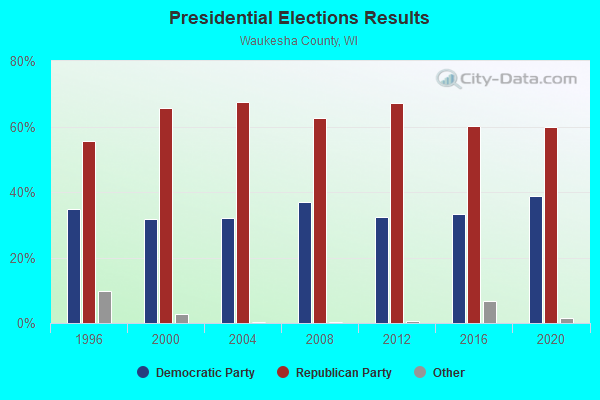
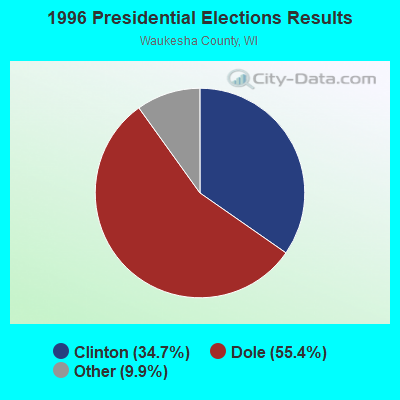
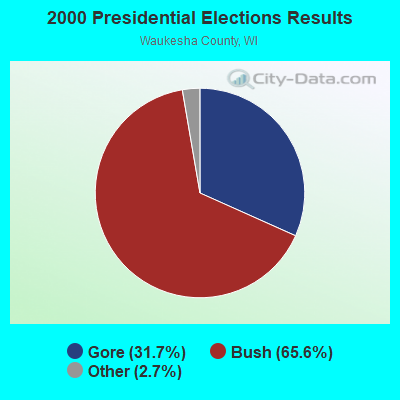
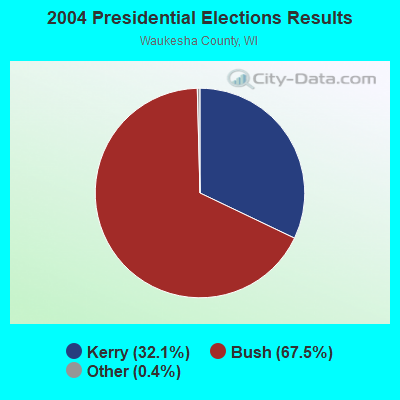
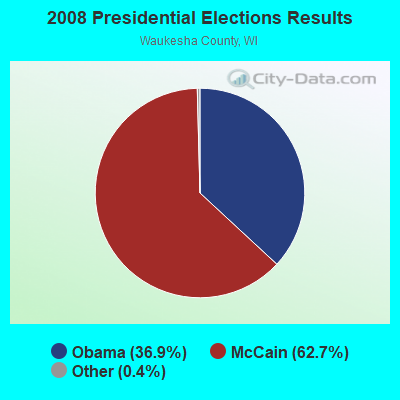

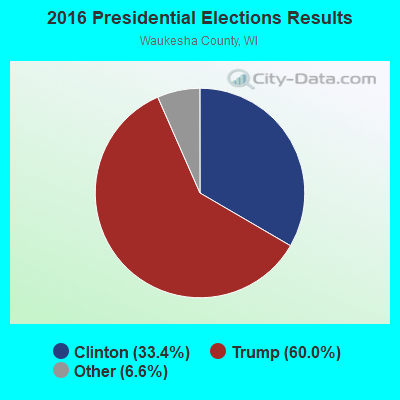
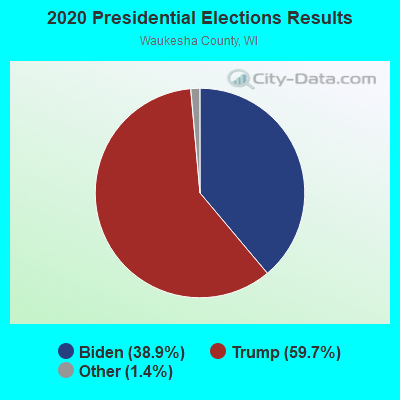
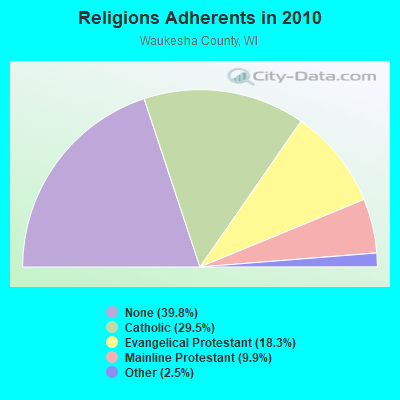
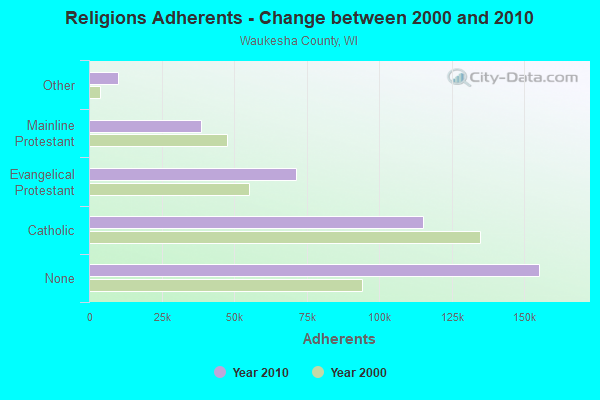
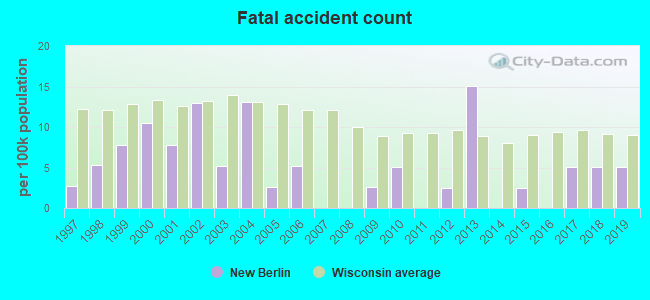
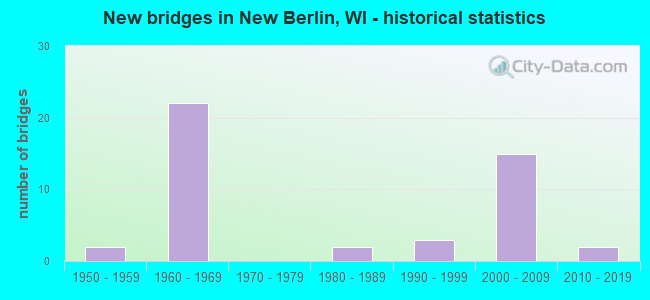
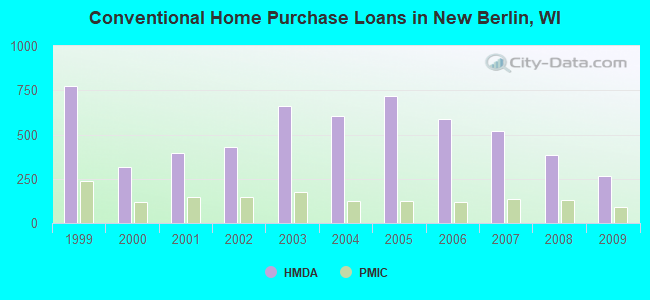
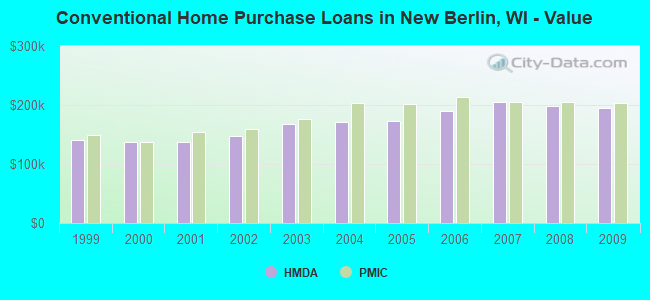
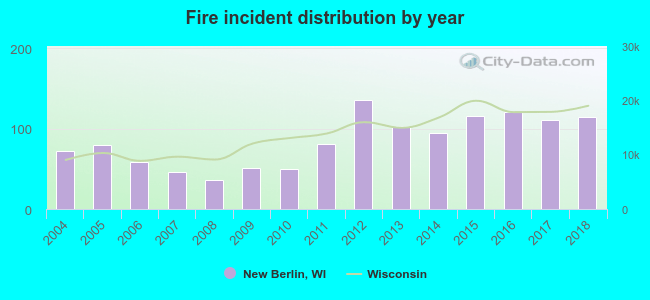 According to the data from the years 2004 - 2018 the average number of fire incidents per year is 84. The highest number of fire incidents - 135 took place in 2012, and the least - 36 in 2008. The data has a growing trend.
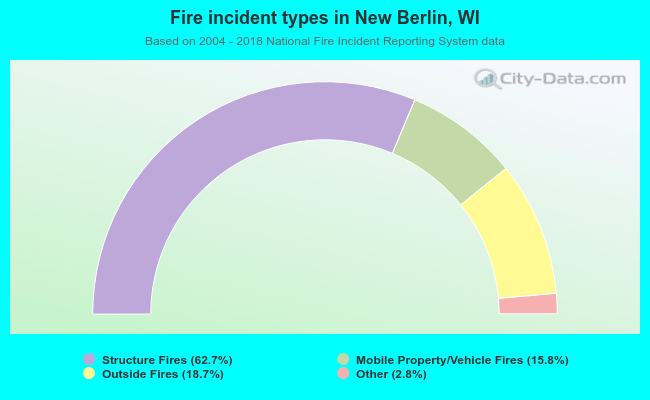 When looking into fire subcategories, the most incidents belonged to: Structure Fires (62.7%), and Outside Fires (18.7%).