Elm Grove, Wisconsin
Submit your own pictures of this village and show them to the world
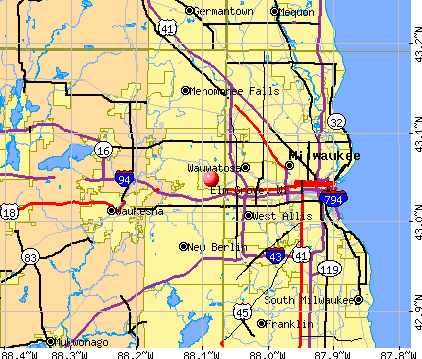
- OSM Map
- General Map
- Google Map
- MSN Map
Population change since 2000: +1.3%
 |
| Males: 3,113 | |
| Females: 3,216 |
| Median resident age: | 43.2 years |
| Wisconsin median age: | 40.4 years |
Zip codes: 53122.
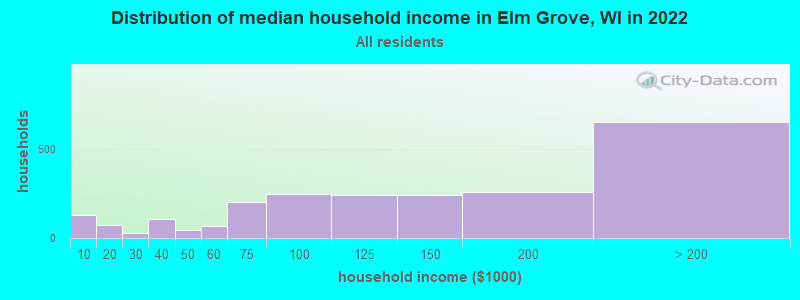
| Elm Grove: | $123,510 |
| WI: | $70,996 |
Estimated per capita income in 2022: $63,907 (it was $48,871 in 2000)
Elm Grove village income, earnings, and wages data
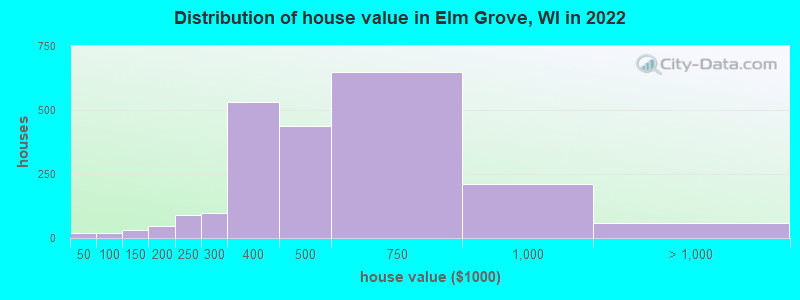
Estimated median house or condo value in 2022: $466,602 (it was $250,700 in 2000)
| Elm Grove: | $466,602 |
| WI: | $252,800 |
Mean prices in 2022: all housing units: $578,622; detached houses: $633,840; townhouses or other attached units: $289,770; in 3-to-4-unit structures: $121,873; in 5-or-more-unit structures: $320,591
Median gross rent in 2022: $1,399.
(4.5% for White Non-Hispanic residents, 7.8% for Black residents, 4.8% for Hispanic or Latino residents, 12.5% for other race residents)
Detailed information about poverty and poor residents in Elm Grove, WI

Compare current foreclosures near Elm Grove, WI:
| Photo | Address | Area | Beds / Baths | Price | Details |
|---|---|---|---|---|---|

|
#1
Marilyn Dr
Elm Grove, WI 53122
|
- sq. feet
|
- baths - beds |
show details | |

|
#2
Marilyn Dr Apt 4
Elm Grove, WI 53122
|
- sq. feet
|
- baths - beds |
show details | |

|
#3
Dunleith Cir
Elm Grove, WI 53122
|
- sq. feet
|
- baths - beds |
show details | |

|
#4
Watertown Plank Rd Ste 101
Elm Grove, WI 53122
|
- sq. feet
|
- baths - beds |
show details | |

|
#5
S 47th St
Milwaukee, WI 53219
|
826 sq. feet
|
1 baths 2 beds |
$167,000
|
show details |

|
#6
N Deer Ct
Milwaukee, WI 53223
|
1,641 sq. feet
|
1 baths 3 beds |
$339,900
|
show details |

|
#7
N 36th St
Milwaukee, WI 53216
|
1,169 sq. feet
|
1 baths 2 beds |
$145,000
|
show details |

|
#8
N 25th St
Milwaukee, WI 53206
|
854 sq. feet
|
1 baths 2 beds |
$129,900
|
show details |

|
#9
N 44th St
Milwaukee, WI 53210
|
1,885 sq. feet
|
2 baths 4 beds |
$89,900
|
show details |

|
#10
N 62nd St
Milwaukee, WI 53218
|
991 sq. feet
|
2 baths 3 beds |
$155,000
|
show details |
| Photo | Address | Area | Beds / Baths | Price | Details |
|---|---|---|---|---|---|

|
#11
Marilyn Dr Apt 3
Elm Grove, WI 53122
|
- sq. feet
|
- baths - beds |
show details | |

|
#12
S 15th Pl
Milwaukee, WI 53215
|
- sq. feet
|
2 baths 5 beds |
$86,300
|
show details |

|
#13
N 38th St
Milwaukee, WI 53210
|
- sq. feet
|
2 baths 4 beds |
$41,600
|
show details |

|
#14
N 44th St
Milwaukee, WI 53218
|
- sq. feet
|
1 baths 2 beds |
$43,050
|
show details |

|
#15
N 29th St
Milwaukee, WI 53216
|
1,713 sq. feet
|
2 baths 4 beds |
show details | |

|
#16
W Melvina St
Milwaukee, WI 53222
|
1,064 sq. feet
|
1 baths 3 beds |
show details | |

|
#17
N 6th St
Milwaukee, WI 53212
|
972 sq. feet
|
1 baths 2 beds |
show details | |

|
#18
N 99th St
Milwaukee, WI 53222
|
1,286 sq. feet
|
1 baths 5 beds |
show details | |

|
#19
N 74th St
Milwaukee, WI 53218
|
1,110 sq. feet
|
1 baths 4 beds |
show details | |

|
#20
S Pine Ave
Milwaukee, WI 53207
|
1,901 sq. feet
|
1 baths 5 beds |
show details |
| Photo | Address | Area | Beds / Baths | Price | Details |
|---|---|---|---|---|---|

|
#21
W Chambers St
Milwaukee, WI 53212
|
1,067 sq. feet
|
1 baths 3 beds |
show details | |

|
#22
N 91st St
Milwaukee, WI 53224
|
1,331 sq. feet
|
1 baths 4 beds |
show details | |

|
#23
N 20th St
Milwaukee, WI 53206
|
1,844 sq. feet
|
2 baths 4 beds |
show details | |

|
#24
N 47th St
Milwaukee, WI 53208
|
1,988 sq. feet
|
2 baths 5 beds |
show details | |

|
#25
N 51st Blvd
Milwaukee, WI 53218
|
1,244 sq. feet
|
2 baths 2 beds |
show details | |

|
#26
W Denver Ave
Milwaukee, WI 53224
|
1,376 sq. feet
|
1 baths 3 beds |
show details | |

|
#27
W Villard Ave
Milwaukee, WI 53218
|
936 sq. feet
|
1 baths 3 beds |
show details | |

|
#28
W Hope Ave
Milwaukee, WI 53222
|
1,120 sq. feet
|
1 baths 3 beds |
show details | |

|
#29
N Palmer St
Milwaukee, WI 53212
|
1,217 sq. feet
|
1 baths 4 beds |
show details | |

|
#30
River Avenue
Big Bend, WI 53103
|
1,560 sq. feet
|
2 baths 3 beds |
show details |
| Photo | Address | Area | Beds / Baths | Price | Details |
|---|---|---|---|---|---|

|
#31
N 50th St
Milwaukee, WI 53216
|
1,417 sq. feet
|
1 baths 4 beds |
show details | |

|
#32
W Cleveland Ave
Milwaukee, WI 53219
|
1,263 sq. feet
|
1 baths 3 beds |
show details | |

|
#33
N 64th St
Milwaukee, WI 53218
|
1,214 sq. feet
|
1 baths 2 beds |
show details | |

|
#34
S 77th St
Milwaukee, WI 53219
|
549 sq. feet
|
1 baths 2 beds |
show details | |

|
#35
N 56th St
Milwaukee, WI 53218
|
914 sq. feet
|
1 baths 3 beds |
show details | |

|
#36
N 42nd St
Milwaukee, WI 53216
|
- sq. feet
|
1 baths 4 beds |
show details | |

|
#37
W Wells St
Milwaukee, WI 53213
|
1,984 sq. feet
|
2 baths 6 beds |
show details | |

|
#38
W Keefe Ave
Milwaukee, WI 53212
|
1,788 sq. feet
|
2 baths 4 beds |
show details | |

|
#39
N 65th St
Milwaukee, WI 53213
|
1,575 sq. feet
|
1 baths 3 beds |
show details | |

|
#40
Glenview Ave
Milwaukee, WI 53213
|
6,356 sq. feet
|
3 baths 7 beds |
show details |
| Photo | Address | Area | Beds / Baths | Price | Details |
|---|---|---|---|---|---|

|
#41
W Lawn Ave
Milwaukee, WI 53225
|
1,060 sq. feet
|
1 baths 3 beds |
show details | |

|
#42
N 53rd St
Milwaukee, WI 53216
|
2,323 sq. feet
|
2 baths 4 beds |
show details | |

|
#43
N 50th St
Milwaukee, WI 53210
|
2,371 sq. feet
|
2 baths 4 beds |
show details | |

|
#44
S Merrill Ave
Cudahy, WI 53110
|
1,062 sq. feet
|
1 baths 3 beds |
show details | |

|
#45
E Morris Ave
Cudahy, WI 53110
|
1,224 sq. feet
|
1 baths 4 beds |
show details | |

|
#46
Fleetfoot Dr
Waukesha, WI 53186
|
2,448 sq. feet
|
3 baths 6 beds |
show details | |

|
#47
Lincolnshire Ct
Waukesha, WI 53188
|
2,675 sq. feet
|
3 baths 4 beds |
show details | |

|
#48
E Layton Ave
Cudahy, WI 53110
|
2,470 sq. feet
|
3 baths 5 beds |
show details | |

|
#49
N Bel Ayr Dr
Waukesha, WI 53188
|
1,304 sq. feet
|
1 baths 3 beds |
show details | |

|
Check over 1 million property listings on Foreclosure.com!
|
browse all offers | |||


- 5,40183.2%White alone
- 3104.8%Two or more races
- 3134.8%Hispanic
- 2604.0%Asian alone
- 2493.8%Black alone
- 140.2%Other race alone
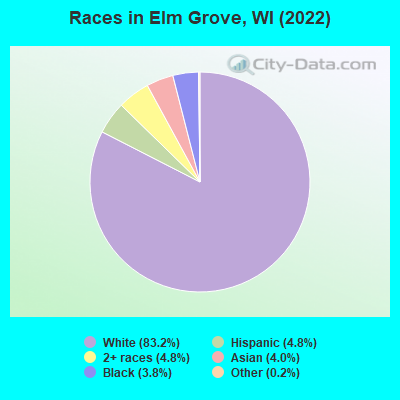
Races in Elm Grove detailed stats: ancestries, foreign born residents, place of birth
According to our research of Wisconsin and other state lists, there were 2 registered sex offenders living in Elm Grove, Wisconsin as of April 27, 2024.
The ratio of all residents to sex offenders in Elm Grove is 3,055 to 1.
The ratio of registered sex offenders to all residents in this city is much lower than the state average.
Type |
2009 |
2010 |
2011 |
2012 |
2013 |
2014 |
2015 |
2016 |
2017 |
2018 |
2019 |
2020 |
2021 |
2022 |
|---|---|---|---|---|---|---|---|---|---|---|---|---|---|---|
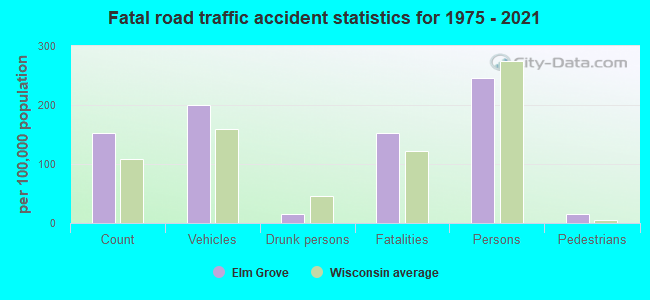
| Murders (per 100,000) | 0 (0.0) | 0 (0.0) | 0 (0.0) | 0 (0.0) | 0 (0.0) | 0 (0.0) | 0 (0.0) | 0 (0.0) | 0 (0.0) | 0 (0.0) | 0 (0.0) | 0 (0.0) | 0 (0.0) | 0 (0.0) |
| Rapes (per 100,000) | 0 (0.0) | 0 (0.0) | 0 (0.0) | 0 (0.0) | 0 (0.0) | 0 (0.0) | 0 (0.0) | 0 (0.0) | 1 (16.1) | 2 (32.2) | 0 (0.0) | 2 (32.5) | 1 (16.2) | 0 (0.0) |
| Robberies (per 100,000) | 0 (0.0) | 0 (0.0) | 0 (0.0) | 0 (0.0) | 0 (0.0) | 1 (16.8) | 3 (48.1) | 1 (16.1) | 3 (48.3) | 0 (0.0) | 0 (0.0) | 0 (0.0) | 2 (32.5) | 1 (15.4) |
| Assaults (per 100,000) | 0 (0.0) | 0 (0.0) | 0 (0.0) | 1 (16.8) | 1 (16.8) | 0 (0.0) | 0 (0.0) | 0 (0.0) | 0 (0.0) | 1 (16.1) | 5 (80.7) | 0 (0.0) | 3 (48.7) | 0 (0.0) |
| Burglaries (per 100,000) | 12 (196.1) | 16 (269.6) | 12 (201.3) | 12 (201.3) | 11 (185.1) | 8 (134.4) | 10 (160.3) | 10 (160.7) | 4 (64.4) | 1 (16.1) | 3 (48.4) | 5 (81.2) | 2 (32.5) | 5 (76.8) |
| Thefts (per 100,000) | 57 (931.7) | 70 (1,180) | 60 (1,007) | 34 (570.3) | 56 (942.4) | 47 (789.5) | 36 (577.0) | 64 (1,029) | 49 (788.3) | 54 (870.3) | 46 (742.5) | 111 (1,802) | 49 (795.7) | 34 (522.1) |
| Auto thefts (per 100,000) | 0 (0.0) | 0 (0.0) | 2 (33.6) | 0 (0.0) | 4 (67.3) | 0 (0.0) | 1 (16.0) | 6 (96.4) | 4 (64.4) | 4 (64.5) | 0 (0.0) | 2 (32.5) | 5 (81.2) | 2 (30.7) |
| Arson (per 100,000) | 0 (0.0) | 0 (0.0) | 0 (0.0) | 0 (0.0) | 0 (0.0) | 0 (0.0) | 0 (0.0) | 0 (0.0) | 0 (0.0) | 1 (16.1) | 0 (0.0) | 1 (16.2) | 0 (0.0) | 0 (0.0) |
| City-Data.com crime index | 51.0 | 66.1 | 57.0 | 40.3 | 59.4 | 46.0 | 50.0 | 64.9 | 68.5 | 70.1 | 49.2 | 106.3 | 73.1 | 33.3 |
The City-Data.com crime index weighs serious crimes and violent crimes more heavily. Higher means more crime, U.S. average is 246.1. It adjusts for the number of visitors and daily workers commuting into cities.
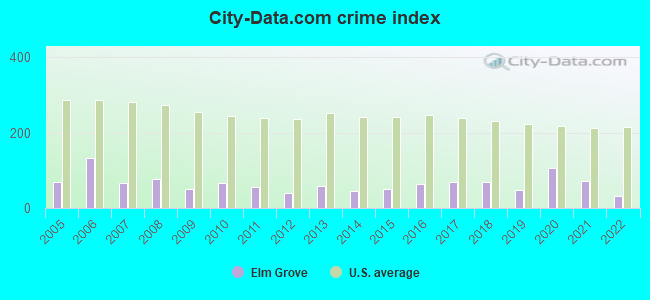
Crime rate in Elm Grove detailed stats: murders, rapes, robberies, assaults, burglaries, thefts, arson
Full-time law enforcement employees in 2021, including police officers: 22 (16 officers - 14 male; 2 female).
| Officers per 1,000 residents here: | 2.60 |
| Wisconsin average: | 2.07 |
 Recent articles from our blog. Our writers, many of them Ph.D. graduates or candidates, create easy-to-read articles on a wide variety of topics.

 | Help with Brookfield/Elm Grove Schools (6 replies) |
| Was it a mistake moving to Wisconsin? (63 replies) |
| Is Wisconsin more racist than even the old South states of yesteryear? (76 replies) |
| Relocating to Milwaukee from South Florida (26 replies) |
| Moving- need a good school (15 replies) |
| Considering Milwaukee from Seattle (25 replies) |
Latest news from Elm Grove, WI collected exclusively by city-data.com from local newspapers, TV, and radio stations
Ancestries: German (26.9%), Polish (9.0%), European (4.9%), Italian (4.9%), American (4.8%), Irish (3.0%).
Current Local Time: CST time zone
Incorporated in 1955
Elevation: 746 feet
Land area: 3.26 square miles.
Population density: 1,943 people per square mile (low).
264 residents are foreign born (3.1% Asia, 0.9% Europe).
| This village: | 4.1% |
| Wisconsin: | 5.0% |
Median real estate property taxes paid for housing units with mortgages in 2022: $6,235 (1.4%)
Median real estate property taxes paid for housing units with no mortgage in 2022: $6,856 (1.4%)
Nearest city with pop. 50,000+: West Allis, WI  (4.4 miles , pop. 61,254).
Nearest city with pop. 200,000+: Milwaukee, WI (6.6 miles , pop. 596,974).
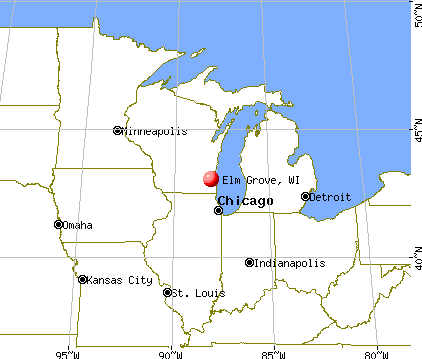
Nearest city with pop. 1,000,000+: Chicago, IL (86.0 miles , pop. 2,896,016).
Nearest cities:
), Latitude: 43.05 N, Longitude: 88.09 W
Daytime population change due to commuting: +265 (+4.1%)
Workers who live and work in this village: 989 (32.5%)
Elm Grove, Wisconsin accommodation & food services, waste management - Economy and Business Data
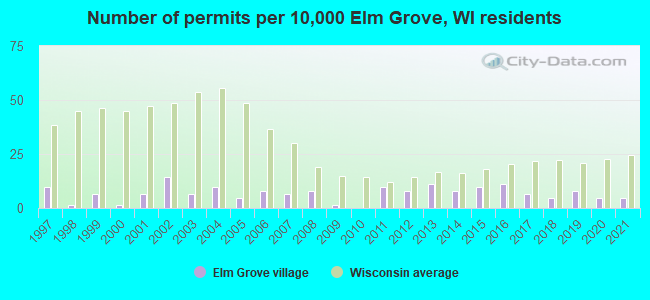
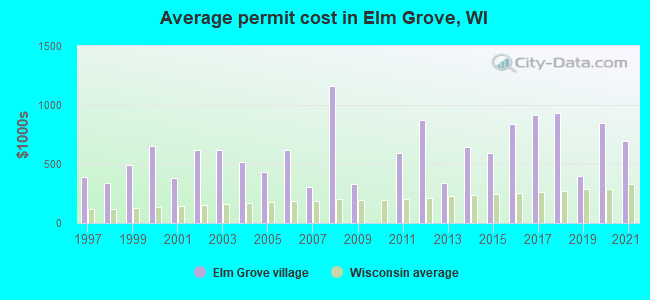
Single-family new house construction building permits:
- 2021: 3 buildings, average cost: $699,100
- 2020: 3 buildings, average cost: $849,700
- 2019: 5 buildings, average cost: $398,000
- 2018: 3 buildings, average cost: $933,300
- 2017: 4 buildings, average cost: $919,400
- 2016: 7 buildings, average cost: $842,000
- 2015: 6 buildings, average cost: $595,800
- 2014: 5 buildings, average cost: $646,800
- 2013: 7 buildings, average cost: $340,700
- 2012: 5 buildings, average cost: $871,000
- 2011: 6 buildings, average cost: $591,500
- 2009: 1 building, cost: $330,000
- 2008: 5 buildings, average cost: $1,163,000
- 2007: 4 buildings, average cost: $306,300
- 2006: 5 buildings, average cost: $619,600
- 2005: 3 buildings, average cost: $434,300
- 2004: 6 buildings, average cost: $514,700
- 2003: 4 buildings, average cost: $620,000
- 2002: 9 buildings, average cost: $619,700
- 2001: 4 buildings, average cost: $383,800
- 2000: 1 building, cost: $650,000
- 1999: 4 buildings, average cost: $491,000
- 1998: 1 building, cost: $340,000
- 1997: 6 buildings, average cost: $390,000
| Here: | 2.3% |
| Wisconsin: | 2.7% |
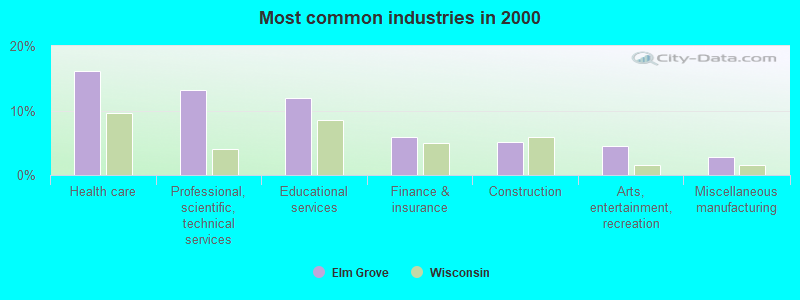
- Health care (16.1%)
- Professional, scientific, technical services (13.2%)
- Educational services (11.9%)
- Finance & insurance (5.9%)
- Construction (5.1%)
- Arts, entertainment, recreation (4.5%)
- Miscellaneous manufacturing (2.9%)
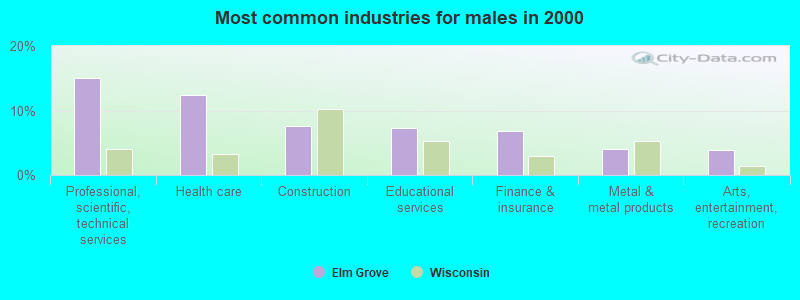
- Professional, scientific, technical services (15.0%)
- Health care (12.5%)
- Construction (7.7%)
- Educational services (7.3%)
- Finance & insurance (6.9%)
- Metal & metal products (4.1%)
- Arts, entertainment, recreation (3.8%)
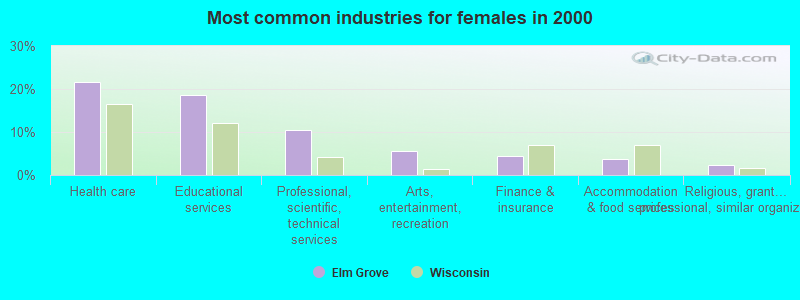
- Health care (21.6%)
- Educational services (18.7%)
- Professional, scientific, technical services (10.5%)
- Arts, entertainment, recreation (5.5%)
- Finance & insurance (4.5%)
- Accommodation & food services (3.7%)
- Religious, grantmaking, civic, professional, similar organizations (2.3%)
- Top executives (6.2%)
- Physicians and surgeons (6.0%)
- Sales representatives, services, wholesale and manufacturing (5.6%)
- Other management occupations, except farmers and farm managers (5.5%)
- Retail sales workers, except cashiers (3.6%)
- Lawyers (3.6%)
- Engineers (3.5%)

- Top executives (9.6%)
- Physicians and surgeons (8.5%)
- Sales representatives, services, wholesale and manufacturing (8.2%)
- Other management occupations, except farmers and farm managers (6.4%)
- Lawyers (6.0%)
- Engineers (5.8%)
- Other sales and related occupations, including supervisors (4.4%)

- Registered nurses (7.6%)
- Retail sales workers, except cashiers (5.8%)
- Other management occupations, except farmers and farm managers (4.1%)
- Information and record clerks, except customer service representatives (4.0%)
- Computer specialists (3.4%)
- Other healthcare support occupations (3.4%)
- Secretaries and administrative assistants (3.4%)
Average climate in Elm Grove, Wisconsin
Based on data reported by over 4,000 weather stations


|
|


(lower is better)
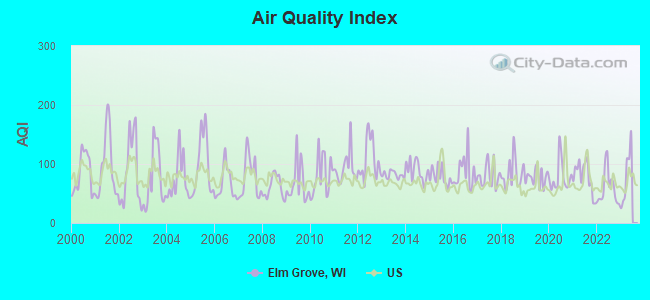
Air Quality Index (AQI) level in 2022 was 59.1. This is better than average.
| City: | 59.1 |
| U.S.: | 72.6 |
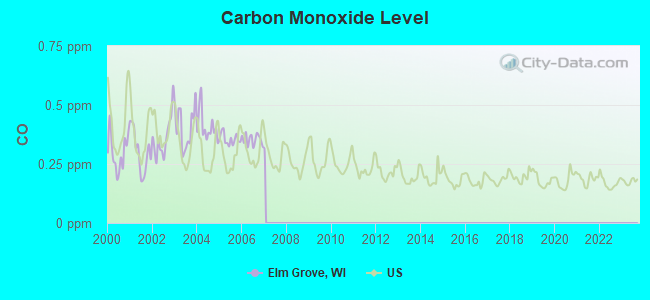
Carbon Monoxide (CO) [ppm] level in 2006 was 0.354. This is significantly worse than average. Closest monitor was 2.8 miles away from the city center.
| City: | 0.354 |
| U.S.: | 0.251 |
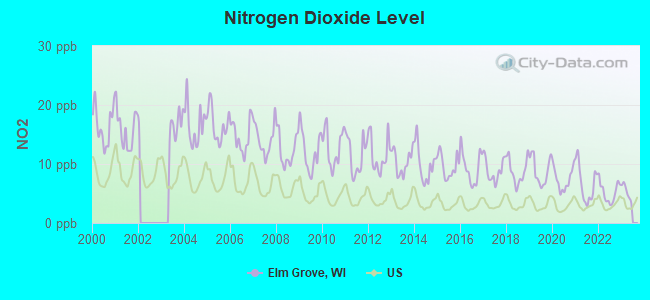
Nitrogen Dioxide (NO2) [ppb] level in 2022 was 5.20. This is about average. Closest monitor was 5.2 miles away from the city center.
| City: | 5.20 |
| U.S.: | 5.11 |
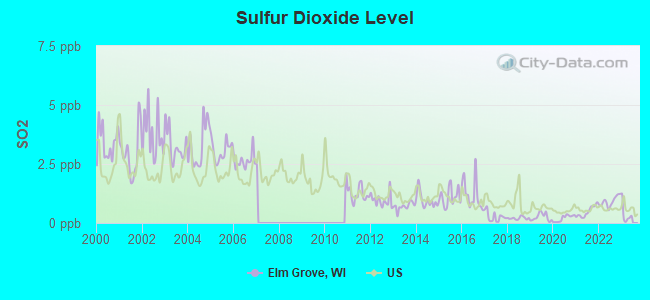
Sulfur Dioxide (SO2) [ppb] level in 2022 was 0.915. This is significantly better than average. Closest monitor was 2.8 miles away from the city center.
| City: | 0.915 |
| U.S.: | 1.515 |
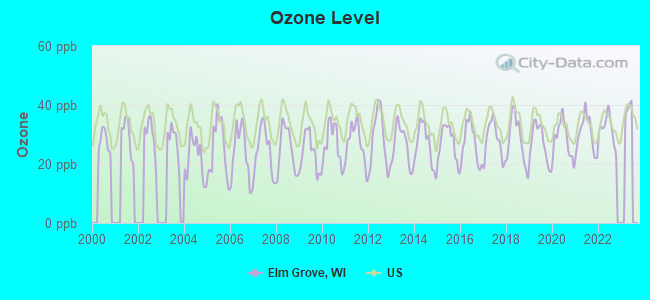
Ozone [ppb] level in 2022 was 31.9. This is about average. Closest monitor was 2.8 miles away from the city center.
| City: | 31.9 |
| U.S.: | 33.3 |
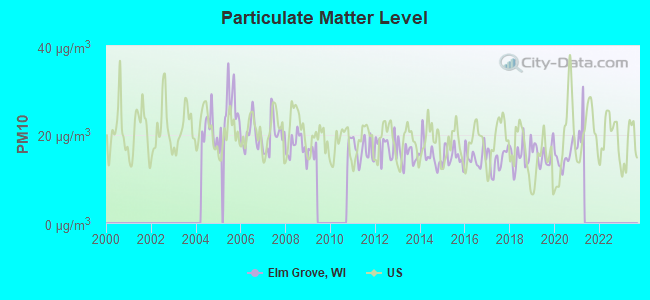
Particulate Matter (PM10) [µg/m3] level in 2020 was 15.0. This is better than average. Closest monitor was 6.8 miles away from the city center.
| City: | 15.0 |
| U.S.: | 19.2 |
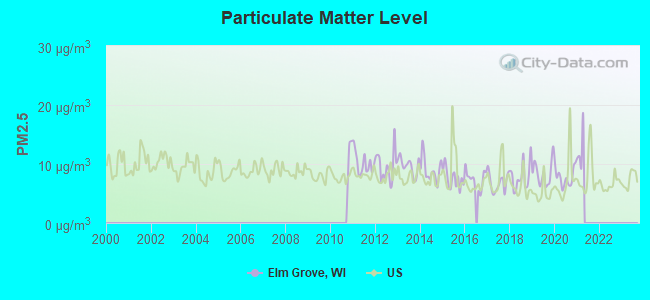
Particulate Matter (PM2.5) [µg/m3] level in 2020 was 7.78. This is about average. Closest monitor was 5.3 miles away from the city center.
| City: | 7.78 |
| U.S.: | 8.11 |
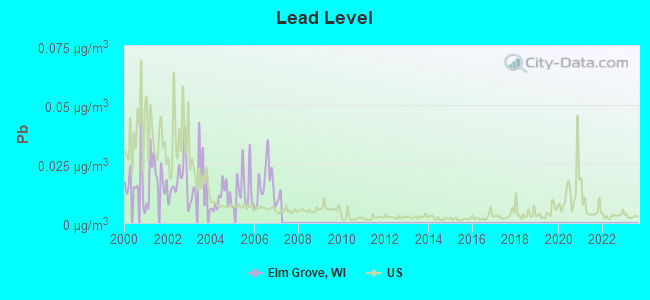
Lead (Pb) [µg/m3] level in 2006 was 0.0169. This is significantly worse than average. Closest monitor was 5.4 miles away from the city center.
| City: | 0.0169 |
| U.S.: | 0.0093 |
Tornado activity:
Elm Grove-area historical tornado activity is slightly above Wisconsin state average. It is 27% greater than the overall U.S. average.
On 4/27/1984, a category F4 (max. wind speeds 207-260 mph) tornado 6.1 miles away from the Elm Grove village center killed one person and injured 14 people and caused between $500,000 and $5,000,000 in damages.
On 8/22/1964, a category F4 tornado 24.5 miles away from the village center injured 30 people and caused between $500,000 and $5,000,000 in damages.
Earthquake activity:
Elm Grove-area historical earthquake activity is significantly above Wisconsin state average. It is 12% greater than the overall U.S. average.On 4/18/2008 at 09:36:59, a magnitude 5.4 (5.1 MB, 4.8 MS, 5.4 MW, 5.2 MW, Class: Moderate, Intensity: VI - VII) earthquake occurred 318.0 miles away from Elm Grove center
On 6/28/2004 at 06:10:52, a magnitude 4.2 (4.2 MW, Depth: 6.2 mi, Class: Light, Intensity: IV - V) earthquake occurred 117.4 miles away from Elm Grove center
On 6/10/1987 at 23:48:54, a magnitude 5.1 (4.9 MB, 4.4 MS, 4.6 MS, 5.1 LG) earthquake occurred 292.5 miles away from the city center
On 4/18/2008 at 09:36:59, a magnitude 5.2 (5.2 MW, Depth: 8.9 mi) earthquake occurred 318.1 miles away from Elm Grove center
On 5/2/2015 at 16:23:07, a magnitude 4.2 (4.2 MW, Depth: 2.8 mi) earthquake occurred 146.4 miles away from the city center
On 2/10/2010 at 09:59:35, a magnitude 3.8 (3.8 MW, Depth: 6.2 mi, Class: Light, Intensity: II - III) earthquake occurred 77.5 miles away from Elm Grove center
Magnitude types: regional Lg-wave magnitude (LG), body-wave magnitude (MB), surface-wave magnitude (MS), moment magnitude (MW)
Natural disasters:
The number of natural disasters in Waukesha County (16) is near the US average (15).Major Disasters (Presidential) Declared: 12
Emergencies Declared: 4
Causes of natural disasters: Storms: 11, Floods: 9, Tornadoes: 2, Drought: 1, Hurricane: 1, Snow: 1, Wind: 1, Winter Storm: 1, Other: 1 (Note: some incidents may be assigned to more than one category).

Hospitals and medical centers in Elm Grove:
Other hospitals and medical centers near Elm Grove:
- ALLAY HOME AND HOSPICE (Home Health Center, about 1 miles away; BROOKFIELD, WI)
- HEARTLAND HHC AND HSPC (Hospital, about 1 miles away; BROOKFIELD, WI)
- NURSEFINDERS OF MILWAUKEE INC (Home Health Center, about 2 miles away; BROOKFIELD, WI)
- WOODLAND HLTH CTR (Nursing Home, about 2 miles away; BROOKFIELD, WI)
- CONGREGATIONAL HOME (Nursing Home, about 2 miles away; BROOKFIELD, WI)
- HEARTLAND HM HLTH CARE AND HSPC (Home Health Center, about 2 miles away; MILWAUKEE, WI)
- MILWAUKEE COUNTY REHAB CTR WEST (Nursing Home, about 3 miles away; WAUWATOSA, WI)
Amtrak station near Elm Grove:
- 9 miles: MILWAUKEE (433 W. ST. PAUL AVE.) . Services: ticket office, fully wheelchair accessible, enclosed waiting area, public restrooms, public payphones, full-service food facilities, paid short-term parking, paid long-term parking, call for car rental service, taxi stand, public transit connection.
Colleges/universities with over 2000 students nearest to Elm Grove:
- Carroll University (about 8 miles; Waukesha, WI; Full-time enrollment: 3,313)
- Marquette University (about 9 miles; Milwaukee, WI; FT enrollment: 9,844)
- Milwaukee Area Technical College (about 9 miles; Milwaukee, WI; FT enrollment: 13,156)
- Waukesha County Technical College (about 9 miles; Pewaukee, WI; FT enrollment: 4,415)
- Milwaukee School of Engineering (about 10 miles; Milwaukee, WI; FT enrollment: 2,386)
- University of Wisconsin-Milwaukee (about 11 miles; Milwaukee, WI; FT enrollment: 24,196)
- Cardinal Stritch University (about 12 miles; Milwaukee, WI; FT enrollment: 3,595)
Public elementary/middle schools in Elm Grove:
- PILGRIM PARK MIDDLE (Students: 809, Location: 1500 PILGRIM PKWY, Grades: 6-8)
- TONAWANDA ELEMENTARY (Students: 407, Location: 13605 UNDERWOOD RIVER PKWY, Grades: PK-5)
Private elementary/middle schools in Elm Grove:
Points of interest:
Notable locations in Elm Grove: Elm Grove Emergency Medical Services (A), Elm Grove Volunteer Fire Department (B), Elm Grove Village Hall (C), Elm Grove Public Library (D). Display/hide their locations on the map
Churches in Elm Grove include: Notre Dame Convent (A), Saint Marys Catholic Church (B), Elm Grove Lutheran Church (C), Saint Edmunds Episcopal Church (D). Display/hide their locations on the map
Park in Elm Grove: Elm Grove Village Park (1). Display/hide its location on the map
Court: Village Court Limited (890 Elm Grove Road).
Drinking water stations with addresses in Elm Grove and their reported violations in the past:
ELM GROVE TERRACE (Population served: 65, Groundwater):Past monitoring violations:
- Lead Consumer Notice - In JAN-01-2013, Contaminant: Lead and Copper Rule. Follow-up actions: St Other (JAN-01-2013), St Compliance achieved (JUN-16-2014)
- 3 routine major monitoring violations
Drinking water stations with addresses in Elm Grove that have no violations reported:
- SUNSET PLAYHOUSE (Population served: 303, Primary Water Source Type: Groundwater)
- SHOPS OF ELM GROVE - ETHEL & MAES (Population served: 57, Primary Water Source Type: Groundwater)
- O DONOGHUES IRISH PUB (Population served: 53, Primary Water Source Type: Groundwater)
- SILVER SPUR BBQ (Population served: 34, Primary Water Source Type: Groundwater)
| This village: | 2.5 people |
| Wisconsin: | 2.4 people |
| This village: | 72.3% |
| Whole state: | 64.4% |
| This village: | 2.5% |
| Whole state: | 7.3% |
Likely homosexual households (counted as self-reported same-sex unmarried-partner households)
- Lesbian couples: 0.1% of all households
- Gay men: 0.3% of all households
8 people in group homes intended for adults in 2010
150 people in nursing homes in 2000
7 people in other group homes in 2000
Banks with branches in Elm Grove (2011 data):
- U.S. Bank National Association: Elm Grove Branch at 945 Elm Grove Rd, branch established on 1979/04/30. Info updated 2012/01/30: Bank assets: $330,470.8 mil, Deposits: $236,091.5 mil, headquarters in Cincinnati, OH, positive income, 3121 total offices, Holding Company: U.S. Bancorp
- Securant Bank & Trust: Elm Grove Branch at 12960 West Bluemound Road, branch established on 2009/02/01. Info updated 2008/06/20: Bank assets: $226.7 mil, Deposits: $197.8 mil, headquarters in Menomonee Falls, WI, negative income in the last year, Commercial Lending Specialization, 5 total offices, Holding Company: Capital Commerce Bancorp, Inc.
- Town Bank: Elm Grove Office Branch at 12960 W. Bluemound Road, branch established on 2006/04/17. Info updated 2007/07/12: Bank assets: $792.0 mil, Deposits: $672.2 mil, headquarters in Hartland, WI, positive income, Commercial Lending Specialization, 6 total offices, Holding Company: Wintrust Financial Corporation
- TCF National Bank: Elm Grove Branch #1018 at 12850 W. Bluemound Road, branch established on 1923/01/01. Info updated 2009/11/23: Bank assets: $19,007.0 mil, Deposits: $12,377.0 mil, headquarters in Sioux Falls, SD, positive income, Commercial Lending Specialization, 441 total offices, Holding Company: Tcf Financial Corporation
- BMO Harris Bank National Association: Elm Grove Branch at 900 Elm Grove Road, branch established on 1947/03/01. Info updated 2011/07/14: Bank assets: $97,264.0 mil, Deposits: $75,624.6 mil, headquarters in Chicago, IL, positive income, 717 total offices, Holding Company: Bank Of Montreal
For population 15 years and over in Elm Grove:
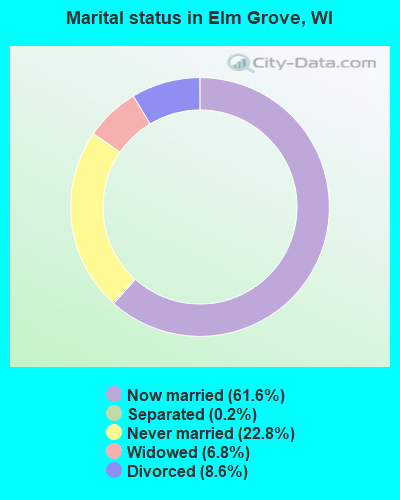
- Never married: 22.8%
- Now married: 61.6%
- Separated: 0.2%
- Widowed: 6.8%
- Divorced: 8.6%
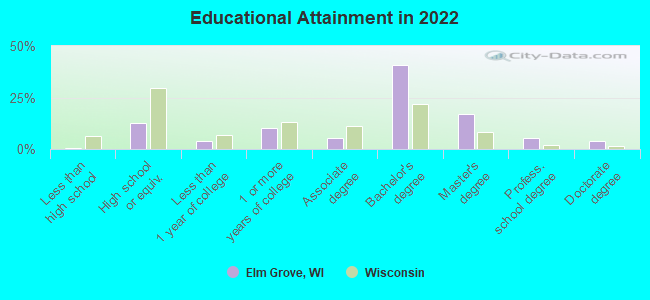
For population 25 years and over in Elm Grove:
- High school or higher: 98.9%
- Bachelor's degree or higher: 65.9%
- Graduate or professional degree: 24.3%
- Unemployed: 3.0%
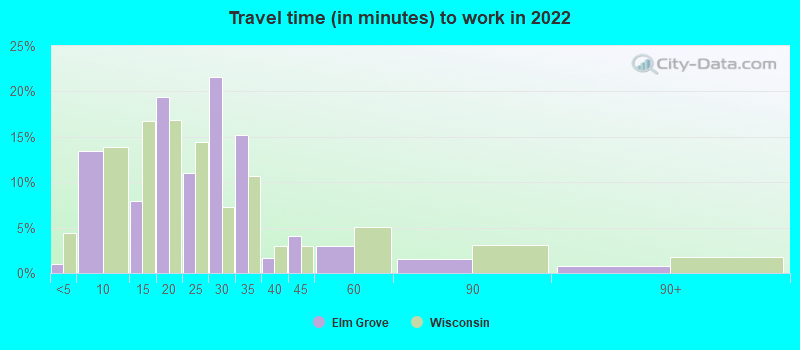
- Mean travel time to work (commute): 17.6 minutes
| Here: | 8.3 |
| Wisconsin average: | 10.4 |
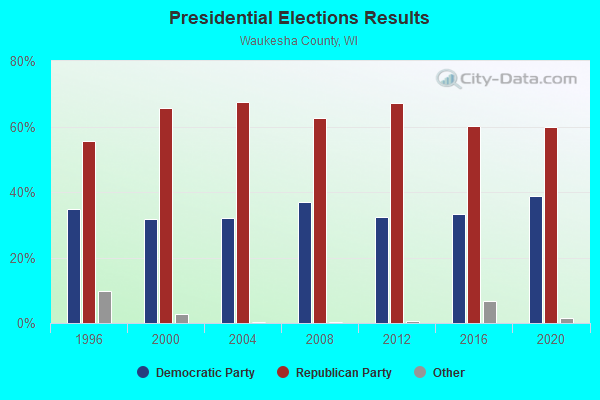
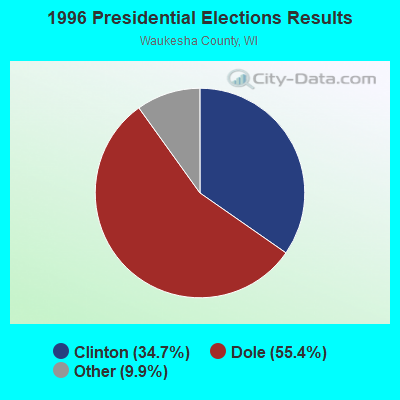
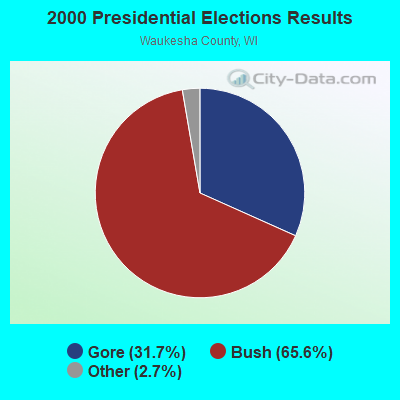
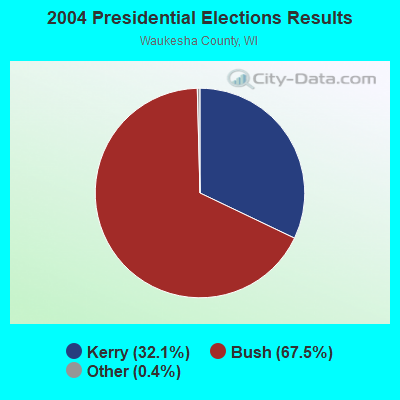
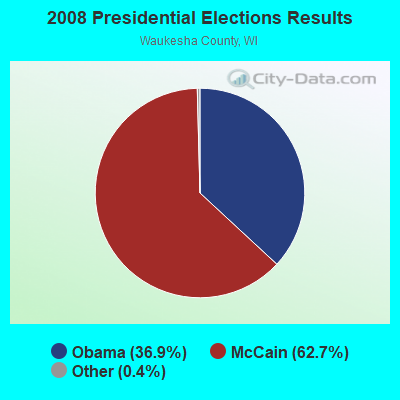

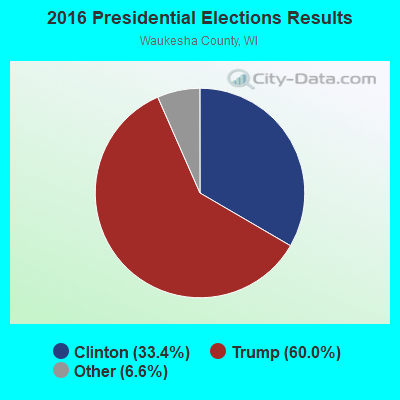
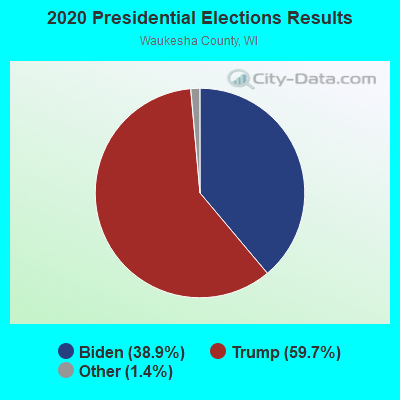
Graphs represent county-level data. Detailed 2008 Election Results
Religion statistics for Elm Grove, WI (based on Waukesha County data)
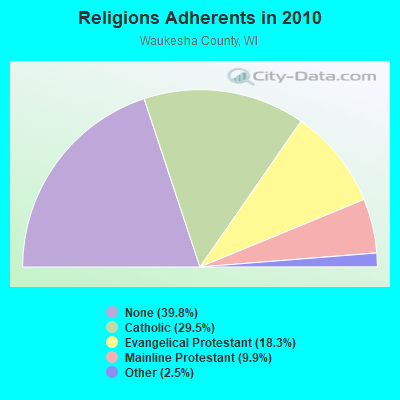
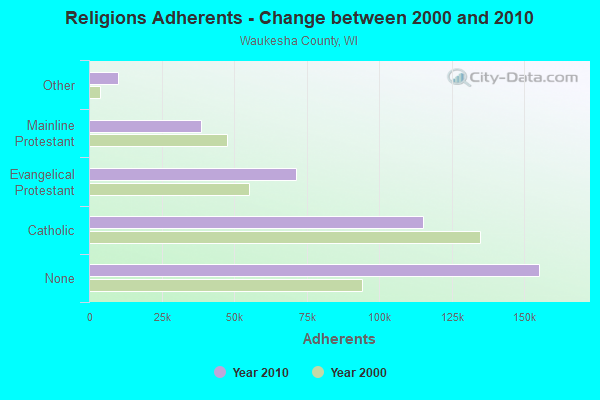
| Religion | Adherents | Congregations |
|---|---|---|
| Catholic | 115,008 | 28 |
| Evangelical Protestant | 71,237 | 128 |
| Mainline Protestant | 38,654 | 87 |
| Other | 9,840 | 29 |
| None | 155,152 | - |
Food Environment Statistics:
| This county: | 1.51 / 10,000 pop. |
| Wisconsin: | 1.86 / 10,000 pop. |
| Waukesha County: | 0.03 / 10,000 pop. |
| Wisconsin: | 0.11 / 10,000 pop. |
| Waukesha County: | 0.13 / 10,000 pop. |
| State: | 0.38 / 10,000 pop. |
| Here: | 2.80 / 10,000 pop. |
| Wisconsin: | 4.12 / 10,000 pop. |
| Waukesha County: | 7.47 / 10,000 pop. |
| Wisconsin: | 8.64 / 10,000 pop. |
| Here: | 6.7% |
| Wisconsin: | 7.6% |
| Waukesha County: | 26.8% |
| State: | 27.5% |
| Waukesha County: | 13.2% |
| State: | 13.0% |
Health and Nutrition:
| This city: | 63.6% |
| Wisconsin: | 49.5% |
| This city: | 64.7% |
| Wisconsin: | 46.6% |
| Elm Grove: | 27.5 |
| Wisconsin: | 28.7 |
| This city: | 12.0% |
| Wisconsin: | 21.4% |
| Elm Grove: | 7.0 |
| Wisconsin: | 6.8 |
| This city: | 31.7% |
| Wisconsin: | 34.0% |
| Elm Grove: | 67.6% |
| Wisconsin: | 56.3% |
| Elm Grove: | 79.0% |
| State: | 78.5% |
More about Health and Nutrition of Elm Grove, WI Residents
| Local government employment and payroll (March 2022) | |||||
| Function | Full-time employees | Monthly full-time payroll | Average yearly full-time wage | Part-time employees | Monthly part-time payroll |
|---|---|---|---|---|---|
| Police Protection - Officers | 16 | $124,651 | $93,488 | 0 | $0 |
| Streets and Highways | 7 | $45,594 | $78,161 | 2 | $467 |
| Police - Other | 6 | $27,225 | $54,450 | 0 | $0 |
| Local Libraries | 3 | $15,664 | $62,656 | 12 | $11,517 |
| Other Government Administration | 2 | $17,221 | $103,326 | 2 | $3,645 |
| Financial Administration | 2 | $17,351 | $104,106 | 0 | $0 |
| Natural Resources | 1 | $6,300 | $75,600 | 0 | $0 |
| Parks and Recreation | 1 | $4,778 | $57,336 | 0 | $0 |
| Other and Unallocable | 1 | $5,731 | $68,772 | 0 | $0 |
| Judicial and Legal | 0 | $0 | 2 | $1,461 | |
| Firefighters | 0 | $0 | 1 | $3,317 | |
| Totals for Government | 39 | $264,514 | $81,389 | 19 | $20,407 |
Elm Grove government finances - Expenditure in 2018 (per resident):
- Construction - Regular Highways: $179,000 ($28.28)
General - Other: $89,000 ($14.06)
Parks and Recreation: $25,000 ($3.95)
Libraries: $14,000 ($2.21)
Sewerage: $10,000 ($1.58)
Health - Other: $9,000 ($1.42)
- Current Operations - Police Protection: $2,748,000 ($434.19)
Sewerage: $2,065,000 ($326.28)
Regular Highways: $1,048,000 ($165.59)
Solid Waste Management: $496,000 ($78.37)
Libraries: $479,000 ($75.68)
Health - Other: $376,000 ($59.41)
Central Staff Services: $337,000 ($53.25)
Local Fire Protection: $328,000 ($51.82)
Parks and Recreation: $314,000 ($49.61)
Financial Administration: $251,000 ($39.66)
General Public Buildings: $203,000 ($32.07)
Natural Resources - Other: $137,000 ($21.65)
Judicial and Legal Services: $129,000 ($20.38)
General - Other: $113,000 ($17.85)
Protective Inspection and Regulation - Other: $91,000 ($14.38)
- General - Interest on Debt: $189,000 ($29.86)
- Other Capital Outlay - Local Fire Protection: $174,000 ($27.49)
Regular Highways: $123,000 ($19.43)
Police Protection: $120,000 ($18.96)
Central Staff Services: $10,000 ($1.58)
Elm Grove government finances - Revenue in 2018 (per resident):
- Charges - Sewerage: $931,000 ($147.10)
Solid Waste Management: $514,000 ($81.21)
Regular Highways: $456,000 ($72.05)
Parks and Recreation: $162,000 ($25.60)
Other: $148,000 ($23.38)
Natural Resources - Other: $3,000 ($0.47)
- Local Intergovernmental - Other: $248,000 ($39.18)
- Miscellaneous - Fines and Forfeits: $177,000 ($27.97)
Donations From Private Sources: $174,000 ($27.49)
Rents: $136,000 ($21.49)
General Revenue - Other: $30,000 ($4.74)
Sale of Property: $21,000 ($3.32)
Interest Earnings: $0 ($0.00)
- State Intergovernmental - Highways: $380,000 ($60.04)
General Local Government Support: $206,000 ($32.55)
Education: $152,000 ($24.02)
Other: $49,000 ($7.74)
- Tax - Property: $7,337,000 ($1159.27)
Other License: $148,000 ($23.38)
Occupation and Business License - Other: $75,000 ($11.85)
Elm Grove government finances - Debt in 2018 (per resident):
- Long Term Debt - Beginning Outstanding - Unspecified Public Purpose: $7,858,000 ($1241.59)
Outstanding Unspecified Public Purpose: $7,130,000 ($1126.56)
Retired Unspecified Public Purpose: $728,000 ($115.03)
| Businesses in Elm Grove, WI | ||||
| Name | Count | Name | Count | |
|---|---|---|---|---|
| Ace Hardware | 1 | FedEx | 2 | |
| Bakers Square | 1 | UPS | 4 | |
Strongest AM radio stations in Elm Grove:
- WOKY (920 AM; 5 kW; MILWAUKEE, WI; Owner: CLEAR CHANNEL BROADCASTING LICENSES, INC.)
- WAUK (1510 AM; daytime; 10 kW; WAUKESHA, WI; Owner: WALT-WEST WISCONSIN, INC.)
- WKSH (1640 AM; 10 kW; SUSSEX, WI; Owner: ABC, INC.)
- WTMJ (620 AM; 50 kW; MILWAUKEE, WI; Owner: JOURNAL BROADCAST CORPORATION)
- WISN (1130 AM; 50 kW; MILWAUKEE, WI; Owner: CAPSTAR TX LIMITED PARTNERSHIP)
- WEMP (1250 AM; 5 kW; MILWAUKEE, WI; Owner: ENTERCOM MILWAUKEE LICENSE, LLC)
- WMCS (1290 AM; 5 kW; GREENFIELD, WI; Owner: MILWAUKEE RADIO ALLIANCE, LLC)
- WJYI (1340 AM; 1 kW; MILWAUKEE, WI; Owner: LAKEFRONT COMMUNICATIONS, LLC)
- WGN (720 AM; 50 kW; CHICAGO, IL; Owner: WGN CONTINENTAL BROADCASTING CO.)
- WSCR (670 AM; 50 kW; CHICAGO, IL; Owner: INFINITY BROADCASTING OPERATIONS, INC.)
- WGLB (1560 AM; 0 kW; ELM GROVE, WI)
- WBBM (780 AM; 50 kW; CHICAGO, IL; Owner: INFINITY BROADCASTING OPERATIONS, INC.)
- WMVP (1000 AM; 50 kW; CHICAGO, IL; Owner: ABC, INC.)
Strongest FM radio stations in Elm Grove:
- WVCY-FM (107.7 FM; MILWAUKEE, WI; Owner: VCY AMERICA, INC.)
- WJZI (93.3 FM; MILWAUKEE, WI; Owner: MILWAUKEE RADIO ALLIANCE, LLC)
- WLTQ (97.3 FM; MILWAUKEE, WI; Owner: CAPSTAR TX LIMITED PARTNERSHIP)
- WLZR (102.9 FM; MILWAUKEE, WI; Owner: LAKEFRONT COMMUNICATIONS, LLC)
- WMIL-FM (106.1 FM; WAUKESHA, WI; Owner: CLEAR CHANNEL BROADCASTING LICENSES, INC.)
- WJMR-FM (98.3 FM; MENOMONEE FALLS, WI; Owner: LAKEFRONT COMMUNICATIONS, LLC)
- WKTI-FM (94.5 FM; MILWAUKEE, WI; Owner: JOURNAL BROADCAST CORPORATION)
- WFZH (105.3 FM; MUKWONAGO, WI; Owner: CARON BROADCASTING, INC.)
- WXSS (103.7 FM; WAUWATOSA, WI; Owner: ENTERCOM MILWAUKEE LICENSE, LLC)
- WUWM (89.7 FM; MILWAUKEE, WI; Owner: BOARD OF REGENTS, UNIVERSITY OF WISCONSIN SYSTEM)
- WKLH (96.5 FM; MILWAUKEE, WI; Owner: LAKEFRONT COMMUNICATIONS, LLC)
- WLUM-FM (102.1 FM; MILWAUKEE, WI; Owner: MILWAUKEE RADIO ALLIANCE, LLC)
- WMWK (88.1 FM; MILWAUKEE, WI; Owner: FAMILY STATIONS, INC.)
- WMYX-FM (99.1 FM; MILWAUKEE, WI; Owner: ENTERCOM MILWAUKEE LICENSE, LLC)
- WRIT-FM (95.7 FM; MILWAUKEE, WI; Owner: CLEAR CHANNEL BROADCASTING LICENSES, INC.)
- WFMR (106.9 FM; BROOKFIELD, WI; Owner: SAGA COMMUNICATIONS OF MILWAUKEE, LLC)
- WHAD (90.7 FM; DELAFIELD, WI; Owner: STATE OF WISCONSIN - EDUCATIONAL COMMUNICATIONS BOARD)
- WKKV-FM (100.7 FM; RACINE, WI; Owner: CLEAR CHANNEL BROADCASTING LICENSES, INC.)
- WYMS (88.9 FM; MILWAUKEE, WI; Owner: MILWAUKEE BOARD OF SCHOOL DIRECTORS)
- WMSE (91.7 FM; MILWAUKEE, WI; Owner: MILWAUKEE SCHOOL OF ENGINEERING)
TV broadcast stations around Elm Grove:
- WDJT-TV (Channel 58; MILWAUKEE, WI; Owner: WDJT-TV LIMITED PARTNERSHIP)
- WISN-TV (Channel 12; MILWAUKEE, WI; Owner: WISN HEARST-ARGYLE TV, INC. (CA CORP.))
- WMLW-CA (Channel 46; MILWAUKEE, WI; Owner: CHANNEL 41 AND 63 LIMITED PARTNERSHIP)
- WPXE (Channel 55; KENOSHA, WI; Owner: PAXSON MILWAUKEE LICENSE, INC.)
- WMVS (Channel 10; MILWAUKEE, WI; Owner: MILWAUKEE AREA TECHNICAL COLLEGE DISTRICT BOARD)
- W63CU (Channel 63; MILWAUKEE, WI; Owner: CHANNEL 41 AND 63 LIMITED PARTNERSHIP)
- WMVT (Channel 36; MILWAUKEE, WI; Owner: MILWAUKEE AREA TECHNICAL COLLEGE DISTRICT BOARD)
- WCGV-TV (Channel 24; MILWAUKEE, WI; Owner: WCGV LICENSEE, LLC)
- WVTV (Channel 18; MILWAUKEE, WI; Owner: WVTV LICENSEE, INC.)
- WTMJ-TV (Channel 4; MILWAUKEE, WI; Owner: JOURNAL BROADCAST CORPORATION)
- WVCY-TV (Channel 30; MILWAUKEE, WI; Owner: VCY AMERICA, INC.)
- WMKE-CA (Channel 7; MILWAUKEE, WI; Owner: KM LPTV OF MILWAUKEE, L.L.C.)
- WITI (Channel 6; MILWAUKEE, WI; Owner: WITI LICENSE,INC.)
- WTAS-LP (Channel 43; WAUKESHA, WI; Owner: WAUKESHA TOWER ASSOCIATES)
- WJJA (Channel 49; RACINE, WI; Owner: TV-49, INC.)
- WWRS-TV (Channel 52; MAYVILLE, WI; Owner: NATIONAL MINORITY T.V., INC.)
- W64CQ (Channel 64; ARLINGTON HEIGHTS, IL; Owner: TRINITY BROADCASTING NETWORK)
- WMMF-TV (Channel 68; FOND DU LAC, WI; Owner: PAPPAS TELECASTING OF WISCONSIN, A CALIFORNIA LTD PARTNRSHP)
- National Bridge Inventory (NBI) Statistics
- 6Number of bridges
- 20ft / 6.3mTotal length
- $313,000Total costs
- 13,345Total average daily traffic
- 14Total average daily truck traffic
- 20,018Total future (year 2036) average daily traffic
FCC Registered Cell Phone Towers:
1 (See the full list of FCC Registered Cell Phone Towers in Elm Grove)FCC Registered Antenna Towers:
15 (See the full list of FCC Registered Antenna Towers)FCC Registered Commercial Land Mobile Towers:
1- Lat: 43.038333 Lon: -88.072028, Call Sign: KQV761,
Assigned Frequencies: 161.670 MHz, 161.670 MHz, 161.730 MHz, 161.730 MHz, Grant Date: 08/11/2000, Expiration Date: 06/01/2013, Cancellation Date: 03/10/2010, Registrant: Hallmark National Mortgage Corporation, 200 N. State Street, Little Rock, AR 72201
FCC Registered Broadcast Land Mobile Towers:
6- 13600 W Juneau (Lat: 43.047500 Lon: -88.091194), Call Sign: KNCE667, Licensee ID: L00090705,
Assigned Frequencies: 155.085 MHz, Grant Date: 06/21/1999, Expiration Date: 08/30/2004, Cancellation Date: 10/30/2004, Registrant: Elm Grove, Village Of, 13600 Juneau Blvd, Elm Grove, WI 53122, Phone: (414) 782-6700
- 13600 W Juneau Blvd (Lat: 43.047500 Lon: -88.091194), Call Sign: KNAB466, Licensee ID: L00090705,
Assigned Frequencies: 155.370 MHz, Grant Date: 04/20/2022, Expiration Date: 07/17/2032, Registrant: Elm Grove, Village Of, 13600 W Juneau Blvd, Elm Grove, WI 53122, Phone: (262) 786-4141, Email:
- 13105 Watertown Plank Rd (Lat: 43.044167 Lon: -88.077028), Type: Building, Structure height: 9 m, Call Sign: WPGB741,
Assigned Frequencies: 462.875 MHz, Grant Date: 12/20/1999, Expiration Date: 12/07/2004, Cancellation Date: 02/12/2005, Registrant: School Sisters Of Notre Dame, 13105 Watertown Plank Rd, Elm Grove, WI 53122, Phone: (414) 782-1450
- Lat: 43.055556 Lon: -88.081750, Call Sign: WPMV886,
Assigned Frequencies: 452.712 MHz, 452.987 MHz, 457.712 MHz, 457.987 MHz, 462.187 MHz, 462.512 MHz, 467.512 MHz, Grant Date: 01/29/2024, Expiration Date: 02/10/2034, Certifier: Jimmie L Pfannenstiel, Registrant: United Parcel Service, Inc., 2200 Outer Loop, Louisville, KY 40219-3565, Phone: (502) 961-1406, Fax: (502) 374-2149, Email:
- 13105 Watertown Plank Road (Lat: 43.044444 Lon: -88.074722), Call Sign: WQRW247,
Assigned Frequencies: 464.112 MHz, 469.112 MHz, 464.187 MHz, 469.187 MHz, Grant Date: 08/05/2013, Expiration Date: 08/05/2023, Cancellation Date: 10/07/2023, Certifier: Bradford Alt, Registrant: Milwaukee 2-Way Inc, 11408 W Lincoln Ave, West Allis, WI 53227, Phone: (414) 546-7622, Fax: (414) 546-2526, Email:
- 14700 Watertown Plank Road (Lat: 43.040500 Lon: -88.096111), Call Sign: WQYU685,
Assigned Frequencies: 462.212 MHz, 462.362 MHz, Grant Date: 01/26/2017, Expiration Date: 01/26/2027, Certifier: Tracey Magyar, Registrant: General Communications Inc, 2880 Commerce Park Drive, Madison, WI 53719, Phone: (608) 310-7091, Email:
FCC Registered Microwave Towers:
1- 12800 W.Bluemound Road (Lat: 43.038611 Lon: -88.072583), Overall height: 175.9 m, Call Sign: WLE214, Licensee ID: L00754208,
Assigned Frequencies: 945.000 MHz, Grant Date: 07/27/1990, Expiration Date: 12/01/2004, Cancellation Date: 10/16/2003, Registrant: Milwaukee Radio Alliance, LLC, 2979 North Mayfair Road, Milwaukee, WI 53222
FCC Registered Paging Towers:
1- 12700 W Bluemound Rd (Lat: 43.038333 Lon: -88.072028), Overall height: 138.1 m, Call Sign: KNKO362,
Assigned Frequencies: 931.337 MHz, Grant Date: 08/14/2018, Expiration Date: 07/01/2028, Certifier: J. Roy Pottle, Registrant: Wilkinson Barker Knauer, LLP, 1800 M Street, N.W., Suite 800n, Washington, DC 20036, Phone: (202) 783-4141, Fax: (202) 783-5851, Email:
FCC Registered Amateur Radio Licenses:
28 (See the full list of FCC Registered Amateur Radio Licenses in Elm Grove)FAA Registered Aircraft:
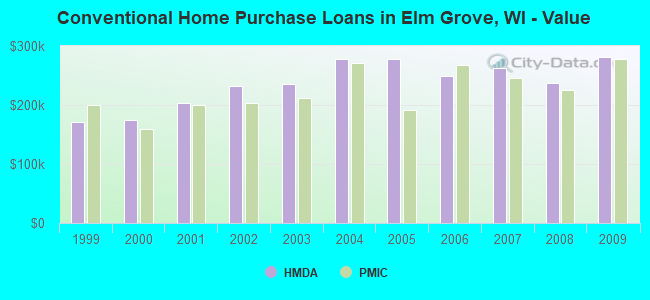
10 (See the full list of FAA Registered Aircraft in Elm Grove)| Home Mortgage Disclosure Act Aggregated Statistics For Year 2009 (Based on 1 full tract) | ||||||||||
| A) FHA, FSA/RHS & VA Home Purchase Loans | B) Conventional Home Purchase Loans | C) Refinancings | D) Home Improvement Loans | F) Non-occupant Loans on < 5 Family Dwellings (A B C & D) | ||||||
|---|---|---|---|---|---|---|---|---|---|---|
| Number | Average Value | Number | Average Value | Number | Average Value | Number | Average Value | Number | Average Value | |
| LOANS ORIGINATED | 5 | $160,522 | 54 | $282,074 | 337 | $267,184 | 8 | $217,028 | 15 | $297,386 |
| APPLICATIONS APPROVED, NOT ACCEPTED | 0 | $0 | 6 | $298,005 | 13 | $231,391 | 1 | $175,970 | 1 | $184,770 |
| APPLICATIONS DENIED | 0 | $0 | 4 | $310,142 | 46 | $303,332 | 1 | $11,730 | 1 | $650,100 |
| APPLICATIONS WITHDRAWN | 0 | $0 | 3 | $281,550 | 51 | $261,709 | 2 | $75,765 | 2 | $407,660 |
| FILES CLOSED FOR INCOMPLETENESS | 0 | $0 | 1 | $407,660 | 9 | $312,180 | 0 | $0 | 1 | $407,660 |
Detailed HMDA statistics for the following Tracts: 2010.00
| Private Mortgage Insurance Companies Aggregated Statistics For Year 2009 (Based on 1 full tract) | ||||
| A) Conventional Home Purchase Loans | B) Refinancings | |||
|---|---|---|---|---|
| Number | Average Value | Number | Average Value | |
| LOANS ORIGINATED | 10 | $277,736 | 8 | $307,700 |
| APPLICATIONS APPROVED, NOT ACCEPTED | 1 | $395,930 | 1 | $185,740 |
| APPLICATIONS DENIED | 1 | $395,930 | 0 | $0 |
| APPLICATIONS WITHDRAWN | 0 | $0 | 0 | $0 |
| FILES CLOSED FOR INCOMPLETENESS | 0 | $0 | 0 | $0 |
Detailed PMIC statistics for the following Tracts: 2010.00

2002 - 2018 National Fire Incident Reporting System (NFIRS) incidents
- Fire incident types reported to NFIRS in Elm Grove, WI
- 8762.1%Structure Fires
- 2316.4%Mobile Property/Vehicle Fires
- 2014.3%Outside Fires
- 107.1%Other
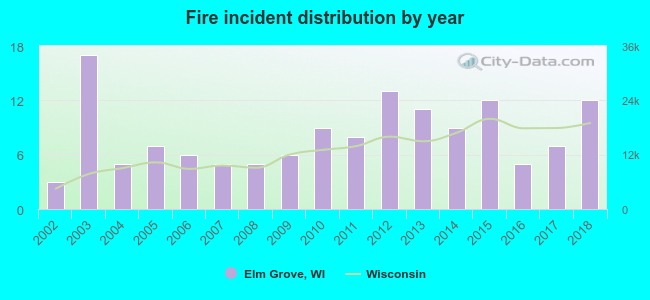 Based on the data from the years 2002 - 2018 the average number of fire incidents per year is 8. The highest number of fires - 17 took place in 2003, and the least - 3 in 2002. The data has an increasing trend.
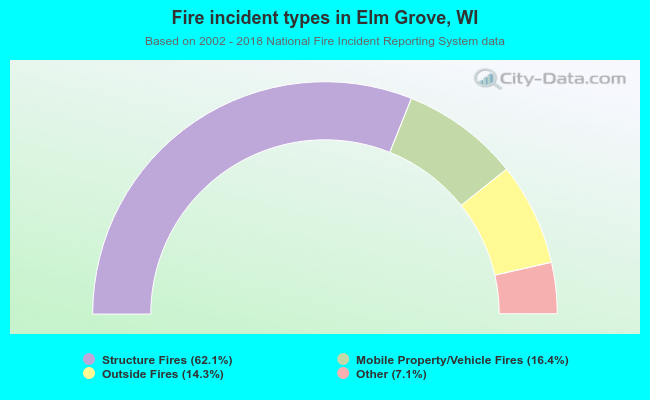 When looking into fire subcategories, the most incidents belonged to: Structure Fires (62.1%), and Mobile Property/Vehicle Fires (16.4%).
| Most common first names in Elm Grove, WI among deceased individuals | ||
| Name | Count | Lived (average) |
|---|---|---|
| Mary | 121 | 82.7 years |
| John | 65 | 76.5 years |
| William | 50 | 77.8 years |
| Robert | 43 | 74.8 years |
| Margaret | 28 | 83.0 years |
| Dorothy | 26 | 80.5 years |
| Joseph | 26 | 77.2 years |
| James | 25 | 77.7 years |
| Sr | 24 | 87.4 years |
| Helen | 24 | 84.9 years |
| Most common last names in Elm Grove, WI among deceased individuals | ||
| Last name | Count | Lived (average) |
|---|---|---|
| Mueller | 11 | 77.5 years |
| Nelson | 9 | 73.7 years |
| Johnson | 8 | 76.7 years |
| Miller | 8 | 77.3 years |
| Smith | 7 | 79.8 years |
| Schmitz | 7 | 74.4 years |
| Behling | 6 | 75.8 years |
| Larson | 6 | 74.3 years |
| Adams | 6 | 76.5 years |
| Sanders | 6 | 74.7 years |
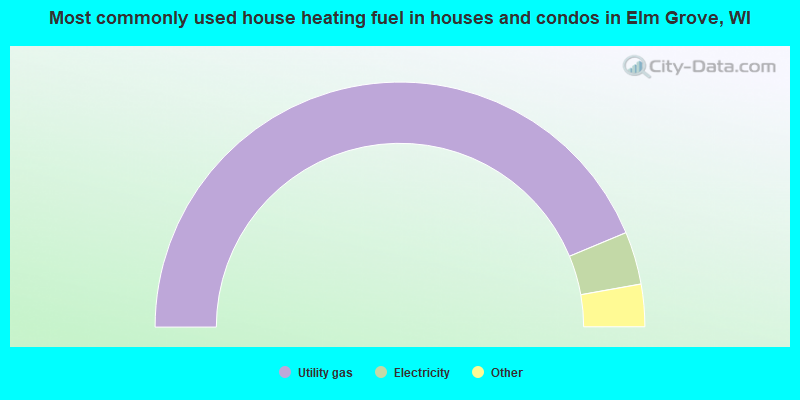
- 87.5%Utility gas
- 7.0%Electricity
- 2.3%Bottled, tank, or LP gas
- 1.7%Fuel oil, kerosene, etc.
- 1.5%Coal or coke
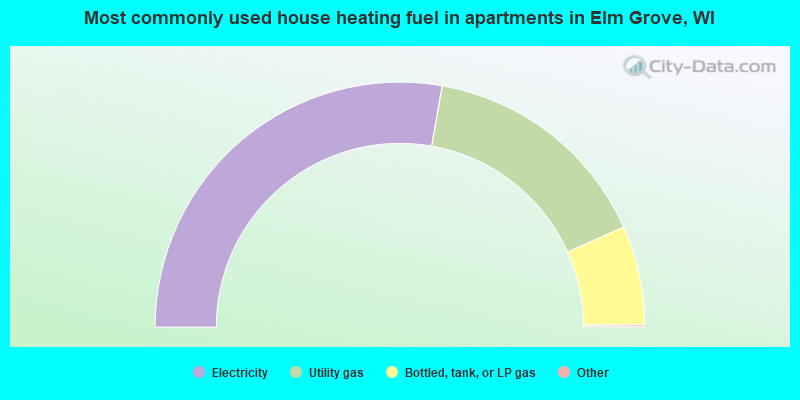
- 55.7%Electricity
- 31.2%Utility gas
- 13.1%Bottled, tank, or LP gas
Elm Grove compared to Wisconsin state average:
- Median household income above state average.
- Median house value above state average.
- Unemployed percentage significantly below state average.
- Median age above state average.
- Renting percentage significantly below state average.
- Length of stay since moving in significantly above state average.
- Number of rooms per house above state average.
- Percentage of population with a bachelor's degree or higher significantly above state average.
Elm Grove on our top lists:
- #18 on the list of "Top 101 cities with largest percentage of females in occupations: health diagnosing and treating practitioners and other technical occupations (population 5,000+)"
- #23 on the list of "Top 101 cities with the lowest number of auto thefts per 100,000 residents (population 5,000+)"
- #41 on the list of "Top 101 cities with the smallest city-data.com crime index per police officer (population 5,000+)"
- #48 on the list of "Top 101 cities with the highest cost per building permit(population 5,000+)"
- #61 on the list of "Top 101 cities with largest percentage of males in occupations: community and social service occupations (population 5,000+)"
- #75 on the list of "Top 100 best educated cities (highest percentage of bachelor degree holding residents) (pop. 5,000+)"
- #79 (53122) on the list of "Top 101 zip codes with the largest percentage of taxpayers using charity contributions deductions in 2012 (pop 5,000+)"
- #1 on the list of "Top 101 counties with the lowest percentage of residents relocating from foreign countries between 2010 and 2011"
- #7 on the list of "Top 101 counties with the lowest number of infant deaths per 1000 residents 2007-2013 (pop. 50,000+)"
- #7 on the list of "Top 101 counties with the largest decrease in the number of infant deaths per 1000 residents 2000-2006 to 2007-2013 (pop. 50,000+)"
- #12 on the list of "Top 101 counties with the largest number of people without health insurance coverage in 2000 (pop. 50,000+)"
- #44 on the list of "Top 101 counties with the lowest number of births per 1000 residents 2007-2013"

|
|
Total of 142 patent applications in 2008-2024.