Estimated zip code population in 2022: 17,945 Zip code population in 2010: 15,917 Zip code population in 2000: 11,339
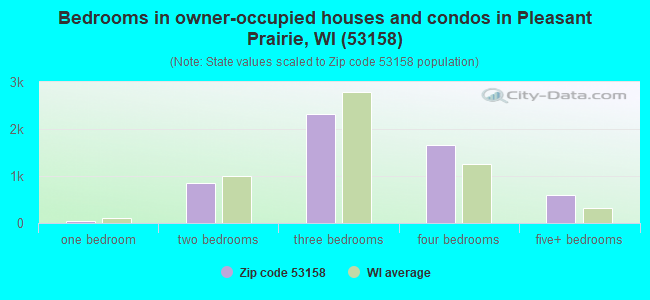
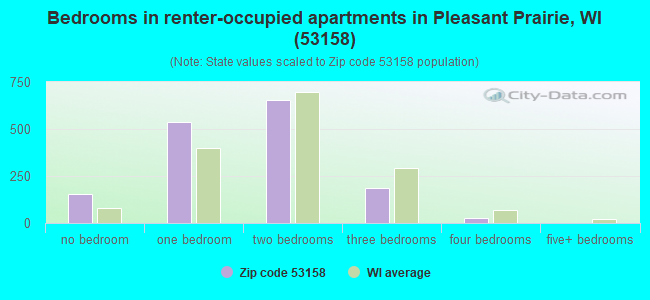
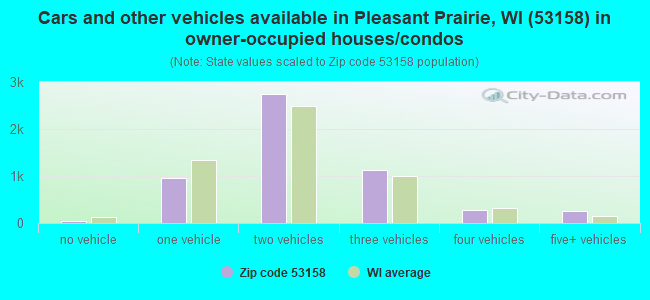
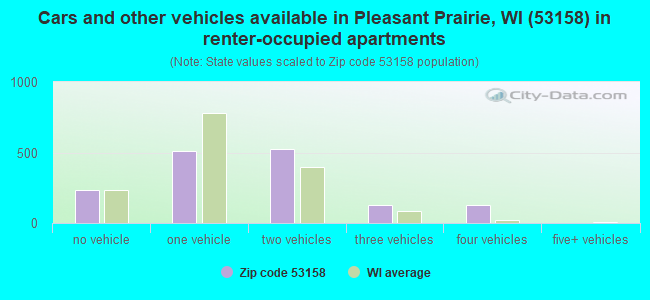
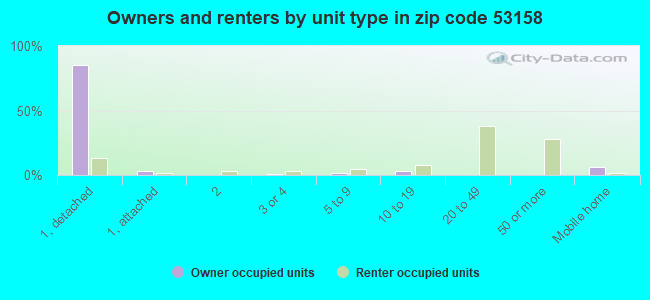
Houses and condos: 7,172 Renter-occupied apartments: 1,548
% of renters here:
22%
State:
32%
March 2022 cost of living index in zip code 53158: 105.2 (more than average, U.S. average is 100)
Land area: 30.4 sq. mi. Water area: 1.5 sq. mi.
Population density: 591 people per square mile
(low).
OSM Map
General Map
Google Map
MSN Map
OSM Map
General Map
Google Map
MSN Map
OSM Map
General Map
Google Map
MSN Map
OSM Map
General Map
Google Map
MSN Map
Please wait while loading the map...
Real estate property taxes paid for housing units in 2022:
This zip code:
1.3% ($4,628)
Wisconsin:
1.4% ($3,497)
Median real estate property taxes paid for housing units with mortgages in 2022: $4,693 (1.2%) Median real estate property taxes paid for housing units with no mortgage in 2022: $4,425 (1.4%)
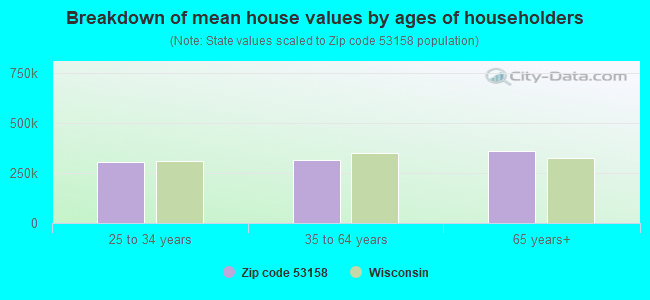
Estimated median house/condo value in 2022: $354,838
53158:
$354,838
Wisconsin:
$252,800
According to our research of Wisconsin and other state lists, there were 35 registered sex offenders living in 53158 zip code as of April 27, 2024. The ratio of all residents to sex offenders in zip code 53158 is 476 to 1. The ratio of registered sex offenders to all residents in this zip code is lower than the state average.
Median resident age:
This zip code:
42.6 years
Wisconsin median age:
40.4 years
Average household size:
This zip code:
2.6 people
Wisconsin:
2.3 people
Averages for the 2020 tax year for zip code 53158, filed in 2021:
Average Adjusted Gross Income (AGI) in 2020: $92,483 (Individual Income Tax Returns)
Here:
$92,483
State:
$72,319
Salary/wage: $82,828 (reported on 83.7% of returns)
Here:
$82,828
State:
$59,242
(% of AGI for various income ranges: 1136.0% for AGIs below $25k, 3557.6% for AGIs $25k-50k, 6486.2% for AGIs $50k-75k, 9456.1% for AGIs $75k-100k, 18481.8% for AGIs $100k-200k, 84838.2% for AGIs over 200k)
Taxable interest for individuals: $1,336 (reported on 38.5% of returns)
This zip code:
$1,336
Wisconsin:
$1,431
(% of AGI for various income ranges: 19.0% for AGIs below $25k, 22.8% for AGIs $25k-50k, 37.7% for AGIs $50k-75k, 86.0% for AGIs $75k-100k, 94.3% for AGIs $100k-200k, 765.0% for AGIs over 200k)
Ordinary dividends: $6,944 (reported on 27.7% of returns)
Here:
$6,944
State:
$6,481
(% of AGI for various income ranges: 37.2% for AGIs below $25k, 50.2% for AGIs $25k-50k, 126.1% for AGIs $50k-75k, 181.9% for AGIs $75k-100k, 351.5% for AGIs $100k-200k, 3610.4% for AGIs over 200k)
Net capital gain/loss in AGI: +$12,490 (reported on 24.0% of returns)
Here:
+$12,490
State:
+$18,329
(% of AGI for various income ranges: 15.9% for AGIs below $25k, 31.3% for AGIs $25k-50k, 77.9% for AGIs $50k-75k, 201.0% for AGIs $75k-100k, 508.8% for AGIs $100k-200k, 6841.1% for AGIs over 200k)
Profit/loss from business: +$15,051 (reported on 11.7% of returns)
Here:
+$15,051
State:
+$14,562
(% of AGI for various income ranges: 60.1% for AGIs below $25k, 105.4% for AGIs $25k-50k, 142.3% for AGIs $50k-75k, 202.3% for AGIs $75k-100k, 343.2% for AGIs $100k-200k, 2601.1% for AGIs over 200k)
Taxable individual retirement arrangement distribution: $21,789 (reported on 11.2% of returns)
53158:
$21,789
Wisconsin:
$19,348
(% of AGI for various income ranges: 61.2% for AGIs below $25k, 140.4% for AGIs $25k-50k, 243.5% for AGIs $50k-75k, 415.0% for AGIs $75k-100k, 727.6% for AGIs $100k-200k, 2218.2% for AGIs over 200k)
Self-employed (Keogh) retirement plans: $21,980 (reported on 0.5% of returns)
53158:
$21,980
Wisconsin:
$21,322
(% of AGI for various income ranges: 392.5% for AGIs over 200k)
Total itemized deductions: $35,833 (reported on 10.8% of returns)
Here:
$35,833
State:
$33,000
(% of AGI for various income ranges: 104.1% for AGIs below $25k, 132.0% for AGIs $25k-50k, 293.6% for AGIs $50k-75k, 511.9% for AGIs $75k-100k, 824.8% for AGIs $100k-200k, 5906.1% for AGIs over 200k)
Charity contributions: $13,069 (reported on 8.9% of returns)
Here:
$13,069
State:
$12,044
(% of AGI for various income ranges: 4.9% for AGIs below $25k, 13.3% for AGIs $25k-50k, 37.0% for AGIs $50k-75k, 60.0% for AGIs $75k-100k, 174.9% for AGIs $100k-200k, 2781.8% for AGIs over 200k)
Taxes paid: $8,886 (reported on 10.8% of returns)
53158:
$8,886
State:
$8,228
(% of AGI for various income ranges: 15.9% for AGIs below $25k, 29.0% for AGIs $25k-50k, 101.4% for AGIs $50k-75k, 180.0% for AGIs $75k-100k, 272.2% for AGIs $100k-200k, 1040.4% for AGIs over 200k)
Earned income credit: $1,903 (reported on 7.6% of returns)
Here:
$1,903
State:
$2,155
(% of AGI for various income ranges: 49.2% for AGIs below $25k, 38.5% for AGIs $25k-50k)
Percentage of individuals using paid preparers for their 2020 taxes: 92.9%
Here:
93%
State:
94%
(% for various income ranges: 91.4% for AGIs below $25k, 93.6% for AGIs $25k-50k, 93.3% for AGIs $50k-75k, 92.5% for AGIs $75k-100k, 93.0% for AGIs $100k-200k, 95.5% for AGIs over 200k)
Averages for the 2012 tax year for zip code 53158, filed in 2013:
Average Adjusted Gross Income (AGI) in 2012: $72,705 (Individual Income Tax Returns)
Here:
$72,705
State:
$57,939
Salary/wage: $67,081 (reported on 87.5% of returns)
Here:
$67,081
State:
$48,248
(% of AGI for various income ranges: 70.7% for AGIs below $25k, 76.4% for AGIs $25k-50k, 78.0% for AGIs $50k-75k, 80.9% for AGIs $75k-100k, 84.9% for AGIs $100k-200k, 79.4% for AGIs over 200k)
Taxable interest for individuals: $919 (reported on 41.8% of returns)
This zip code:
$919
Wisconsin:
$1,224
(% of AGI for various income ranges: 1.3% for AGIs below $25k, 0.6% for AGIs $25k-50k, 0.5% for AGIs $50k-75k, 0.5% for AGIs $75k-100k, 0.4% for AGIs $100k-200k, 0.6% for AGIs over 200k)
Ordinary dividends: $3,242 (reported on 27.2% of returns)
Here:
$3,242
State:
$5,137
(% of AGI for various income ranges: 1.8% for AGIs below $25k, 1.3% for AGIs $25k-50k, 0.8% for AGIs $50k-75k, 0.8% for AGIs $75k-100k, 1.1% for AGIs $100k-200k, 1.6% for AGIs over 200k)
Net capital gain/loss in AGI: +$4,254 (reported on 20.1% of returns)
Here:
+$4,254
State:
+$11,137
(% of AGI for various income ranges: 0.2% for AGIs $50k-75k, 0.5% for AGIs $75k-100k, 0.5% for AGIs $100k-200k, 3.6% for AGIs over 200k)
Profit/loss from business: +$12,704 (reported on 11.5% of returns)
Here:
+$12,704
State:
+$11,943
(% of AGI for various income ranges: 4.8% for AGIs below $25k, 2.6% for AGIs $25k-50k, 1.8% for AGIs $50k-75k, 1.5% for AGIs $75k-100k, 1.7% for AGIs $100k-200k, 2.0% for AGIs over 200k)
Taxable individual retirement arrangement distribution: $15,058 (reported on 11.0% of returns)
53158:
$15,058
Wisconsin:
$14,087
(% of AGI for various income ranges: 4.2% for AGIs below $25k, 3.0% for AGIs $25k-50k, 3.2% for AGIs $50k-75k, 2.4% for AGIs $75k-100k, 2.3% for AGIs $100k-200k, 1.2% for AGIs over 200k)
Self-employment retirement plans: $17,940 (reported on 0.6% of returns)
53158:
$17,940
Wisconsin:
$17,048
Total itemized deductions: $24,329 (20% of AGI, reported on 48.2% of returns)
Here:
$24,329
State:
$22,257
Here:
20.1% of AGI
State:
20.1% of AGI
(% of AGI for various income ranges: 12.4% for AGIs below $25k, 12.6% for AGIs $25k-50k, 16.2% for AGIs $50k-75k, 17.8% for AGIs $75k-100k, 18.2% for AGIs $100k-200k, 14.4% for AGIs over 200k)
Charity contributions: $3,134 (reported on 41.3% of returns)
Here:
$3,134
State:
$3,370
(% of AGI for various income ranges: 0.7% for AGIs below $25k, 1.0% for AGIs $25k-50k, 1.4% for AGIs $50k-75k, 1.9% for AGIs $75k-100k, 1.9% for AGIs $100k-200k, 2.2% for AGIs over 200k)
Taxes paid: $12,046 (reported on 48.1% of returns)
53158:
$12,046
State:
$10,731
(% of AGI for various income ranges: 3.5% for AGIs below $25k, 4.5% for AGIs $25k-50k, 6.9% for AGIs $50k-75k, 8.1% for AGIs $75k-100k, 9.3% for AGIs $100k-200k, 8.6% for AGIs over 200k)
Earned income credit: $1,912 (reported on 8.7% of returns)
Here:
$1,912
State:
$2,094
(% of AGI for various income ranges: 3.5% for AGIs below $25k, 0.7% for AGIs $25k-50k)
Percentage of individuals using paid preparers for their 2012 taxes: 53.5%
Here:
53%
State:
54%
(% for various income ranges: 44.8% for AGIs below $25k, 52.4% for AGIs $25k-50k, 58.2% for AGIs $50k-75k, 58.4% for AGIs $75k-100k, 59.1% for AGIs $100k-200k, 66.7% for AGIs over 200k)
Averages for the 2004 tax year for zip code 53158, filed in 2005:
Average Adjusted Gross Income (AGI) in 2004: $59,247 (Individual Income Tax Returns)
Here:
$59,247
State:
$47,735
Salary/wage: $54,823 (reported on 89.1% of returns)
Here:
$54,823
State:
$41,540
(% of AGI for various income ranges: 141.7% for AGIs below $10k, 70.9% for AGIs $10k-25k, 82.8% for AGIs $25k-50k, 84.7% for AGIs $50k-75k, 88.5% for AGIs $75k-100k, 79.1% for AGIs over 100k)
Taxable interest for individuals: $1,033 (reported on 56.3% of returns)
This zip code:
$1,033
Wisconsin:
$1,420
(% of AGI for various income ranges: 6.9% for AGIs below $10k, 2.6% for AGIs $10k-25k, 1.0% for AGIs $25k-50k, 0.7% for AGIs $50k-75k, 0.6% for AGIs $75k-100k, 0.9% for AGIs over 100k)
Taxable dividends: $1,607 (reported on 30.6% of returns)
Here:
$1,607
State:
$2,869
(% of AGI for various income ranges: 4.7% for AGIs below $10k, 1.7% for AGIs $10k-25k, 0.7% for AGIs $25k-50k, 0.7% for AGIs $50k-75k, 0.5% for AGIs $75k-100k, 0.9% for AGIs over 100k)
Net capital gain/loss: +$7,838 (reported on 23.1% of returns)
Here:
+$7,838
State:
+$9,569
(% of AGI for various income ranges: -1.2% for AGIs below $10k, 0.7% for AGIs $10k-25k, 0.4% for AGIs $25k-50k, 0.6% for AGIs $50k-75k, 0.8% for AGIs $75k-100k, 5.9% for AGIs over 100k)
Profit/loss from business: +$11,368 (reported on 11.9% of returns)
Here:
+$11,368
State:
+$10,417
(% of AGI for various income ranges: 2.5% for AGIs below $10k, 2.5% for AGIs $10k-25k, 1.6% for AGIs $25k-50k, 1.8% for AGIs $50k-75k, 1.5% for AGIs $75k-100k, 2.9% for AGIs over 100k)
IRA payment deduction: $3,058 (reported on 2.5% of returns)
53158:
$3,058
Wisconsin:
$2,900
(% of AGI for various income ranges: 0.7% for AGIs below $10k, 0.2% for AGIs $10k-25k, 0.3% for AGIs $25k-50k, 0.2% for AGIs $50k-75k, 0.1% for AGIs $75k-100k, 0.1% for AGIs over 100k)
Self-employed pension: $14,167 (reported on 0.6% of returns)
Here:
$14,167
Wisconsin:
$11,934
Total itemized deductions: $20,223 (22% of AGI, reported on 51.9% of returns)
Here:
$20,223
State:
$18,160
Here:
21.7% of AGI
State:
21.1% of AGI
(% of AGI for various income ranges: 20.9% for AGIs below $10k, 11.3% for AGIs $10k-25k, 16.0% for AGIs $25k-50k, 20.1% for AGIs $50k-75k, 20.4% for AGIs $75k-100k, 16.7% for AGIs over 100k)
Charity contributions deductions: $2,544 (3% of AGI, reported on 46.5% of returns)
Here:
$2,544
State:
$2,711
Here:
2.6% of AGI
State:
3.0% of AGI
(% of AGI for various income ranges: 1.0% for AGIs below $10k, 1.0% for AGIs $10k-25k, 1.4% for AGIs $25k-50k, 2.0% for AGIs $50k-75k, 1.9% for AGIs $75k-100k, 2.3% for AGIs over 100k)
Total tax: $8,638 (reported on 80.5% of returns)
53158:
$8,638
State:
$7,114
(% of AGI for various income ranges: 3.7% for AGIs below $10k, 4.3% for AGIs $10k-25k, 7.1% for AGIs $25k-50k, 8.3% for AGIs $50k-75k, 9.1% for AGIs $75k-100k, 16.2% for AGIs over 100k)
Earned income credit: $1,425 (reported on 6.5% of returns)
Here:
$1,425
State:
$1,544
Percentage of individuals using paid preparers for their 2004 taxes: 56.6%
Here:
57%
State:
57%
(% for various income ranges: 45.5% for AGIs below $10k, 56.1% for AGIs $10k-25k, 56.8% for AGIs $25k-50k, 62.4% for AGIs $50k-75k, 59.1% for AGIs $75k-100k, 61.5% for AGIs over 100k)
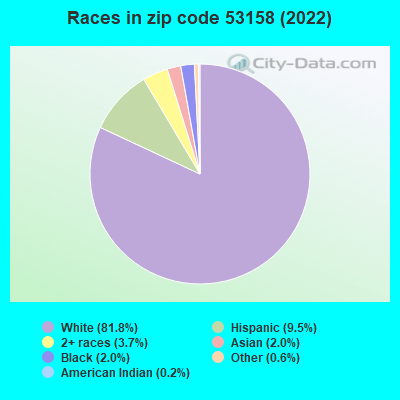
Likely homosexual households (counted as self-reported same-sex unmarried-partner households)
Lesbian couples: 0.3% of all households
Gay men: 0.0% of all households
Household received Food Stamps/SNAP in the past 12 months: 424 Household did not receive Food Stamps/SNAP in the past 12 months: 6,502
Women who had a birth in the past 12 months: 335 (227 now married, 107 unmarried) Women who did not have a birth in the past 12 months: 3,575 (1,299 now married, 2,276 unmarried)
Housing units in zip code 53158 with a mortgage: 3,699 (371 second mortgage, 5 home equity loan, 354 both second mortgage and home equity loan) Houses without a mortgage: 181
Median monthly owner costs for units with a mortgage: $1,831 Median monthly owner costs for units without a mortgage: $766
Residents with income below the poverty level in 2022:
This zip code:
5.2%
Whole state:
10.7%
Residents with income below 50% of the poverty level in 2022:
This zip code:
2.5%
Whole state:
5.7%
Median number of rooms in houses and condos:
Here:
7.0
State:
6.5
Median number of rooms in apartments:
Here:
3.3
State:
4.1
Notable locations in this zip code not listed on our city pages
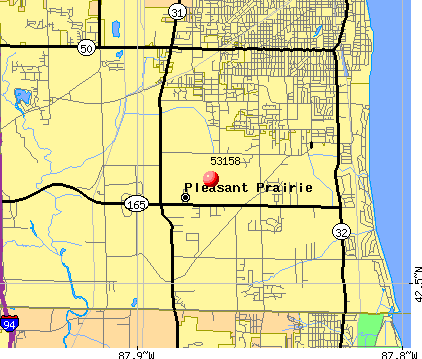
Notable locations in zip code 53158: Stiles Farms (A), Keno Family Drive-In (B), Pleasant Prairie Fire and Rescue Station 1 (C), Pleasant Prairie Fire and Rescue Station 2 (D), Pleasant Prairie Power Plant (E). Display/hide their locations on the map
2,457 married couples with children.
744 single-parent households (185 men, 559 women).
89.8% of residents of 53158 zip code speak English at home.
3.6% of residents speak Spanish at home (54% very well, 23% well, 23% not well).
3.7% of residents speak other Indo-European language at home (93% very well, 4% well, 3% not well).
1.7% of residents speak Asian or Pacific Island language at home (59% very well, 32% well, 9% not well).
1.1% of residents speak other language at home (95% very well, 5% well).
Foreign born population: 1,044 (5.8%) (74.2% of them are naturalized citizens)
This zip code:
5.8%
Whole state:
5.0%
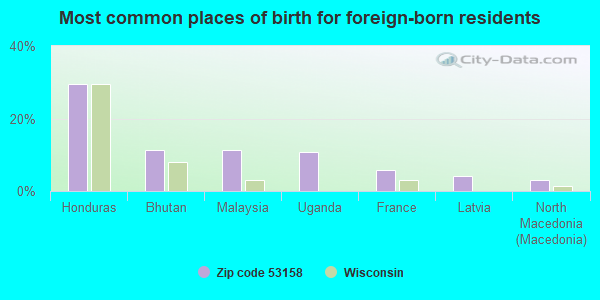
30%Honduras
11%Bhutan
11%Malaysia
11%Uganda
6%France
4%Latvia
3%North Macedonia (Macedonia)
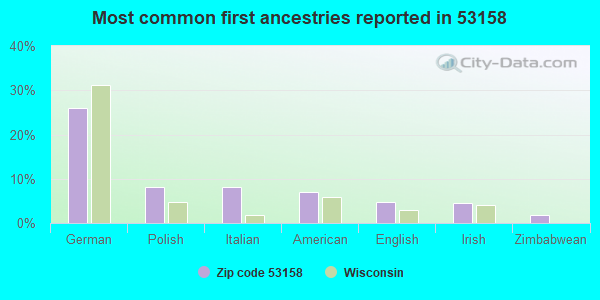
26%German
8%Polish
8%Italian
7%American
5%English
4%Irish
2%Zimbabwean
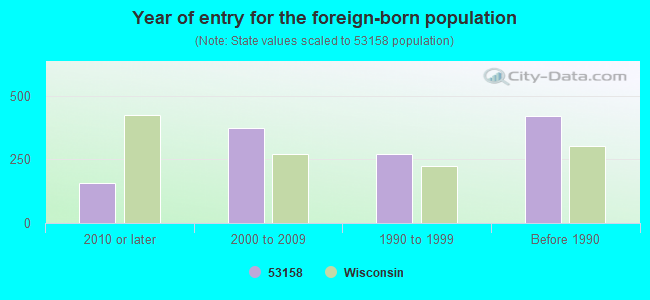
Year of entry for the foreign-born population
1582010 or later
3732000 to 2009
2721990 to 1999
420Before 1990
Facilities with environmental interests located in this zip code:
CHICAGO LOCK (10100 88TH AVE in PLEASANT PRAIRIE, WI)
(Resource Conservation and Recovery Act (tracking hazardous waste)) STATE MASTER (Wisconsin database) - RCRAINFO-WIR000011486, SQG
AMERICAN STEEL WORKS LTD (7900 102ND ST in PLEASANT PRAIRIE, WI)
Small Quantity Generators, between 100 kg and 1000 kg of hazardous waste/month (Resource Conservation and Recovery Act (tracking hazardous waste)) - notification STATE MASTER (Wisconsin database) - RCRAINFO-WI0000940593, SQG
CALUMET DIVERSIFIED MEATS (10000 - 30TH AVENUE in PLEASANT PRAIRIE, WI)
ENFORCEMENT/COMPLIANCE ACTIVITY (Integrated Compliance Information System)
CHERRY ELECTRICAL PRODUCTS (11300 88TH AVENUE in PLEASANT PRAIRIE, WI)
ENFORCEMENT/COMPLIANCE ACTIVITY (Integrated Compliance Information System)
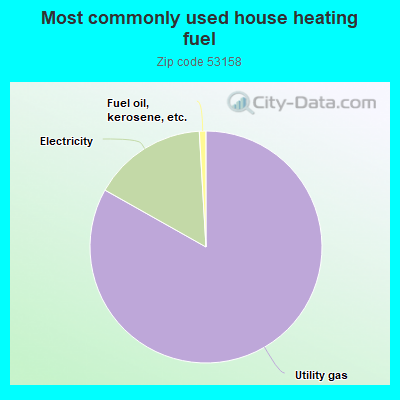
Housing units lacking complete kitchen facilities: 0.9%
82.5%Utility gas
15.8%Electricity
0.9%Fuel oil, kerosene, etc.
Place of birth for U.S.-born residents:
This state: 8,760
Northeast: 275
Midwest: 6,411
South: 684
West: 627
60% of the 53158 zip code residents lived in the same house 5 years ago. Out of people who lived in different houses, 51% lived in this county. Out of people who lived in different counties, 50% lived in Wisconsin.
89% of the 53158 zip code residents lived in the same house 1 year ago. Out of people who lived in different houses, 54% moved from this county. Out of people who lived in different houses, 9% moved from different county within same state. Out of people who lived in different houses, 36% moved from different state. Out of people who lived in different houses, 1% moved from abroad.
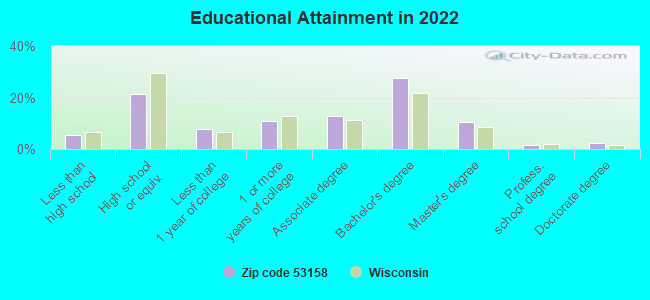
Private vs. public school enrollment:
Students in private schools in grades 1 to 8 (elementary and middle school): 306
Here:
18.9%
Wisconsin:
16.7%
Students in private schools in grades 9 to 12 (high school): 135
Here:
16.8%
Wisconsin:
12.5%
Students in private undergraduate colleges: 175
Here:
26.9%
Wisconsin:
17.5%
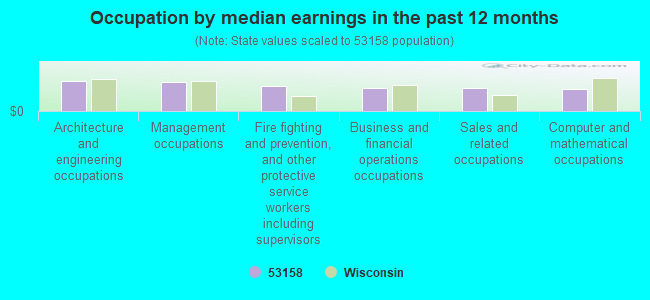
Occupation by median earnings in the past 12 months ($)
106,170Architecture and engineering occupations
102,049Management occupations
87,915Fire fighting and prevention, and other protective service workers including supervisors
82,333Business and financial operations occupations
79,258Sales and related occupations
76,799Computer and mathematical occupations
Companies with federal contracts located in this zip code:
OCENCO INC (10225 82ND AVENUE in PLEASANT PRAIR, WI; small business) : $43,642,697 in 316 contractsfrom 1999 to 2006
Contracts for Safety and Rescue Equipment, Marine Lifesaving and Diving Equipment, Chemical Analysis Instruments, Gases: Compressed and Liquefied, and moreby Navy, Army, Defense Logistics Agency, Centers for Disease Control and Prevention, and others Signed by year:2000: $7,796,574; 2001: $6,191,559; 2002: $7,257,210; 2003: $11,225,823; 2004: $2,367,248; 2005: $6,163,908; 2006: $1,374,636.
Biggest contracts:
$5,256,000 with Navy for Safety and Rescue Equipment. Signed on 2000-07-17. Completion date: 2000-08-16.
$4,151,442 with Navy for Marine Lifesaving and Diving Equipment. Signed on 2002-09-24. Completion date: 2002-11-24.
$3,982,972 with Navy for Safety and Rescue Equipment. Signed on 2001-11-19. Completion date: 2001-12-31.
$2,835,550, same as above.Signed on 2003-06-05. Completion date: 2003-09-03.
MG SCIENTIFIC, INC (8500 107TH ST in PLEASANT PRAIR, WI; small business) : $1,746,277 in 246 contractsfrom 1999 to 2006
Contracts for Chemical Analysis Instruments, Medical and Surgical Instruments, Equipment, and Supplies, Laboratory Equipment and Supplies, Chemicals, and moreby National Institutes of Health, Animal and Plant Health Inspection Service, Agricultural Research Service, Centers for Disease Control and Prevention, and others Signed by year:2000: $69,000; 2001: $36,000; 2002: $99,377; 2003: $196,681; 2004: $457,607; 2005: $425,982; 2006: $326,630.
Biggest contracts:
$193,425 with National Institutes of Health for Chemical Analysis Instruments. Signed on 2004-02-20. Completion date: 2004-09-30.
$98,000 with National Institutes of Health for Medical and Surgical Instruments, Equipment, and Supplies. Taking place in MD. Signed on 1999-12-15. Completion date: 1999-12-15.
$63,002 with Animal and Plant Health Inspection Service for Chemical Analysis Instruments. Taking place in IA. Signed on 2003-08-15. Completion date: 2003-10-15.
$48,180 with Agricultural Research Service for Laboratory Equipment and Supplies. Taking place in MS. Signed on 2003-09-15. Completion date: 2003-10-15.
M S K PARTNERSHIP (10505 CORP DR STE 200 in PLEASANT PRAIRIE, WI; small business) 80 employees, $43577302 revenue. : $203,231 in 45 contractsfrom 2002 to 2006
Contracts for Lease or Rental of Facilities -- Office Buildings by Public Buildings Service Signed by year:2000: $0; 2001: $0; 2002: $21,282; 2003: $88,945; 2004: $10,707; 2005: $46,457; 2006: $35,840.
Biggest contracts:
$10,686 with Public Buildings Service for Lease or Rental of Facilities -- Office Buildings. Signed on 2003-09-15. Completion date: 2003-09-15.
$10,686, same as above.Signed on 2003-06-15. Completion date: 2003-06-15.
$10,641, same as above.Signed on 2002-12-15. Completion date: 2002-12-15.
$10,641, same as above.Signed on 2002-12-15. Completion date: 2002-12-15.
Top industries in this zip code by the number of employees in 2005:
Health Care and Social Assistance: General Medical and Surgical Hospitals (250-499 employees: 1 establishment)
Wholesale Trade: General Line Grocery Merchant Wholesalers (250-499: 1)
Construction: Commercial and Institutional Building Construction (100-249: 1, 10-19: 2, 1-4: 1)
People in group quarters in 2010:
105 people in nursing facilities/skilled-nursing facilities
18 people in other noninstitutional facilities
6 people in residential treatment centers for adults
5 people in group homes intended for adults
4 people in in-patient hospice facilities
3 people in workers' group living quarters and job corps centers
2 people in group homes for juveniles (non-correctional)
People in group quarters in 2000:
19 people in other group homes
13 people in homes or halfway houses for drug/alcohol abuse
10 people in homes for the physically handicapped
Fatal accident statistics in 2013:
Fatal accident count: 1
Vehicles involved in fatal accidents: 2
Fatal accidents caused by drunken drivers: 0
Fatalities: 1
Persons involved in fatal accidents: 6
Pedestrians involved in fatal accidents: 0
Fatal accident statistics in 2012:
Fatal accident count: 4
Vehicles involved in fatal accidents: 6
Fatal accidents caused by drunken drivers: 0
Fatalities: 4
Persons involved in fatal accidents: 11
Pedestrians involved in fatal accidents: 0
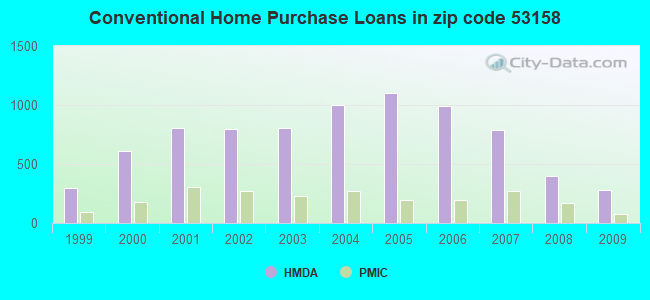
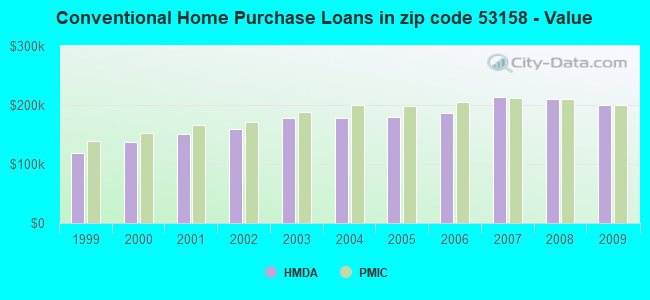
Home Mortgage Disclosure Act Aggregated Statistics For Year 2009 (Based on 2 full and 4 partial tracts)
A) FHA, FSA/RHS & VA Home Purchase Loans
B) Conventional Home Purchase Loans
C) Refinancings
D) Home Improvement Loans
E) Loans on Dwellings For 5+ Families
F) Non-occupant Loans on < 5 Family Dwellings (A B C & D)
G) Loans On Manufactured Home Dwelling (A B C & D)
Number
Average Value
Number
Average Value
Number
Average Value
Number
Average Value
Number
Average Value
Number
Average Value
Number
Average Value
LOANS ORIGINATED
170
$205,123
278
$200,021
1,876
$195,702
58
$80,218
3
$2,200,187
56
$200,010
9
$62,217
APPLICATIONS APPROVED, NOT ACCEPTED
8
$197,141
37
$196,551
133
$200,819
3
$114,713
3
$2,200,187
7
$361,704
9
$56,708
APPLICATIONS DENIED
24
$178,638
42
$152,634
409
$237,105
20
$34,202
0
$0
18
$251,175
12
$33,861
APPLICATIONS WITHDRAWN
17
$153,217
23
$234,971
268
$214,600
11
$147,780
1
$495,790
6
$130,260
0
$0
FILES CLOSED FOR INCOMPLETENESS
6
$198,315
5
$133,138
99
$215,832
4
$47,392
0
$0
3
$102,073
0
$0
Aggregated Statistics For Year 2008 (Based on 2 full and 4 partial tracts)
A) FHA, FSA/RHS & VA Home Purchase Loans
B) Conventional Home Purchase Loans
C) Refinancings
D) Home Improvement Loans
E) Loans on Dwellings For 5+ Families
F) Non-occupant Loans on < 5 Family Dwellings (A B C & D)
G) Loans On Manufactured Home Dwelling (A B C & D)
Number
Average Value
Number
Average Value
Number
Average Value
Number
Average Value
Number
Average Value
Number
Average Value
Number
Average Value
LOANS ORIGINATED
144
$210,658
401
$209,810
916
$206,163
57
$69,590
3
$1,808,167
63
$192,036
13
$30,398
APPLICATIONS APPROVED, NOT ACCEPTED
19
$234,115
39
$219,051
109
$247,000
12
$51,974
0
$0
5
$381,892
4
$231,705
APPLICATIONS DENIED
21
$222,736
59
$189,564
360
$228,943
50
$75,441
0
$0
16
$181,082
20
$39,830
APPLICATIONS WITHDRAWN
12
$213,216
46
$240,409
178
$227,780
7
$131,179
0
$0
9
$162,343
0
$0
FILES CLOSED FOR INCOMPLETENESS
1
$268,310
4
$284,968
61
$203,788
13
$70,738
0
$0
4
$158,432
0
$0
Aggregated Statistics For Year 2007 (Based on 2 full and 4 partial tracts)
A) FHA, FSA/RHS & VA Home Purchase Loans
B) Conventional Home Purchase Loans
C) Refinancings
D) Home Improvement Loans
E) Loans on Dwellings For 5+ Families
F) Non-occupant Loans on < 5 Family Dwellings (A B C & D)
G) Loans On Manufactured Home Dwelling (A B C & D)
Number
Average Value
Number
Average Value
Number
Average Value
Number
Average Value
Number
Average Value
Number
Average Value
Number
Average Value
LOANS ORIGINATED
65
$226,888
788
$214,213
882
$196,362
103
$71,197
4
$622,050
69
$210,406
13
$39,551
APPLICATIONS APPROVED, NOT ACCEPTED
7
$225,396
96
$193,122
149
$195,013
24
$56,528
0
$0
8
$206,295
9
$45,538
APPLICATIONS DENIED
8
$183,645
103
$195,111
429
$193,900
68
$72,050
0
$0
25
$189,731
19
$45,116
APPLICATIONS WITHDRAWN
13
$233,215
88
$217,897
208
$209,556
17
$75,927
0
$0
12
$201,371
0
$0
FILES CLOSED FOR INCOMPLETENESS
0
$0
16
$254,756
85
$204,452
1
$51,040
0
$0
8
$291,666
0
$0
Aggregated Statistics For Year 2006 (Based on 2 full and 4 partial tracts)
A) FHA, FSA/RHS & VA Home Purchase Loans
B) Conventional Home Purchase Loans
C) Refinancings
D) Home Improvement Loans
E) Loans on Dwellings For 5+ Families
F) Non-occupant Loans on < 5 Family Dwellings (A B C & D)
G) Loans On Manufactured Home Dwelling (A B C & D)
Number
Average Value
Number
Average Value
Number
Average Value
Number
Average Value
Number
Average Value
Number
Average Value
Number
Average Value
LOANS ORIGINATED
58
$223,114
992
$187,068
969
$181,001
117
$70,593
1
$153,110
76
$157,924
17
$44,702
APPLICATIONS APPROVED, NOT ACCEPTED
1
$198,980
108
$189,471
144
$163,314
16
$36,952
0
$0
12
$270,726
4
$68,900
APPLICATIONS DENIED
8
$197,212
136
$167,014
483
$183,337
91
$63,509
0
$0
22
$152,266
29
$46,264
APPLICATIONS WITHDRAWN
2
$235,125
130
$186,217
318
$182,753
18
$111,345
0
$0
8
$302,306
5
$33,330
FILES CLOSED FOR INCOMPLETENESS
0
$0
24
$158,548
134
$215,643
4
$126,135
0
$0
4
$254,092
0
$0
Aggregated Statistics For Year 2005 (Based on 2 full and 4 partial tracts)
A) FHA, FSA/RHS & VA Home Purchase Loans
B) Conventional Home Purchase Loans
C) Refinancings
D) Home Improvement Loans
E) Loans on Dwellings For 5+ Families
F) Non-occupant Loans on < 5 Family Dwellings (A B C & D)
G) Loans On Manufactured Home Dwelling (A B C & D)
Number
Average Value
Number
Average Value
Number
Average Value
Number
Average Value
Number
Average Value
Number
Average Value
Number
Average Value
LOANS ORIGINATED
60
$211,514
1,099
$179,763
1,302
$176,650
125
$78,986
1
$1,303,630
130
$203,645
28
$43,283
APPLICATIONS APPROVED, NOT ACCEPTED
6
$206,178
75
$159,932
151
$176,403
26
$92,167
0
$0
11
$127,728
1
$93,320
APPLICATIONS DENIED
4
$195,400
171
$134,132
528
$179,489
74
$50,117
2
$702,500
20
$141,266
53
$32,874
APPLICATIONS WITHDRAWN
7
$188,941
133
$181,994
377
$182,996
27
$287,521
0
$0
17
$170,528
5
$35,128
FILES CLOSED FOR INCOMPLETENESS
0
$0
39
$115,812
202
$195,286
3
$56,150
0
$0
5
$238,820
0
$0
Aggregated Statistics For Year 2004 (Based on 2 full and 4 partial tracts)
A) FHA, FSA/RHS & VA Home Purchase Loans
B) Conventional Home Purchase Loans
C) Refinancings
D) Home Improvement Loans
E) Loans on Dwellings For 5+ Families
F) Non-occupant Loans on < 5 Family Dwellings (A B C & D)
G) Loans On Manufactured Home Dwelling (A B C & D)
Number
Average Value
Number
Average Value
Number
Average Value
Number
Average Value
Number
Average Value
Number
Average Value
Number
Average Value
LOANS ORIGINATED
77
$187,752
997
$178,325
1,413
$168,833
104
$59,062
0
$0
87
$164,661
26
$44,396
APPLICATIONS APPROVED, NOT ACCEPTED
0
$0
79
$163,057
133
$164,805
19
$40,583
0
$0
7
$151,440
7
$22,877
APPLICATIONS DENIED
11
$190,699
132
$120,677
444
$168,845
74
$55,059
2
$2,183,320
21
$154,077
46
$39,736
APPLICATIONS WITHDRAWN
5
$139,214
78
$188,444
295
$152,910
19
$93,458
0
$0
12
$223,722
4
$43,668
FILES CLOSED FOR INCOMPLETENESS
3
$109,850
22
$137,192
190
$175,681
5
$35,814
0
$0
5
$99,218
0
$0
Aggregated Statistics For Year 2003 (Based on 2 full and 4 partial tracts)
A) FHA, FSA/RHS & VA Home Purchase Loans
B) Conventional Home Purchase Loans
C) Refinancings
D) Home Improvement Loans
E) Loans on Dwellings For 5+ Families
F) Non-occupant Loans on < 5 Family Dwellings (A B C & D)
Number
Average Value
Number
Average Value
Number
Average Value
Number
Average Value
Number
Average Value
Number
Average Value
LOANS ORIGINATED
55
$155,875
805
$177,324
3,022
$151,446
63
$30,028
3
$482,823
82
$190,203
APPLICATIONS APPROVED, NOT ACCEPTED
1
$357,260
50
$146,414
221
$139,423
18
$19,812
0
$0
7
$119,093
APPLICATIONS DENIED
6
$130,937
78
$109,550
565
$137,337
38
$35,239
0
$0
3
$90,410
APPLICATIONS WITHDRAWN
3
$100,870
73
$180,296
266
$137,574
9
$67,334
0
$0
7
$196,156
FILES CLOSED FOR INCOMPLETENESS
4
$160,915
19
$145,058
80
$147,680
5
$24,720
0
$0
0
$0
Aggregated Statistics For Year 2002 (Based on 2 full and 4 partial tracts)
A) FHA, FSA/RHS & VA Home Purchase Loans
B) Conventional Home Purchase Loans
C) Refinancings
D) Home Improvement Loans
E) Loans on Dwellings For 5+ Families
F) Non-occupant Loans on < 5 Family Dwellings (A B C & D)
Number
Average Value
Number
Average Value
Number
Average Value
Number
Average Value
Number
Average Value
Number
Average Value
LOANS ORIGINATED
84
$159,140
796
$159,349
2,283
$143,837
75
$24,948
3
$6,294,067
77
$310,333
APPLICATIONS APPROVED, NOT ACCEPTED
0
$0
52
$137,250
224
$122,125
8
$27,088
0
$0
4
$71,528
APPLICATIONS DENIED
5
$146,864
98
$93,455
365
$122,018
45
$18,367
1
$15,311,100
12
$175,137
APPLICATIONS WITHDRAWN
3
$104,503
56
$127,604
186
$132,437
12
$49,074
0
$0
4
$66,588
FILES CLOSED FOR INCOMPLETENESS
3
$127,350
6
$174,165
87
$163,339
0
$0
0
$0
0
$0
Aggregated Statistics For Year 2001 (Based on 2 full and 4 partial tracts)
A) FHA, FSA/RHS & VA Home Purchase Loans
B) Conventional Home Purchase Loans
C) Refinancings
D) Home Improvement Loans
E) Loans on Dwellings For 5+ Families
F) Non-occupant Loans on < 5 Family Dwellings (A B C & D)
Number
Average Value
Number
Average Value
Number
Average Value
Number
Average Value
Number
Average Value
Number
Average Value
LOANS ORIGINATED
118
$147,904
808
$150,840
1,572
$126,813
60
$19,805
7
$1,806,096
43
$122,355
APPLICATIONS APPROVED, NOT ACCEPTED
1
$195,400
29
$137,862
144
$96,208
16
$35,898
1
$250,810
3
$61,040
APPLICATIONS DENIED
7
$84,677
117
$83,552
317
$97,142
49
$16,776
0
$0
3
$145,253
APPLICATIONS WITHDRAWN
13
$157,418
58
$127,383
237
$115,802
24
$19,901
0
$0
13
$130,185
FILES CLOSED FOR INCOMPLETENESS
0
$0
8
$187,984
54
$135,566
1
$10,530
0
$0
0
$0
Aggregated Statistics For Year 2000 (Based on 2 full and 4 partial tracts)
A) FHA, FSA/RHS & VA Home Purchase Loans
B) Conventional Home Purchase Loans
C) Refinancings
D) Home Improvement Loans
E) Loans on Dwellings For 5+ Families
F) Non-occupant Loans on < 5 Family Dwellings (A B C & D)
Number
Average Value
Number
Average Value
Number
Average Value
Number
Average Value
Number
Average Value
Number
Average Value
LOANS ORIGINATED
103
$141,437
612
$136,732
323
$92,003
125
$18,534
7
$310,597
36
$145,240
APPLICATIONS APPROVED, NOT ACCEPTED
6
$125,565
59
$89,827
69
$91,818
21
$29,095
1
$19,102,420
5
$45,472
APPLICATIONS DENIED
5
$135,098
107
$73,229
173
$92,135
53
$21,277
0
$0
8
$76,068
APPLICATIONS WITHDRAWN
1
$208,520
38
$121,507
107
$81,786
6
$21,383
0
$0
5
$113,480
FILES CLOSED FOR INCOMPLETENESS
3
$133,473
11
$122,965
24
$109,815
3
$13,610
0
$0
1
$100,020
Aggregated Statistics For Year 1999 (Based on 3 partial tracts)
A) FHA, FSA/RHS & VA Home Purchase Loans
B) Conventional Home Purchase Loans
C) Refinancings
D) Home Improvement Loans
E) Loans on Dwellings For 5+ Families
F) Non-occupant Loans on < 5 Family Dwellings (A B C & D)
2002 - 2018 National Fire Incident Reporting System (NFIRS) incidents
According to the data from the years 2002 - 2018 the average number of fires per year is 44. The highest number of reported fires - 79 took place in 2003, and the least - 24 in 2009. The data has a declining trend.
When looking into fire subcategories, the most incidents belonged to: Structure Fires (41.0%), and Outside Fires (34.3%).
Fire incident types reported to NFIRS in Zip Code 53158

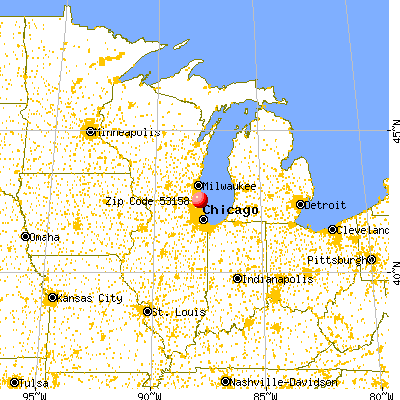


 Nearest zip codes: 53143, 60099, 60096, 53142, 53144, 60083.


 According to the data from the years 2002 - 2018 the average number of fires per year is 44. The highest number of reported fires - 79 took place in 2003, and the least - 24 in 2009. The data has a declining trend.
 When looking into fire subcategories, the most incidents belonged to: Structure Fires (41.0%), and Outside Fires (34.3%).