Estimated zip code population in 2022: 20,536 Zip code population in 2010: 19,200 Zip code population in 2000: 18,257
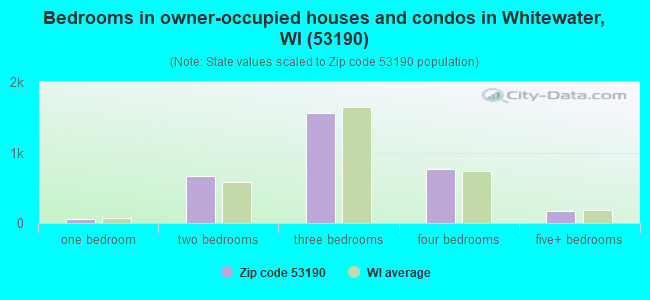
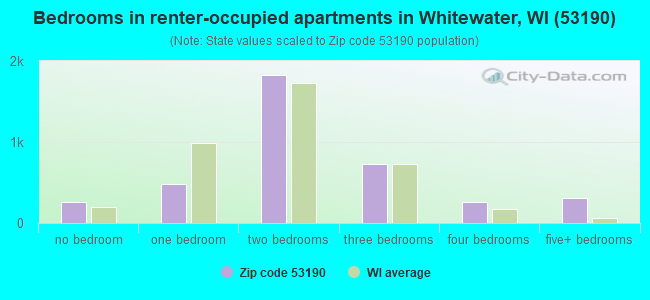
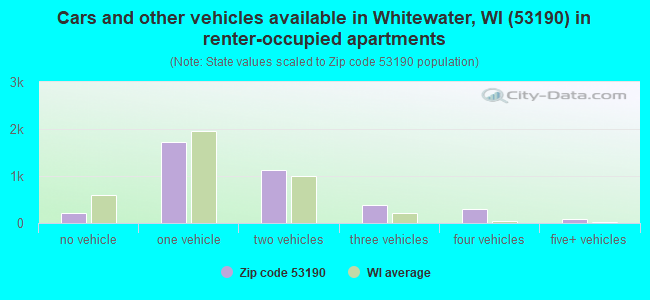
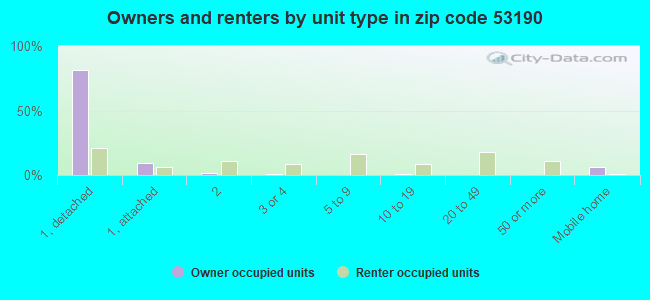
Houses and condos: 8,208 Renter-occupied apartments: 3,888
% of renters here:
55%
State:
32%
March 2022 cost of living index in zip code 53190: 81.1 (low, U.S. average is 100)
Land area: 134.3 sq. mi. Water area: 2.0 sq. mi.
Population density: 153 people per square mile
(very low).
OSM Map
General Map
Google Map
MSN Map
OSM Map
General Map
Google Map
MSN Map
OSM Map
General Map
Google Map
MSN Map
OSM Map
General Map
Google Map
MSN Map
Please wait while loading the map...
Real estate property taxes paid for housing units in 2022:
This zip code:
1.4% ($3,576)
Wisconsin:
1.4% ($3,497)
Median real estate property taxes paid for housing units with mortgages in 2022: $3,568 (1.3%) Median real estate property taxes paid for housing units with no mortgage in 2022: $3,597 (1.6%)
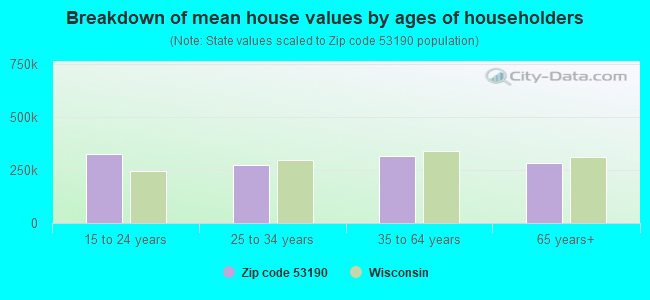
Estimated median house/condo value in 2022: $255,750
53190:
$255,750
Wisconsin:
$252,800
According to our research of Wisconsin and other state lists, there were 64 registered sex offenders living in 53190 zip code as of April 27, 2024. The ratio of all residents to sex offenders in zip code 53190 is 311 to 1. The ratio of registered sex offenders to all residents in this zip code is near the state average.
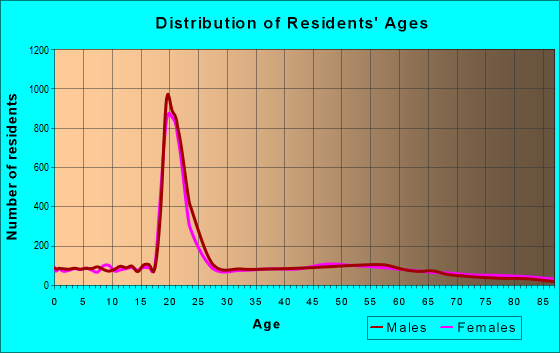
Median resident age:
This zip code:
23.1 years
Wisconsin median age:
40.4 years
Average household size:
This zip code:
2.3 people
Wisconsin:
2.3 people
Averages for the 2020 tax year for zip code 53190, filed in 2021:
Average Adjusted Gross Income (AGI) in 2020: $61,266 (Individual Income Tax Returns)
Here:
$61,266
State:
$72,319
Salary/wage: $47,594 (reported on 82.6% of returns)
Here:
$47,594
State:
$59,242
(% of AGI for various income ranges: 1241.1% for AGIs below $25k, 3777.8% for AGIs $25k-50k, 6507.8% for AGIs $50k-75k, 9530.9% for AGIs $75k-100k, 17994.1% for AGIs $100k-200k, 71632.0% for AGIs over 200k)
Taxable interest for individuals: $1,286 (reported on 36.7% of returns)
This zip code:
$1,286
Wisconsin:
$1,431
(% of AGI for various income ranges: 18.4% for AGIs below $25k, 19.5% for AGIs $25k-50k, 57.2% for AGIs $50k-75k, 72.1% for AGIs $75k-100k, 220.0% for AGIs $100k-200k, 2054.0% for AGIs over 200k)
Ordinary dividends: $6,173 (reported on 21.1% of returns)
Here:
$6,173
State:
$6,481
(% of AGI for various income ranges: 22.3% for AGIs below $25k, 37.6% for AGIs $25k-50k, 138.4% for AGIs $50k-75k, 190.9% for AGIs $75k-100k, 570.2% for AGIs $100k-200k, 7698.0% for AGIs over 200k)
Net capital gain/loss in AGI: +$14,728 (reported on 19.5% of returns)
Here:
+$14,728
State:
+$18,329
(% of AGI for various income ranges: 21.5% for AGIs below $25k, 40.1% for AGIs $25k-50k, 139.9% for AGIs $50k-75k, 254.9% for AGIs $75k-100k, 1312.4% for AGIs $100k-200k, 22232.0% for AGIs over 200k)
Profit/loss from business: +$11,449 (reported on 11.7% of returns)
Here:
+$11,449
State:
+$14,562
(% of AGI for various income ranges: 55.6% for AGIs below $25k, 125.9% for AGIs $25k-50k, 193.4% for AGIs $50k-75k, 298.8% for AGIs $75k-100k, 748.0% for AGIs $100k-200k, 1480.0% for AGIs over 200k)
Taxable individual retirement arrangement distribution: $17,922 (reported on 10.8% of returns)
53190:
$17,922
Wisconsin:
$19,348
(% of AGI for various income ranges: 59.2% for AGIs below $25k, 106.5% for AGIs $25k-50k, 231.6% for AGIs $50k-75k, 418.8% for AGIs $75k-100k, 1048.3% for AGIs $100k-200k, 5950.0% for AGIs over 200k)
Self-employed (Keogh) retirement plans: $22,350 (reported on 0.3% of returns)
53190:
$22,350
Wisconsin:
$21,322
(% of AGI for various income ranges: 109.0% for AGIs $100k-200k)
Total itemized deductions: $32,276 (reported on 6.2% of returns)
Here:
$32,276
State:
$33,000
(% of AGI for various income ranges: 40.5% for AGIs below $25k, 120.6% for AGIs $25k-50k, 233.1% for AGIs $50k-75k, 471.9% for AGIs $75k-100k, 917.8% for AGIs $100k-200k, 7756.0% for AGIs over 200k)
Charity contributions: $9,826 (reported on 5.0% of returns)
Here:
$9,826
State:
$12,044
(% of AGI for various income ranges: 15.6% for AGIs $25k-50k, 28.1% for AGIs $50k-75k, 84.4% for AGIs $75k-100k, 228.0% for AGIs $100k-200k, 3290.0% for AGIs over 200k)
Taxes paid: $7,488 (reported on 6.2% of returns)
53190:
$7,488
State:
$8,228
(% of AGI for various income ranges: 6.2% for AGIs below $25k, 20.4% for AGIs $25k-50k, 73.3% for AGIs $50k-75k, 133.0% for AGIs $75k-100k, 240.2% for AGIs $100k-200k, 1430.0% for AGIs over 200k)
Earned income credit: $1,991 (reported on 11.4% of returns)
Here:
$1,991
State:
$2,155
(% of AGI for various income ranges: 53.0% for AGIs below $25k, 46.1% for AGIs $25k-50k)
Percentage of individuals using paid preparers for their 2020 taxes: 94.1%
Here:
94%
State:
94%
(% for various income ranges: 93.9% for AGIs below $25k, 94.3% for AGIs $25k-50k, 92.8% for AGIs $50k-75k, 94.2% for AGIs $75k-100k, 95.3% for AGIs $100k-200k, 95.2% for AGIs over 200k)
Averages for the 2012 tax year for zip code 53190, filed in 2013:
Average Adjusted Gross Income (AGI) in 2012: $49,572 (Individual Income Tax Returns)
Here:
$49,572
State:
$57,939
Salary/wage: $39,104 (reported on 84.7% of returns)
Here:
$39,104
State:
$48,248
(% of AGI for various income ranges: 79.4% for AGIs below $25k, 77.1% for AGIs $25k-50k, 73.4% for AGIs $50k-75k, 68.4% for AGIs $75k-100k, 65.1% for AGIs $100k-200k, 41.3% for AGIs over 200k)
Taxable interest for individuals: $1,356 (reported on 37.7% of returns)
This zip code:
$1,356
Wisconsin:
$1,224
(% of AGI for various income ranges: 1.5% for AGIs below $25k, 0.8% for AGIs $25k-50k, 0.9% for AGIs $50k-75k, 1.0% for AGIs $75k-100k, 0.9% for AGIs $100k-200k, 1.3% for AGIs over 200k)
Ordinary dividends: $4,353 (reported on 21.6% of returns)
Here:
$4,353
State:
$5,137
(% of AGI for various income ranges: 1.4% for AGIs below $25k, 1.1% for AGIs $25k-50k, 1.4% for AGIs $50k-75k, 1.6% for AGIs $75k-100k, 2.3% for AGIs $100k-200k, 3.1% for AGIs over 200k)
Net capital gain/loss in AGI: +$9,097 (reported on 16.1% of returns)
Here:
+$9,097
State:
+$11,137
(% of AGI for various income ranges: 0.2% for AGIs below $25k, 0.5% for AGIs $25k-50k, 0.7% for AGIs $50k-75k, 1.1% for AGIs $75k-100k, 2.8% for AGIs $100k-200k, 12.2% for AGIs over 200k)
Profit/loss from business: +$8,926 (reported on 12.7% of returns)
Here:
+$8,926
State:
+$11,943
(% of AGI for various income ranges: 4.6% for AGIs below $25k, 3.6% for AGIs $25k-50k, 0.8% for AGIs $50k-75k, 1.4% for AGIs $75k-100k, 2.4% for AGIs $100k-200k, 1.5% for AGIs over 200k)
Taxable individual retirement arrangement distribution: $13,801 (reported on 11.7% of returns)
53190:
$13,801
Wisconsin:
$14,087
(% of AGI for various income ranges: 2.9% for AGIs below $25k, 2.6% for AGIs $25k-50k, 3.0% for AGIs $50k-75k, 4.3% for AGIs $75k-100k, 3.5% for AGIs $100k-200k, 3.0% for AGIs over 200k)
Self-employment retirement plans: $14,150 (reported on 0.3% of returns)
53190:
$14,150
Wisconsin:
$17,048
Total itemized deductions: $21,016 (22% of AGI, reported on 32.0% of returns)
Here:
$21,016
State:
$22,257
Here:
21.5% of AGI
State:
20.1% of AGI
(% of AGI for various income ranges: 8.5% for AGIs below $25k, 11.0% for AGIs $25k-50k, 13.2% for AGIs $50k-75k, 16.4% for AGIs $75k-100k, 16.9% for AGIs $100k-200k, 11.7% for AGIs over 200k)
Charity contributions: $3,207 (reported on 25.3% of returns)
Here:
$3,207
State:
$3,370
(% of AGI for various income ranges: 0.4% for AGIs below $25k, 1.0% for AGIs $25k-50k, 1.3% for AGIs $50k-75k, 1.5% for AGIs $75k-100k, 2.5% for AGIs $100k-200k, 2.1% for AGIs over 200k)
Taxes paid: $9,421 (reported on 32.0% of returns)
53190:
$9,421
State:
$10,731
(% of AGI for various income ranges: 2.3% for AGIs below $25k, 3.5% for AGIs $25k-50k, 5.2% for AGIs $50k-75k, 7.2% for AGIs $75k-100k, 8.3% for AGIs $100k-200k, 7.5% for AGIs over 200k)
Earned income credit: $1,891 (reported on 13.8% of returns)
Here:
$1,891
State:
$2,094
(% of AGI for various income ranges: 3.8% for AGIs below $25k, 0.8% for AGIs $25k-50k)
Percentage of individuals using paid preparers for their 2012 taxes: 55.4%
Here:
55%
State:
54%
(% for various income ranges: 46.2% for AGIs below $25k, 60.3% for AGIs $25k-50k, 63.0% for AGIs $50k-75k, 60.4% for AGIs $75k-100k, 63.9% for AGIs $100k-200k, 81.8% for AGIs over 200k)
Averages for the 2004 tax year for zip code 53190, filed in 2005:
Average Adjusted Gross Income (AGI) in 2004: $40,038 (Individual Income Tax Returns)
Here:
$40,038
State:
$47,735
Salary/wage: $34,970 (reported on 85.2% of returns)
Here:
$34,970
State:
$41,540
(% of AGI for various income ranges: 119.7% for AGIs below $10k, 79.8% for AGIs $10k-25k, 80.1% for AGIs $25k-50k, 77.1% for AGIs $50k-75k, 73.8% for AGIs $75k-100k, 62.7% for AGIs over 100k)
Taxable interest for individuals: $1,513 (reported on 49.4% of returns)
This zip code:
$1,513
Wisconsin:
$1,420
(% of AGI for various income ranges: 5.9% for AGIs below $10k, 2.8% for AGIs $10k-25k, 1.4% for AGIs $25k-50k, 1.6% for AGIs $50k-75k, 1.6% for AGIs $75k-100k, 1.8% for AGIs over 100k)
Taxable dividends: $2,558 (reported on 25.1% of returns)
Here:
$2,558
State:
$2,869
(% of AGI for various income ranges: 3.8% for AGIs below $10k, 1.2% for AGIs $10k-25k, 1.0% for AGIs $25k-50k, 1.2% for AGIs $50k-75k, 1.3% for AGIs $75k-100k, 2.5% for AGIs over 100k)
Net capital gain/loss: +$5,204 (reported on 20.7% of returns)
Here:
+$5,204
State:
+$9,569
(% of AGI for various income ranges: 1.4% for AGIs below $10k, 0.6% for AGIs $10k-25k, 1.3% for AGIs $25k-50k, 1.0% for AGIs $50k-75k, 1.8% for AGIs $75k-100k, 6.5% for AGIs over 100k)
Profit/loss from business: +$8,624 (reported on 12.5% of returns)
Here:
+$8,624
State:
+$10,417
(% of AGI for various income ranges: -0.6% for AGIs below $10k, 3.0% for AGIs $10k-25k, 2.0% for AGIs $25k-50k, 2.2% for AGIs $50k-75k, 1.0% for AGIs $75k-100k, 4.8% for AGIs over 100k)
IRA payment deduction: $3,099 (reported on 2.3% of returns)
53190:
$3,099
Wisconsin:
$2,900
(% of AGI for various income ranges: 0.2% for AGIs $10k-25k, 0.3% for AGIs $25k-50k, 0.2% for AGIs $50k-75k, 0.1% for AGIs $75k-100k, 0.1% for AGIs over 100k)
Self-employed pension: $13,344 (reported on 0.5% of returns)
Here:
$13,344
Wisconsin:
$11,934
Total itemized deductions: $17,824 (24% of AGI, reported on 34.7% of returns)
Here:
$17,824
State:
$18,160
Here:
24.0% of AGI
State:
21.1% of AGI
(% of AGI for various income ranges: 13.7% for AGIs below $10k, 10.5% for AGIs $10k-25k, 12.9% for AGIs $25k-50k, 16.1% for AGIs $50k-75k, 18.5% for AGIs $75k-100k, 17.0% for AGIs over 100k)
Charity contributions deductions: $2,886 (4% of AGI, reported on 29.5% of returns)
Here:
$2,886
State:
$2,711
Here:
3.7% of AGI
State:
3.0% of AGI
(% of AGI for various income ranges: 0.9% for AGIs below $10k, 0.7% for AGIs $10k-25k, 1.1% for AGIs $25k-50k, 1.5% for AGIs $50k-75k, 2.3% for AGIs $75k-100k, 3.9% for AGIs over 100k)
Total tax: $5,312 (reported on 74.0% of returns)
53190:
$5,312
State:
$7,114
(% of AGI for various income ranges: 2.7% for AGIs below $10k, 4.2% for AGIs $10k-25k, 6.9% for AGIs $25k-50k, 8.4% for AGIs $50k-75k, 9.8% for AGIs $75k-100k, 15.8% for AGIs over 100k)
Earned income credit: $1,427 (reported on 10.1% of returns)
Here:
$1,427
State:
$1,544
Percentage of individuals using paid preparers for their 2004 taxes: 57.6%
Here:
58%
State:
57%
(% for various income ranges: 43.8% for AGIs below $10k, 57.0% for AGIs $10k-25k, 63.0% for AGIs $25k-50k, 65.1% for AGIs $50k-75k, 62.1% for AGIs $75k-100k, 66.8% for AGIs over 100k)
Likely homosexual households (counted as self-reported same-sex unmarried-partner households)
Lesbian couples: 0.3% of all households
Gay men: 0.4% of all households
Household received Food Stamps/SNAP in the past 12 months: 672 Household did not receive Food Stamps/SNAP in the past 12 months: 6,458
Women who had a birth in the past 12 months: 225 (90 now married, 133 unmarried) Women who did not have a birth in the past 12 months: 6,213 (1,162 now married, 5,051 unmarried)
Housing units in zip code 53190 with a mortgage: 1,915 (202 second mortgage, 6 home equity loan, 183 both second mortgage and home equity loan) Houses without a mortgage: 40
Median monthly owner costs for units with a mortgage: $1,649 Median monthly owner costs for units without a mortgage: $655
Residents with income below the poverty level in 2022:
This zip code:
25.5%
Whole state:
10.7%
Residents with income below 50% of the poverty level in 2022:
This zip code:
12.3%
Whole state:
5.7%
Median number of rooms in houses and condos:
Here:
6.7
State:
6.5
Median number of rooms in apartments:
Here:
4.1
State:
4.1
Notable locations in this zip code not listed on our city pages
Notable locations in zip code 53190: Perkins Stadium (A), Lauer Willis Farm (B), Onyx Valley Metal Landfill (C), Utters Corners (D), Williams Center (E), Wells Residence Hall (F), Wellers Hall (G), Tutt Hall (H), Knilans Hall (I), Esker Dining Hall (J), Lauderdale - LaGrange Fire Department (K), Whitewater Fire Department and Rescue Squad (L), Young Auditorium (M), Winther Hall (N), Whitewater Historical Society Museum (O), Whitewater City Hall (P), White Hall (Q), Veterans Memorial Building (R), Upham Hall (S), University Center (T). Display/hide their locations on the map
Churches in zip code 53190 include: North Lima Church (A), Whitewater Baptist Church (B), Whitewater Bible Church (C), University Lutheran Church (D), Saint Patricks Catholic Church (E), Saint Lukes Episcopal Church (F), Saint Johns Lutheran Church (G), First United Methodist Church (H), First English Lutheran Church (I). Display/hide their locations on the map
Cemeteries: Hillside Cemetery (1), Oak Grove Cemetery (2), Lyons Cemetery (3), Round Prairie Cemetery (4), Calvary Cemetery (5), Utters Corners Cemetery (6), Heart Prairie Cemetery (7). Display/hide their locations on the map
Lakes and reservoirs: Rice Lake (A), Whitewater Lake (B), Lake Lorraine (C), Lake La Grange (D), Cravath Lake (E), Cravath Lake 27.5 (F), Rice Lake (G), Tripp Lake 12.0 (H). Display/hide their locations on the map
Streams, rivers, and creeks: Bluff Creek (A), Spring Brook (B), Spring Creek (C), Galloway Creek (D), Steel Brook (E), Scuppernong River (F), Whitewater Creek (G). Display/hide their locations on the map
Parks in zip code 53190 include: Trippe Lake Park (1), Lima Bog State Natural Area (2), Bluff Creek State Natural Area (3), Clover Valley Fen State Natural Area (4), Young Prairie State Natural Area (5), Starin Park (6). Display/hide their locations on the map
1,775 married couples with children.
718 single-parent households (112 men, 606 women).
87.8% of residents of 53190 zip code speak English at home.
7.6% of residents speak Spanish at home (60% very well, 8% well, 19% not well, 13% not at all).
2.9% of residents speak other Indo-European language at home (66% very well, 14% well, 20% not well).
1.1% of residents speak Asian or Pacific Island language at home (87% very well, 11% well, 2% not well).
0.3% of residents speak other language at home (82% very well, 18% well).
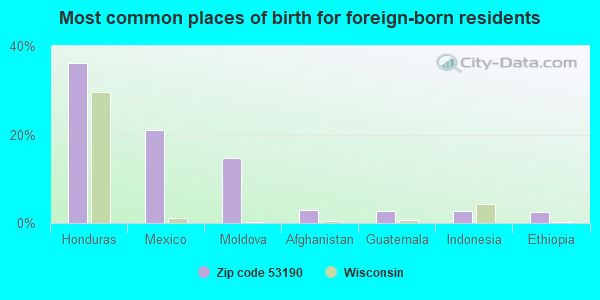
Foreign born population: 1,549 (7.5%) (36.4% of them are naturalized citizens)
This zip code:
7.5%
Whole state:
5.0%
36%Honduras
21%Mexico
15%Moldova
3%Afghanistan
3%Guatemala
3%Indonesia
3%Ethiopia
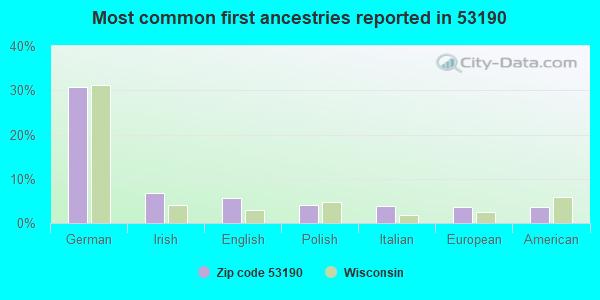
31%German
7%Irish
6%English
4%Polish
4%Italian
4%European
4%American
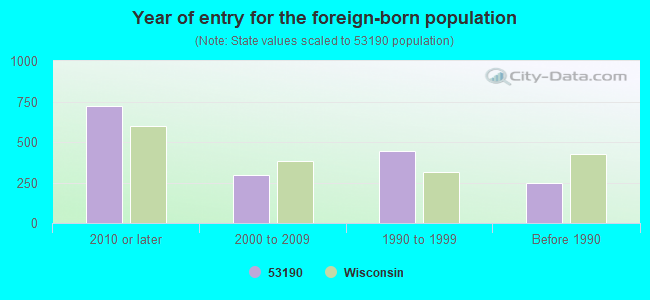
Year of entry for the foreign-born population
7222010 or later
2982000 to 2009
4431990 to 1999
249Before 1990
Facilities with environmental interests located in this zip code:
CHICAGO TAPE AND LABEL (834 E MILWAUKEE ST in WHITEWATER, WI)
COMPLIANCE ACTIVITY (Tracking inspections of insecticide, fungicide, and rodenticide, and toxic substances) Conditionally Exempt Small Quantity Generators, less than 100 kg/month of hazardous waste (Resource Conservation and Recovery Act (tracking hazardous waste)) STATE MASTER (Wisconsin database) - RCRAINFO-WIR000007633, CESQG Organizations: COBURN CO THE, COBURN JAMES (CONTACT/OWNER)
Alternative names: COBURN COMPANY THE
CLINTON POWER CO (848 E COMMERCIAL AVE in WHITEWATER, WI)
Conditionally Exempt Small Quantity Generators, less than 100 kg/month of hazardous waste (Resource Conservation and Recovery Act (tracking hazardous waste)) - notification STATE MASTER (Wisconsin database) - RCRAINFO-WID988579496, CESQG Business SIC classification: POWER, DISTRIBUTION, AND SPECIALTY TRANSFORMERS; ELECTRICAL INDUSTRIAL APPARATUS
BRODOLOC HEALTH CARE (209 TAFT in WHITEWATER, WI)
Small Quantity Generators, between 100 kg and 1000 kg of hazardous waste/month (Resource Conservation and Recovery Act (tracking hazardous waste)) - notification STATE MASTER (Wisconsin database) - RCRAINFO-WIR000034397, SQG
ALPHA-CAST, INCORPORATED (520 NORTH JEFFERSON STREET in WHITEWATER, WI)
AIR MAJOR (AIRS/AFS) SUPERFUND (Superfund database) TARGETED BROWNFIELDS ASSESSMENT (TBA) Business SIC classification: GRAY AND DUCTILE IRON FOUNDRIES Alternative names: ALPHA CAST II, ALPHA CAST II (B)
BYERLY PROPERTY (341 S PRINCE in WHITEWATER, WI)
(Resource Conservation and Recovery Act (tracking hazardous waste))
CHAPEL HILL LAKESIDE RESORT (N7317 CHAPEL HILL DR in WHITEWATER, WI)
Small Quantity Generators, between 100 kg and 1000 kg of hazardous waste/month (Resource Conservation and Recovery Act (tracking hazardous waste)) - notification TRANSPORTER (Resource Conservation and Recovery Act (tracking hazardous waste)) - notification Organizations: ESTATE OF HOWARD C MILLER (CONTACT/OWNER)
CLARK OIL STATION NO 869 (1106 W MAIN ST in WHITEWATER, WI)
Small Quantity Generators, between 100 kg and 1000 kg of hazardous waste/month (Resource Conservation and Recovery Act (tracking hazardous waste)) - notification Organizations: CLARK OIL AND REFINING CORP (CONTACT/OWNER)
Housing units lacking complete plumbing facilities: 0.9% Housing units lacking complete kitchen facilities: 1.5%
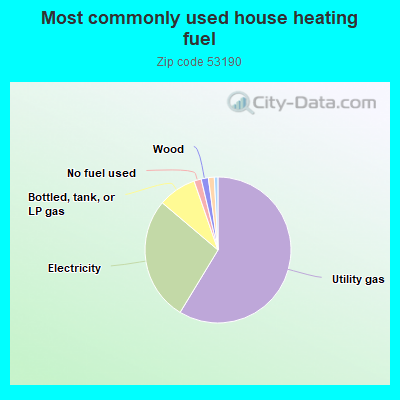
58.7%Utility gas
27.5%Electricity
8.5%Bottled, tank, or LP gas
1.6%No fuel used
1.6%Wood
1.3%Fuel oil, kerosene, etc.
0.8%Other fuel
Population in 1990: 16,723. Population change in the 1990s: +1,534 (+9.2%).
Place of birth for U.S.-born residents:
This state: 12,992
Northeast: 243
Midwest: 4,144
South: 833
West: 651
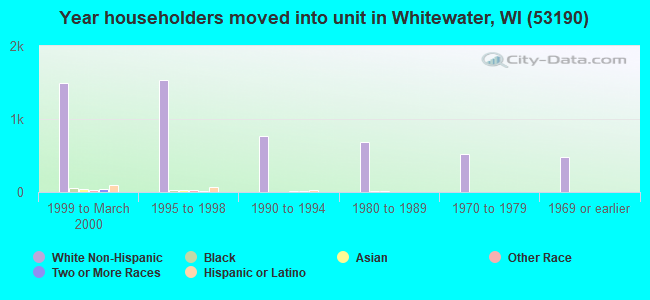
39% of the 53190 zip code residents lived in the same house 5 years ago. Out of people who lived in different houses, 24% lived in this county. Out of people who lived in different counties, 50% lived in Wisconsin.
83% of the 53190 zip code residents lived in the same house 1 year ago. Out of people who lived in different houses, 33% moved from this county. Out of people who lived in different houses, 51% moved from different county within same state. Out of people who lived in different houses, 8% moved from different state. Out of people who lived in different houses, 12% moved from abroad.
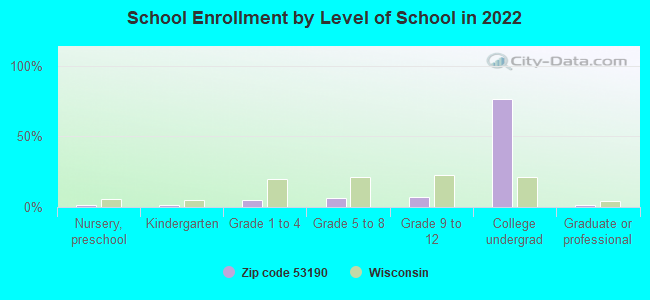
Private vs. public school enrollment:
Students in private schools in grades 1 to 8 (elementary and middle school): 93
Here:
8.4%
Wisconsin:
16.7%
Students in private schools in grades 9 to 12 (high school): 67
Here:
10.4%
Wisconsin:
12.5%
Students in private undergraduate colleges: 378
Here:
5.2%
Wisconsin:
17.5%
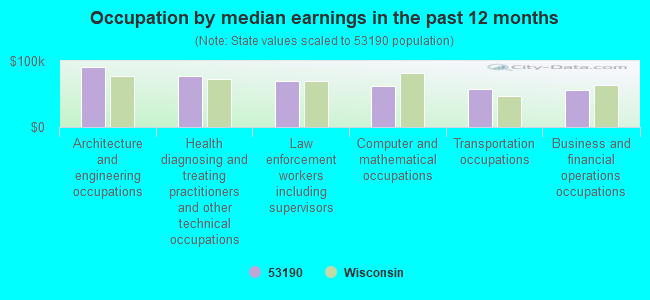
Occupation by median earnings in the past 12 months ($)
91,559Architecture and engineering occupations
77,847Health diagnosing and treating practitioners and other technical occupations
69,159Law enforcement workers including supervisors
61,522Computer and mathematical occupations
57,795Transportation occupations
55,321Business and financial operations occupations
Companies with federal contracts located in this zip code:
SCHENCK ACCURATE, INC (746 E MILWAUKEE ST in WHITEWATER, WI) : $110,796 in 8 contractsfrom 2002 to 2005
Contracts for Combination and Miscellaneous Instruments, Miscellaneous Electric Power and Distribution Equipment, Materials Feeders, , and moreby Forest Service, Army, EPA Signed by year:2000: $0; 2001: $0; 2002: $12,791; 2003: $49,005; 2004: $49,323; 2005: -$323; 2006: $0.
Biggest contracts:
$49,005 with Forest Service for Combination and Miscellaneous Instruments. Signed on 2003-12-31. Completion date: 2004-03-15.
$28,738 with Army for Miscellaneous Electric Power and Distribution Equipment. Signed on 2004-06-29. Completion date: 2004-09-28.
$12,791 with Army for Materials Feeders. Signed on 2002-07-22. Completion date: 2002-09-06.
$7,940 with EPA for . Signed on 2004-11-22. Completion date: 2004-11-22.
OPTICAL WAVELENGTH LABORATORIE (N9623 US HWY 12 in WHITEWATER, WI; small business) : $18,107 in 4 contractsin 2005
$6,156 with Navy for Fiber Optic Kits And Sets. Signed on 2005-05-05. Completion date: 2005-05-20.
$6,156 with Navy for Optoelectronic Devices and Associated Hardware. Signed on 2005-02-15. Completion date: 2005-03-11.
$2,980 with Air Force for Electrical and Electronic Properties Measuring and Testing Instruments. Signed on 2005-09-08. Completion date: 2005-10-07.
$2,815 with Army for Fiber Optic Kits And Sets. Taking place in KS. Signed on 2005-08-26. Completion date: 2005-08-31.
RAI ANA HOSPITALITY INC (1355 W MAIN STREET in WHITEWATER, WI; small business) : $5,456 in 2 contractsin 2005
$5,270 with Army for Lodging - Hotel/Motel. Signed on 2005-07-12. Completion date: 2005-07-11.
$186, same as above.Signed on 2005-08-10. Completion date: 2005-07-11.
Top industries in this zip code by the number of employees in 2005:
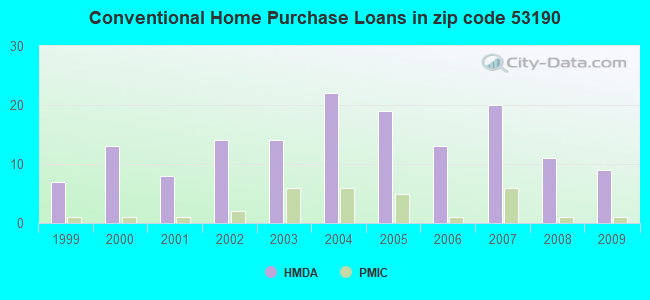
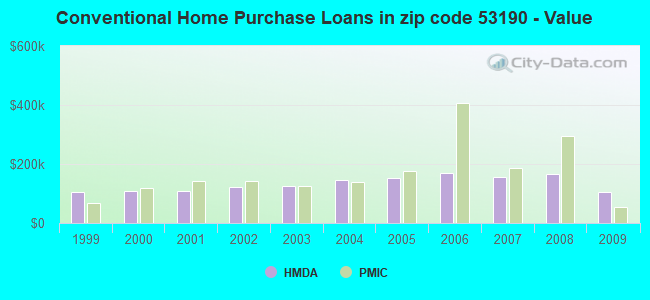
Detailed PMIC statistics for the following Tracts:0032.00
2003 - 2018 National Fire Incident Reporting System (NFIRS) incidents
According to the data from the years 2003 - 2018 the average number of fire incidents per year is 52. The highest number of fire incidents - 130 took place in 2015, and the least - 3 in 2003. The data has an increasing trend.
When looking into fire subcategories, the most incidents belonged to: Structure Fires (58.8%), and Outside Fires (27.2%).
Fire incident types reported to NFIRS in Zip Code 53190
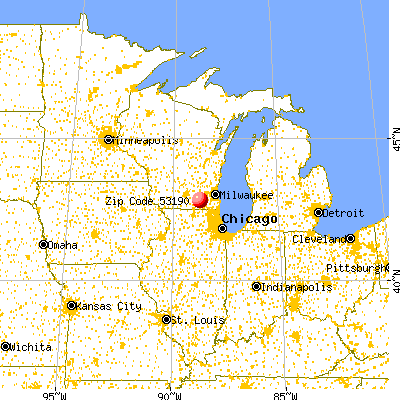


 Nearest zip codes: 53538, 53115, 53156, 53505, 53549, 53563.
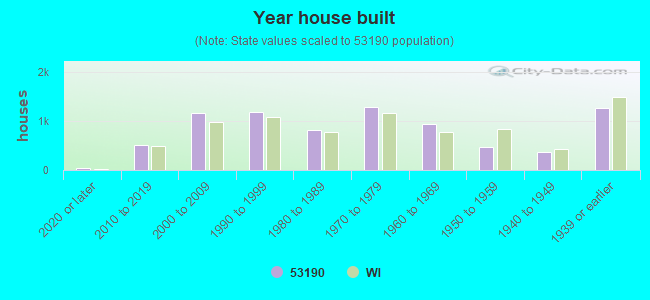


 According to the data from the years 2003 - 2018 the average number of fire incidents per year is 52. The highest number of fire incidents - 130 took place in 2015, and the least - 3 in 2003. The data has an increasing trend.
 When looking into fire subcategories, the most incidents belonged to: Structure Fires (58.8%), and Outside Fires (27.2%).