Estimated zip code population in 2022: 20,517
Zip code population in 2010: 28,210
Zip code population in 2000: 32,868
Houses and condos: 10,294
Renter-occupied apartments: 5,255
% of renters here:
67%State:
32%
March 2022 cost of living index in zip code 53206: 96.0
(near average, U.S. average is 100)
Land area: 2.7
sq. mi.
Water area: 0.0
sq. mi.
Population density: 7,622 people per square mile (high).
OSM Map
General Map
Google Map
MSN Map
OSM Map
General Map
Google Map
MSN Map
OSM Map
General Map
Google Map
MSN Map
OSM Map
General Map
Google Map
MSN Map
Please wait while loading the map...
Real estate property taxes paid for housing units in 2022:
This zip code:
1.8% ($1,228)Wisconsin:
1.4% ($3,497)
Median real estate property taxes paid for housing units with mortgages in 2022: $1,330 (1.8%)
Median real estate property taxes paid for housing units with no mortgage in 2022: $1,175 (1.8%)
Profiles of local businesses
Business Search - 14 Million verified businesses
Males: 9,419 Females: 11,094
For population 25 years and over in 53206:
High school or higher: 80.5%Bachelor's degree or higher: 7.2%Graduate or professional degree: 2.3%Unemployed: 7.9%Mean travel time to work (commute): 27.3 minutes
For population 15 years and over in 53206:
Never married: 66.9%Now married: 16.2%Separated: 2.4%Widowed: 5.5%Divorced: 9.1%
Zip code 53206 compared to state average:
Median household income significantly below state average. Median house value significantly below state average. Unemployed percentage above state average. Black race population percentage significantly above state average. Hispanic race population percentage significantly below state average. Median age significantly below state average. Foreign-born population percentage significantly below state average. Renting percentage above state average. Length of stay since moving in significantly above state average. House age significantly above state average. Number of college students below state average. Percentage of population with a bachelor's degree or higher significantly below state average. 18,695 91.1% Black 574 2.8% Two or more races 466 2.3% White 390 1.9% Hispanic or Latino 205 1.0% Some other race 164 0.8% Asian 15 0.07% American Indian 6 0.03% Native Hawaiian and Other
Data:
Median household income ($)
Median household income (% change since 2000)
Household income diversity
Ratio of average income to average house value (%)
Ratio of average income to average rent
Median household income ($) - White
Median household income ($) - Black or African American
Median household income ($) - Asian
Median household income ($) - Hispanic or Latino
Median household income ($) - American Indian and Alaska Native
Median household income ($) - Multirace
Median household income ($) - Other Race
Median household income for houses/condos with a mortgage ($)
Median household income for apartments without a mortgage ($)
Races - White alone (%)
Races - White alone (% change since 2000)
Races - Black alone (%)
Races - Black alone (% change since 2000)
Races - American Indian alone (%)
Races - American Indian alone (% change since 2000)
Races - Asian alone (%)
Races - Asian alone (% change since 2000)
Races - Hispanic (%)
Races - Hispanic (% change since 2000)
Races - Native Hawaiian and Other Pacific Islander alone (%)
Races - Native Hawaiian and Other Pacific Islander alone (% change since 2000)
Races - Two or more races (%)
Races - Two or more races (% change since 2000)
Races - Other race alone (%)
Races - Other race alone (% change since 2000)
Racial diversity
Unemployment (%)
Unemployment (% change since 2000)
Unemployment (%) - White
Unemployment (%) - Black or African American
Unemployment (%) - Asian
Unemployment (%) - Hispanic or Latino
Unemployment (%) - American Indian and Alaska Native
Unemployment (%) - Multirace
Unemployment (%) - Other Race
Population density (people per square mile)
Population - Males (%)
Population - Females (%)
Population - Males (%) - White
Population - Males (%) - Black or African American
Population - Males (%) - Asian
Population - Males (%) - Hispanic or Latino
Population - Males (%) - American Indian and Alaska Native
Population - Males (%) - Multirace
Population - Males (%) - Other Race
Population - Females (%) - White
Population - Females (%) - Black or African American
Population - Females (%) - Asian
Population - Females (%) - Hispanic or Latino
Population - Females (%) - American Indian and Alaska Native
Population - Females (%) - Multirace
Population - Females (%) - Other Race
Coronavirus confirmed cases (Apr 27, 2024)
Deaths caused by coronavirus (Apr 27, 2024)
Coronavirus confirmed cases (per 100k population) (Apr 27, 2024)
Deaths caused by coronavirus (per 100k population) (Apr 27, 2024)
Daily increase in number of cases (Apr 27, 2024)
Weekly increase in number of cases (Apr 27, 2024)
Cases doubled (in days) (Apr 27, 2024)
Hospitalized patients (Apr 18, 2022)
Negative test results (Apr 18, 2022)
Total test results (Apr 18, 2022)
COVID Vaccine doses distributed (per 100k population) (Sep 19, 2023)
COVID Vaccine doses administered (per 100k population) (Sep 19, 2023)
COVID Vaccine doses distributed (Sep 19, 2023)
COVID Vaccine doses administered (Sep 19, 2023)
Likely homosexual households (%)
Likely homosexual households (% change since 2000)
Likely homosexual households - Lesbian couples (%)
Likely homosexual households - Lesbian couples (% change since 2000)
Likely homosexual households - Gay men (%)
Likely homosexual households - Gay men (% change since 2000)
Cost of living index
Median gross rent ($)
Median contract rent ($)
Median monthly housing costs ($)
Median house or condo value ($)
Median house or condo value ($ change since 2000)
Mean house or condo value by units in structure - 1, detached ($)
Mean house or condo value by units in structure - 1, attached ($)
Mean house or condo value by units in structure - 2 ($)
Mean house or condo value by units in structure by units in structure - 3 or 4 ($)
Mean house or condo value by units in structure - 5 or more ($)
Mean house or condo value by units in structure - Boat, RV, van, etc. ($)
Mean house or condo value by units in structure - Mobile home ($)
Median house or condo value ($) - White
Median house or condo value ($) - Black or African American
Median house or condo value ($) - Asian
Median house or condo value ($) - Hispanic or Latino
Median house or condo value ($) - American Indian and Alaska Native
Median house or condo value ($) - Multirace
Median house or condo value ($) - Other Race
Median resident age
Resident age diversity
Median resident age - Males
Median resident age - Females
Median resident age - White
Median resident age - Black or African American
Median resident age - Asian
Median resident age - Hispanic or Latino
Median resident age - American Indian and Alaska Native
Median resident age - Multirace
Median resident age - Other Race
Median resident age - Males - White
Median resident age - Males - Black or African American
Median resident age - Males - Asian
Median resident age - Males - Hispanic or Latino
Median resident age - Males - American Indian and Alaska Native
Median resident age - Males - Multirace
Median resident age - Males - Other Race
Median resident age - Females - White
Median resident age - Females - Black or African American
Median resident age - Females - Asian
Median resident age - Females - Hispanic or Latino
Median resident age - Females - American Indian and Alaska Native
Median resident age - Females - Multirace
Median resident age - Females - Other Race
Commute - mean travel time to work (minutes)
Travel time to work - Less than 5 minutes (%)
Travel time to work - Less than 5 minutes (% change since 2000)
Travel time to work - 5 to 9 minutes (%)
Travel time to work - 5 to 9 minutes (% change since 2000)
Travel time to work - 10 to 19 minutes (%)
Travel time to work - 10 to 19 minutes (% change since 2000)
Travel time to work - 20 to 29 minutes (%)
Travel time to work - 20 to 29 minutes (% change since 2000)
Travel time to work - 30 to 39 minutes (%)
Travel time to work - 30 to 39 minutes (% change since 2000)
Travel time to work - 40 to 59 minutes (%)
Travel time to work - 40 to 59 minutes (% change since 2000)
Travel time to work - 60 to 89 minutes (%)
Travel time to work - 60 to 89 minutes (% change since 2000)
Travel time to work - 90 or more minutes (%)
Travel time to work - 90 or more minutes (% change since 2000)
Marital status - Never married (%)
Marital status - Now married (%)
Marital status - Separated (%)
Marital status - Widowed (%)
Marital status - Divorced (%)
Median family income ($)
Median family income (% change since 2000)
Median non-family income ($)
Median non-family income (% change since 2000)
Median per capita income ($)
Median per capita income (% change since 2000)
Median family income ($) - White
Median family income ($) - Black or African American
Median family income ($) - Asian
Median family income ($) - Hispanic or Latino
Median family income ($) - American Indian and Alaska Native
Median family income ($) - Multirace
Median family income ($) - Other Race
Median year house/condo built
Median year apartment built
Year house built - Built 2005 or later (%)
Year house built - Built 2000 to 2004 (%)
Year house built - Built 1990 to 1999 (%)
Year house built - Built 1980 to 1989 (%)
Year house built - Built 1970 to 1979 (%)
Year house built - Built 1960 to 1969 (%)
Year house built - Built 1950 to 1959 (%)
Year house built - Built 1940 to 1949 (%)
Year house built - Built 1939 or earlier (%)
Average household size
Household density (households per square mile)
Average household size - White
Average household size - Black or African American
Average household size - Asian
Average household size - Hispanic or Latino
Average household size - American Indian and Alaska Native
Average household size - Multirace
Average household size - Other Race
Occupied housing units (%)
Vacant housing units (%)
Owner occupied housing units (%)
Renter occupied housing units (%)
Vacancy status - For rent (%)
Vacancy status - For sale only (%)
Vacancy status - Rented or sold, not occupied (%)
Vacancy status - For seasonal, recreational, or occasional use (%)
Vacancy status - For migrant workers (%)
Vacancy status - Other vacant (%)
Residents with income below the poverty level (%)
Residents with income below 50% of the poverty level (%)
Children below poverty level (%)
Poor families by family type - Married-couple family (%)
Poor families by family type - Male, no wife present (%)
Poor families by family type - Female, no husband present (%)
Poverty status for native-born residents (%)
Poverty status for foreign-born residents (%)
Poverty among high school graduates not in families (%)
Poverty among people who did not graduate high school not in families (%)
Residents with income below the poverty level (%) - White
Residents with income below the poverty level (%) - Black or African American
Residents with income below the poverty level (%) - Asian
Residents with income below the poverty level (%) - Hispanic or Latino
Residents with income below the poverty level (%) - American Indian and Alaska Native
Residents with income below the poverty level (%) - Multirace
Residents with income below the poverty level (%) - Other Race
Air pollution - Air Quality Index (AQI)
Air pollution - CO
Air pollution - NO2
Air pollution - SO2
Air pollution - Ozone
Air pollution - PM10
Air pollution - PM25
Air pollution - Pb
Crime - Murders per 100,000 population
Crime - Rapes per 100,000 population
Crime - Robberies per 100,000 population
Crime - Assaults per 100,000 population
Crime - Burglaries per 100,000 population
Crime - Thefts per 100,000 population
Crime - Auto thefts per 100,000 population
Crime - Arson per 100,000 population
Crime - City-data.com crime index
Crime - Violent crime index
Crime - Property crime index
Crime - Murders per 100,000 population (5 year average)
Crime - Rapes per 100,000 population (5 year average)
Crime - Robberies per 100,000 population (5 year average)
Crime - Assaults per 100,000 population (5 year average)
Crime - Burglaries per 100,000 population (5 year average)
Crime - Thefts per 100,000 population (5 year average)
Crime - Auto thefts per 100,000 population (5 year average)
Crime - Arson per 100,000 population (5 year average)
Crime - City-data.com crime index (5 year average)
Crime - Violent crime index (5 year average)
Crime - Property crime index (5 year average)
1996 Presidential Elections Results (%) - Democratic Party (Clinton)
1996 Presidential Elections Results (%) - Republican Party (Dole)
1996 Presidential Elections Results (%) - Other
2000 Presidential Elections Results (%) - Democratic Party (Gore)
2000 Presidential Elections Results (%) - Republican Party (Bush)
2000 Presidential Elections Results (%) - Other
2004 Presidential Elections Results (%) - Democratic Party (Kerry)
2004 Presidential Elections Results (%) - Republican Party (Bush)
2004 Presidential Elections Results (%) - Other
2008 Presidential Elections Results (%) - Democratic Party (Obama)
2008 Presidential Elections Results (%) - Republican Party (McCain)
2008 Presidential Elections Results (%) - Other
2012 Presidential Elections Results (%) - Democratic Party (Obama)
2012 Presidential Elections Results (%) - Republican Party (Romney)
2012 Presidential Elections Results (%) - Other
2016 Presidential Elections Results (%) - Democratic Party (Clinton)
2016 Presidential Elections Results (%) - Republican Party (Trump)
2016 Presidential Elections Results (%) - Other
2020 Presidential Elections Results (%) - Democratic Party (Biden)
2020 Presidential Elections Results (%) - Republican Party (Trump)
2020 Presidential Elections Results (%) - Other
Ancestries Reported - Arab (%)
Ancestries Reported - Czech (%)
Ancestries Reported - Danish (%)
Ancestries Reported - Dutch (%)
Ancestries Reported - English (%)
Ancestries Reported - French (%)
Ancestries Reported - French Canadian (%)
Ancestries Reported - German (%)
Ancestries Reported - Greek (%)
Ancestries Reported - Hungarian (%)
Ancestries Reported - Irish (%)
Ancestries Reported - Italian (%)
Ancestries Reported - Lithuanian (%)
Ancestries Reported - Norwegian (%)
Ancestries Reported - Polish (%)
Ancestries Reported - Portuguese (%)
Ancestries Reported - Russian (%)
Ancestries Reported - Scotch-Irish (%)
Ancestries Reported - Scottish (%)
Ancestries Reported - Slovak (%)
Ancestries Reported - Subsaharan African (%)
Ancestries Reported - Swedish (%)
Ancestries Reported - Swiss (%)
Ancestries Reported - Ukrainian (%)
Ancestries Reported - United States (%)
Ancestries Reported - Welsh (%)
Ancestries Reported - West Indian (%)
Ancestries Reported - Other (%)
Educational Attainment - No schooling completed (%)
Educational Attainment - Less than high school (%)
Educational Attainment - High school or equivalent (%)
Educational Attainment - Less than 1 year of college (%)
Educational Attainment - 1 or more years of college (%)
Educational Attainment - Associate degree (%)
Educational Attainment - Bachelor's degree (%)
Educational Attainment - Master's degree (%)
Educational Attainment - Professional school degree (%)
Educational Attainment - Doctorate degree (%)
School Enrollment - Nursery, preschool (%)
School Enrollment - Kindergarten (%)
School Enrollment - Grade 1 to 4 (%)
School Enrollment - Grade 5 to 8 (%)
School Enrollment - Grade 9 to 12 (%)
School Enrollment - College undergrad (%)
School Enrollment - Graduate or professional (%)
School Enrollment - Not enrolled in school (%)
School enrollment - Public schools (%)
School enrollment - Private schools (%)
School enrollment - Not enrolled (%)
Median number of rooms in houses and condos
Median number of rooms in apartments
Housing units lacking complete plumbing facilities (%)
Housing units lacking complete kitchen facilities (%)
Density of houses
Urban houses (%)
Rural houses (%)
Households with people 60 years and over (%)
Households with people 65 years and over (%)
Households with people 75 years and over (%)
Households with one or more nonrelatives (%)
Households with no nonrelatives (%)
Population in households (%)
Family households (%)
Nonfamily households (%)
Population in families (%)
Family households with own children (%)
Median number of bedrooms in owner occupied houses
Mean number of bedrooms in owner occupied houses
Median number of bedrooms in renter occupied houses
Mean number of bedrooms in renter occupied houses
Median number of vehichles in owner occupied houses
Mean number of vehichles in owner occupied houses
Median number of vehichles in renter occupied houses
Mean number of vehichles in renter occupied houses
Mortgage status - with mortgage (%)
Mortgage status - with second mortgage (%)
Mortgage status - with home equity loan (%)
Mortgage status - with both second mortgage and home equity loan (%)
Mortgage status - without a mortgage (%)
Average family size
Average family size - White
Average family size - Black or African American
Average family size - Asian
Average family size - Hispanic or Latino
Average family size - American Indian and Alaska Native
Average family size - Multirace
Average family size - Other Race
Geographical mobility - Same house 1 year ago (%)
Geographical mobility - Moved within same county (%)
Geographical mobility - Moved from different county within same state (%)
Geographical mobility - Moved from different state (%)
Geographical mobility - Moved from abroad (%)
Place of birth - Born in state of residence (%)
Place of birth - Born in other state (%)
Place of birth - Native, outside of US (%)
Place of birth - Foreign born (%)
Housing units in structures - 1, detached (%)
Housing units in structures - 1, attached (%)
Housing units in structures - 2 (%)
Housing units in structures - 3 or 4 (%)
Housing units in structures - 5 to 9 (%)
Housing units in structures - 10 to 19 (%)
Housing units in structures - 20 to 49 (%)
Housing units in structures - 50 or more (%)
Housing units in structures - Mobile home (%)
Housing units in structures - Boat, RV, van, etc. (%)
House/condo owner moved in on average (years ago)
Renter moved in on average (years ago)
Year householder moved into unit - Moved in 1999 to March 2000 (%)
Year householder moved into unit - Moved in 1995 to 1998 (%)
Year householder moved into unit - Moved in 1990 to 1994 (%)
Year householder moved into unit - Moved in 1980 to 1989 (%)
Year householder moved into unit - Moved in 1970 to 1979 (%)
Year householder moved into unit - Moved in 1969 or earlier (%)
Means of transportation to work - Drove car alone (%)
Means of transportation to work - Carpooled (%)
Means of transportation to work - Public transportation (%)
Means of transportation to work - Bus or trolley bus (%)
Means of transportation to work - Streetcar or trolley car (%)
Means of transportation to work - Subway or elevated (%)
Means of transportation to work - Railroad (%)
Means of transportation to work - Ferryboat (%)
Means of transportation to work - Taxicab (%)
Means of transportation to work - Motorcycle (%)
Means of transportation to work - Bicycle (%)
Means of transportation to work - Walked (%)
Means of transportation to work - Other means (%)
Working at home (%)
Industry diversity
Most Common Industries - Agriculture, forestry, fishing and hunting, and mining (%)
Most Common Industries - Agriculture, forestry, fishing and hunting (%)
Most Common Industries - Mining, quarrying, and oil and gas extraction (%)
Most Common Industries - Construction (%)
Most Common Industries - Manufacturing (%)
Most Common Industries - Wholesale trade (%)
Most Common Industries - Retail trade (%)
Most Common Industries - Transportation and warehousing, and utilities (%)
Most Common Industries - Transportation and warehousing (%)
Most Common Industries - Utilities (%)
Most Common Industries - Information (%)
Most Common Industries - Finance and insurance, and real estate and rental and leasing (%)
Most Common Industries - Finance and insurance (%)
Most Common Industries - Real estate and rental and leasing (%)
Most Common Industries - Professional, scientific, and management, and administrative and waste management services (%)
Most Common Industries - Professional, scientific, and technical services (%)
Most Common Industries - Management of companies and enterprises (%)
Most Common Industries - Administrative and support and waste management services (%)
Most Common Industries - Educational services, and health care and social assistance (%)
Most Common Industries - Educational services (%)
Most Common Industries - Health care and social assistance (%)
Most Common Industries - Arts, entertainment, and recreation, and accommodation and food services (%)
Most Common Industries - Arts, entertainment, and recreation (%)
Most Common Industries - Accommodation and food services (%)
Most Common Industries - Other services, except public administration (%)
Most Common Industries - Public administration (%)
Occupation diversity
Most Common Occupations - Management, business, science, and arts occupations (%)
Most Common Occupations - Management, business, and financial occupations (%)
Most Common Occupations - Management occupations (%)
Most Common Occupations - Business and financial operations occupations (%)
Most Common Occupations - Computer, engineering, and science occupations (%)
Most Common Occupations - Computer and mathematical occupations (%)
Most Common Occupations - Architecture and engineering occupations (%)
Most Common Occupations - Life, physical, and social science occupations (%)
Most Common Occupations - Education, legal, community service, arts, and media occupations (%)
Most Common Occupations - Community and social service occupations (%)
Most Common Occupations - Legal occupations (%)
Most Common Occupations - Education, training, and library occupations (%)
Most Common Occupations - Arts, design, entertainment, sports, and media occupations (%)
Most Common Occupations - Healthcare practitioners and technical occupations (%)
Most Common Occupations - Health diagnosing and treating practitioners and other technical occupations (%)
Most Common Occupations - Health technologists and technicians (%)
Most Common Occupations - Service occupations (%)
Most Common Occupations - Healthcare support occupations (%)
Most Common Occupations - Protective service occupations (%)
Most Common Occupations - Fire fighting and prevention, and other protective service workers including supervisors (%)
Most Common Occupations - Law enforcement workers including supervisors (%)
Most Common Occupations - Food preparation and serving related occupations (%)
Most Common Occupations - Building and grounds cleaning and maintenance occupations (%)
Most Common Occupations - Personal care and service occupations (%)
Most Common Occupations - Sales and office occupations (%)
Most Common Occupations - Sales and related occupations (%)
Most Common Occupations - Office and administrative support occupations (%)
Most Common Occupations - Natural resources, construction, and maintenance occupations (%)
Most Common Occupations - Farming, fishing, and forestry occupations (%)
Most Common Occupations - Construction and extraction occupations (%)
Most Common Occupations - Installation, maintenance, and repair occupations (%)
Most Common Occupations - Production, transportation, and material moving occupations (%)
Most Common Occupations - Production occupations (%)
Most Common Occupations - Transportation occupations (%)
Most Common Occupations - Material moving occupations (%)
People in Group quarters - Institutionalized population (%)
People in Group quarters - Correctional institutions (%)
People in Group quarters - Federal prisons and detention centers (%)
People in Group quarters - Halfway houses (%)
People in Group quarters - Local jails and other confinement facilities (including police lockups) (%)
People in Group quarters - Military disciplinary barracks (%)
People in Group quarters - State prisons (%)
People in Group quarters - Other types of correctional institutions (%)
People in Group quarters - Nursing homes (%)
People in Group quarters - Hospitals/wards, hospices, and schools for the handicapped (%)
People in Group quarters - Hospitals/wards and hospices for chronically ill (%)
People in Group quarters - Hospices or homes for chronically ill (%)
People in Group quarters - Military hospitals or wards for chronically ill (%)
People in Group quarters - Other hospitals or wards for chronically ill (%)
People in Group quarters - Hospitals or wards for drug/alcohol abuse (%)
People in Group quarters - Mental (Psychiatric) hospitals or wards (%)
People in Group quarters - Schools, hospitals, or wards for the mentally retarded (%)
People in Group quarters - Schools, hospitals, or wards for the physically handicapped (%)
People in Group quarters - Institutions for the deaf (%)
People in Group quarters - Institutions for the blind (%)
People in Group quarters - Orthopedic wards and institutions for the physically handicapped (%)
People in Group quarters - Wards in general hospitals for patients who have no usual home elsewhere (%)
People in Group quarters - Wards in military hospitals for patients who have no usual home elsewhere (%)
People in Group quarters - Juvenile institutions (%)
People in Group quarters - Long-term care (%)
People in Group quarters - Homes for abused, dependent, and neglected children (%)
People in Group quarters - Residential treatment centers for emotionally disturbed children (%)
People in Group quarters - Training schools for juvenile delinquents (%)
People in Group quarters - Short-term care, detention or diagnostic centers for delinquent children (%)
People in Group quarters - Type of juvenile institution unknown (%)
People in Group quarters - Noninstitutionalized population (%)
People in Group quarters - College dormitories (includes college quarters off campus) (%)
People in Group quarters - Military quarters (%)
People in Group quarters - On base (%)
People in Group quarters - Barracks, unaccompanied personnel housing (UPH), (Enlisted/Officer), ;and similar group living quarters for military personnel (%)
People in Group quarters - Transient quarters for temporary residents (%)
People in Group quarters - Military ships (%)
People in Group quarters - Group homes (%)
People in Group quarters - Homes or halfway houses for drug/alcohol abuse (%)
People in Group quarters - Homes for the mentally ill (%)
People in Group quarters - Homes for the mentally retarded (%)
People in Group quarters - Homes for the physically handicapped (%)
People in Group quarters - Other group homes (%)
People in Group quarters - Religious group quarters (%)
People in Group quarters - Dormitories (%)
People in Group quarters - Agriculture workers' dormitories on farms (%)
People in Group quarters - Job Corps and vocational training facilities (%)
People in Group quarters - Other workers' dormitories (%)
People in Group quarters - Crews of maritime vessels (%)
People in Group quarters - Other nonhousehold living situations (%)
People in Group quarters - Other noninstitutional group quarters (%)
Residents speaking English at home (%)
Residents speaking English at home - Born in the United States (%)
Residents speaking English at home - Native, born elsewhere (%)
Residents speaking English at home - Foreign born (%)
Residents speaking Spanish at home (%)
Residents speaking Spanish at home - Born in the United States (%)
Residents speaking Spanish at home - Native, born elsewhere (%)
Residents speaking Spanish at home - Foreign born (%)
Residents speaking other language at home (%)
Residents speaking other language at home - Born in the United States (%)
Residents speaking other language at home - Native, born elsewhere (%)
Residents speaking other language at home - Foreign born (%)
Class of Workers - Employee of private company (%)
Class of Workers - Self-employed in own incorporated business (%)
Class of Workers - Private not-for-profit wage and salary workers (%)
Class of Workers - Local government workers (%)
Class of Workers - State government workers (%)
Class of Workers - Federal government workers (%)
Class of Workers - Self-employed workers in own not incorporated business and Unpaid family workers (%)
House heating fuel used in houses and condos - Utility gas (%)
House heating fuel used in houses and condos - Bottled, tank, or LP gas (%)
House heating fuel used in houses and condos - Electricity (%)
House heating fuel used in houses and condos - Fuel oil, kerosene, etc. (%)
House heating fuel used in houses and condos - Coal or coke (%)
House heating fuel used in houses and condos - Wood (%)
House heating fuel used in houses and condos - Solar energy (%)
House heating fuel used in houses and condos - Other fuel (%)
House heating fuel used in houses and condos - No fuel used (%)
House heating fuel used in apartments - Utility gas (%)
House heating fuel used in apartments - Bottled, tank, or LP gas (%)
House heating fuel used in apartments - Electricity (%)
House heating fuel used in apartments - Fuel oil, kerosene, etc. (%)
House heating fuel used in apartments - Coal or coke (%)
House heating fuel used in apartments - Wood (%)
House heating fuel used in apartments - Solar energy (%)
House heating fuel used in apartments - Other fuel (%)
House heating fuel used in apartments - No fuel used (%)
Armed forces status - In Armed Forces (%)
Armed forces status - Civilian (%)
Armed forces status - Civilian - Veteran (%)
Armed forces status - Civilian - Nonveteran (%)
Fatal accidents locations in years 2005-2021
Fatal accidents locations in 2005
Fatal accidents locations in 2006
Fatal accidents locations in 2007
Fatal accidents locations in 2008
Fatal accidents locations in 2009
Fatal accidents locations in 2010
Fatal accidents locations in 2011
Fatal accidents locations in 2012
Fatal accidents locations in 2013
Fatal accidents locations in 2014
Fatal accidents locations in 2015
Fatal accidents locations in 2016
Fatal accidents locations in 2017
Fatal accidents locations in 2018
Fatal accidents locations in 2019
Fatal accidents locations in 2020
Fatal accidents locations in 2021
Alcohol use - People drinking some alcohol every month (%)
Alcohol use - People not drinking at all (%)
Alcohol use - Average days/month drinking alcohol
Alcohol use - Average drinks/week
Alcohol use - Average days/year people drink much
Audiometry - Average condition of hearing (%)
Audiometry - People that can hear a whisper from across a quiet room (%)
Audiometry - People that can hear normal voice from across a quiet room (%)
Audiometry - Ears ringing, roaring, buzzing (%)
Audiometry - Had a job exposure to loud noise (%)
Audiometry - Had off-work exposure to loud noise (%)
Blood Pressure & Cholesterol - Has high blood pressure (%)
Blood Pressure & Cholesterol - Checking blood pressure at home (%)
Blood Pressure & Cholesterol - Frequently checking blood cholesterol (%)
Blood Pressure & Cholesterol - Has high cholesterol level (%)
Consumer Behavior - Money monthly spent on food at supermarket/grocery store
Consumer Behavior - Money monthly spent on food at other stores
Consumer Behavior - Money monthly spent on eating out
Consumer Behavior - Money monthly spent on carryout/delivered foods
Consumer Behavior - Income spent on food at supermarket/grocery store (%)
Consumer Behavior - Income spent on food at other stores (%)
Consumer Behavior - Income spent on eating out (%)
Consumer Behavior - Income spent on carryout/delivered foods (%)
Current Health Status - General health condition (%)
Current Health Status - Blood donors (%)
Current Health Status - Has blood ever tested for HIV virus (%)
Current Health Status - Left-handed people (%)
Dermatology - People using sunscreen (%)
Diabetes - Diabetics (%)
Diabetes - Had a blood test for high blood sugar (%)
Diabetes - People taking insulin (%)
Diet Behavior & Nutrition - Diet health (%)
Diet Behavior & Nutrition - Milk product consumption (# of products/month)
Diet Behavior & Nutrition - Meals not home prepared (#/week)
Diet Behavior & Nutrition - Meals from fast food or pizza place (#/week)
Diet Behavior & Nutrition - Ready-to-eat foods (#/month)
Diet Behavior & Nutrition - Frozen meals/pizza (#/month)
Drug Use - People that ever used marijuana or hashish (%)
Drug Use - Ever used hard drugs (%)
Drug Use - Ever used any form of cocaine (%)
Drug Use - Ever used heroin (%)
Drug Use - Ever used methamphetamine (%)
Health Insurance - People covered by health insurance (%)
Kidney Conditions-Urology - Avg. # of times urinating at night
Medical Conditions - People with asthma (%)
Medical Conditions - People with anemia (%)
Medical Conditions - People with psoriasis (%)
Medical Conditions - People with overweight (%)
Medical Conditions - Elderly people having difficulties in thinking or remembering (%)
Medical Conditions - People who ever received blood transfusion (%)
Medical Conditions - People having trouble seeing even with glass/contacts (%)
Medical Conditions - People with arthritis (%)
Medical Conditions - People with gout (%)
Medical Conditions - People with congestive heart failure (%)
Medical Conditions - People with coronary heart disease (%)
Medical Conditions - People with angina pectoris (%)
Medical Conditions - People who ever had heart attack (%)
Medical Conditions - People who ever had stroke (%)
Medical Conditions - People with emphysema (%)
Medical Conditions - People with thyroid problem (%)
Medical Conditions - People with chronic bronchitis (%)
Medical Conditions - People with any liver condition (%)
Medical Conditions - People who ever had cancer or malignancy (%)
Mental Health - People who have little interest in doing things (%)
Mental Health - People feeling down, depressed, or hopeless (%)
Mental Health - People who have trouble sleeping or sleeping too much (%)
Mental Health - People feeling tired or having little energy (%)
Mental Health - People with poor appetite or overeating (%)
Mental Health - People feeling bad about themself (%)
Mental Health - People who have trouble concentrating on things (%)
Mental Health - People moving or speaking slowly or too fast (%)
Mental Health - People having thoughts they would be better off dead (%)
Oral Health - Average years since last visit a dentist
Oral Health - People embarrassed because of mouth (%)
Oral Health - People with gum disease (%)
Oral Health - General health of teeth and gums (%)
Oral Health - Average days a week using dental floss/device
Oral Health - Average days a week using mouthwash for dental problem
Oral Health - Average number of teeth
Pesticide Use - Households using pesticides to control insects (%)
Pesticide Use - Households using pesticides to kill weeds (%)
Physical Activity - People doing vigorous-intensity work activities (%)
Physical Activity - People doing moderate-intensity work activities (%)
Physical Activity - People walking or bicycling (%)
Physical Activity - People doing vigorous-intensity recreational activities (%)
Physical Activity - People doing moderate-intensity recreational activities (%)
Physical Activity - Average hours a day doing sedentary activities
Physical Activity - Average hours a day watching TV or videos
Physical Activity - Average hours a day using computer
Physical Functioning - People having limitations keeping them from working (%)
Physical Functioning - People limited in amount of work they can do (%)
Physical Functioning - People that need special equipment to walk (%)
Physical Functioning - People experiencing confusion/memory problems (%)
Physical Functioning - People requiring special healthcare equipment (%)
Prescription Medications - Average number of prescription medicines taking
Preventive Aspirin Use - Adults 40+ taking low-dose aspirin (%)
Reproductive Health - Vaginal deliveries (%)
Reproductive Health - Cesarean deliveries (%)
Reproductive Health - Deliveries resulted in a live birth (%)
Reproductive Health - Pregnancies resulted in a delivery (%)
Reproductive Health - Women breastfeeding newborns (%)
Reproductive Health - Women that had a hysterectomy (%)
Reproductive Health - Women that had both ovaries removed (%)
Reproductive Health - Women that have ever taken birth control pills (%)
Reproductive Health - Women taking birth control pills (%)
Reproductive Health - Women that have ever used Depo-Provera or injectables (%)
Reproductive Health - Women that have ever used female hormones (%)
Sexual Behavior - People 18+ that ever had sex (vaginal, anal, or oral) (%)
Sexual Behavior - Males 18+ that ever had vaginal sex with a woman (%)
Sexual Behavior - Males 18+ that ever performed oral sex on a woman (%)
Sexual Behavior - Males 18+ that ever had anal sex with a woman (%)
Sexual Behavior - Males 18+ that ever had any sex with a man (%)
Sexual Behavior - Females 18+ that ever had vaginal sex with a man (%)
Sexual Behavior - Females 18+ that ever performed oral sex on a man (%)
Sexual Behavior - Females 18+ that ever had anal sex with a man (%)
Sexual Behavior - Females 18+ that ever had any kind of sex with a woman (%)
Sexual Behavior - Average age people first had sex
Sexual Behavior - Average number of female sex partners in lifetime (males 18+)
Sexual Behavior - Average number of female vaginal sex partners in lifetime (males 18+)
Sexual Behavior - Average age people first performed oral sex on a woman (18+)
Sexual Behavior - Average number of woman performed oral sex on in lifetime (18+)
Sexual Behavior - Average number of male sex partners in lifetime (males 18+)
Sexual Behavior - Average number of male anal sex partners in lifetime (males 18+)
Sexual Behavior - Average age people first performed oral sex on a man (18+)
Sexual Behavior - Average number of male oral sex partners in lifetime (18+)
Sexual Behavior - People using protection when performing oral sex (%)
Sexual Behavior - Average number of times people have vaginal or anal sex a year
Sexual Behavior - People having sex without condom (%)
Sexual Behavior - Average number of male sex partners in lifetime (females 18+)
Sexual Behavior - Average number of male vaginal sex partners in lifetime (females 18+)
Sexual Behavior - Average number of female sex partners in lifetime (females 18+)
Sexual Behavior - Circumcised males 18+ (%)
Sleep Disorders - Average hours sleeping at night
Sleep Disorders - People that has trouble sleeping (%)
Smoking-Cigarette Use - People smoking cigarettes (%)
Taste & Smell - People 40+ having problems with smell (%)
Taste & Smell - People 40+ having problems with taste (%)
Taste & Smell - People 40+ that ever had wisdom teeth removed (%)
Taste & Smell - People 40+ that ever had tonsils teeth removed (%)
Taste & Smell - People 40+ that ever had a loss of consciousness because of a head injury (%)
Taste & Smell - People 40+ that ever had a broken nose or other serious injury to face or skull (%)
Taste & Smell - People 40+ that ever had two or more sinus infections (%)
Weight - Average height (inches)
Weight - Average weight (pounds)
Weight - Average BMI
Weight - People that are obese (%)
Weight - People that ever were obese (%)
Weight - People trying to lose weight (%)
100%
urban population.
Estimated median house/condo value in 2022: $67,078
53206:
$67,078Wisconsin:
$252,800
Median resident age: This zip code:
31.6 yearsWisconsin median age:
40.4 years
Average household size: This zip code:
2.6 peopleWisconsin:
2.3 people
Averages for the 2020 tax year for zip code 53206, filed in 2021:
Average Adjusted Gross Income (AGI) in 2020: $24,021 (Individual Income Tax Returns) Here:
$24,021State:
$72,319
Salary/wage: $22,539 (reported on 86.2% of returns )Here:
$22,539State:
$59,242
(% of AGI for various income ranges: 1125.4% for AGIs below $25k , 3997.7% for AGIs $25k-50k , 8384.3% for AGIs $50k-75k , 12002.9% for AGIs $75k-100k , 18837.5% for AGIs $100k-200k ) Taxable interest for individuals: $134 (reported on 6.0% of returns )This zip code:
$134Wisconsin:
$1,431
(% of AGI for various income ranges: 0.5% for AGIs below $25k , 1.3% for AGIs $25k-50k , 4.6% for AGIs $50k-75k , 12.5% for AGIs $100k-200k ) Ordinary dividends: $641 (reported on 1.9% of returns )(% of AGI for various income ranges: 0.7% for AGIs below $25k , 1.5% for AGIs $25k-50k , 4.3% for AGIs $50k-75k , 50.0% for AGIs $75k-100k ) Net capital gain/loss in AGI: +$1,567 (reported on 1.0% of returns )Here:
+$1,567State:
+$18,329
(% of AGI for various income ranges: 0.3% for AGIs below $25k , 0.6% for AGIs $25k-50k , 32.9% for AGIs $50k-75k ) Profit/loss from business: +$6,755 (reported on 12.7% of returns )Here:
+$6,755State:
+$14,562
(% of AGI for various income ranges: 127.3% for AGIs below $25k , 23.3% for AGIs $25k-50k , 90.3% for AGIs $50k-75k , 1355.7% for AGIs $75k-100k ) Taxable individual retirement arrangement distribution: $9,153 (reported on 1.7% of returns )53206:
$9,153Wisconsin:
$19,348
(% of AGI for various income ranges: 8.3% for AGIs below $25k , 16.5% for AGIs $25k-50k , 194.9% for AGIs $50k-75k ) Total itemized deductions: $23,973 (reported on 1.2% of returns )Here:
$23,973State:
$33,000
(% of AGI for various income ranges: 5.9% for AGIs below $25k , 47.5% for AGIs $25k-50k , 195.1% for AGIs $50k-75k , 1142.9% for AGIs $75k-100k ) Charity contributions: $10,700 (reported on 0.8% of returns )Here:
$10,700State:
$12,044
(% of AGI for various income ranges: 14.8% for AGIs $25k-50k , 48.0% for AGIs $50k-75k , 435.7% for AGIs $75k-100k ) Taxes paid: $3,482 (reported on 1.2% of returns )(% of AGI for various income ranges: 0.4% for AGIs below $25k , 4.8% for AGIs $25k-50k , 32.9% for AGIs $50k-75k , 227.1% for AGIs $75k-100k ) Earned income credit: $3,060 (reported on 49.6% of returns )(% of AGI for various income ranges: 231.6% for AGIs below $25k , 146.5% for AGIs $25k-50k ) Percentage of individuals using paid preparers for their 2020 taxes: 92.3%(% for various income ranges: 93.2% for AGIs below $25k , 91.4% for AGIs $25k-50k , 88.3% for AGIs $50k-75k , 92.3% for AGIs $75k-100k , 90.0% for AGIs $100k-200k )
Averages for the 2012 tax year for zip code 53206, filed in 2013:
Average Adjusted Gross Income (AGI) in 2012: $20,501 (Individual Income Tax Returns) Here:
$20,501State:
$57,939
Salary/wage: $19,122 (reported on 83.0% of returns )Here:
$19,122State:
$48,248
(% of AGI for various income ranges: 72.2% for AGIs below $25k , 87.9% for AGIs $25k-50k , 78.1% for AGIs $50k-75k , 77.4% for AGIs $75k-100k , 54.7% for AGIs $100k-200k ) Taxable interest for individuals: $245 (reported on 7.1% of returns )This zip code:
$245Wisconsin:
$1,224
(% of AGI for various income ranges: ) Ordinary dividends: $796 (reported on 2.4% of returns )(% of AGI for various income ranges: 0.1% for AGIs below $25k ) Net capital gain/loss in AGI: +$450 (reported on 0.8% of returns )Profit/loss from business: +$9,934 (reported on 17.3% of returns )Here:
+$9,934State:
+$11,943
(% of AGI for various income ranges: 16.5% for AGIs below $25k , 0.7% for AGIs $25k-50k , 0.8% for AGIs $50k-75k , 11.4% for AGIs $75k-100k ) Taxable individual retirement arrangement distribution: $6,614 (reported on 2.9% of returns )53206:
$6,614Wisconsin:
$14,087
(% of AGI for various income ranges: 0.6% for AGIs below $25k , 0.9% for AGIs $25k-50k , 3.1% for AGIs $50k-75k ) Total itemized deductions: $14,789 (29% of AGI, reported on 6.8% of returns )Here:
$14,789State:
$22,257
Here:
28.9% of AGIState:
20.1% of AGI
(% of AGI for various income ranges: 1.9% for AGIs below $25k , 4.9% for AGIs $25k-50k , 9.1% for AGIs $50k-75k , 11.9% for AGIs $75k-100k , 15.6% for AGIs $100k-200k ) Charity contributions: $4,751 (reported on 5.5% of returns )(% of AGI for various income ranges: 0.3% for AGIs below $25k , 1.1% for AGIs $25k-50k , 2.2% for AGIs $50k-75k , 4.0% for AGIs $75k-100k , 6.0% for AGIs $100k-200k ) Taxes paid: $4,523 (reported on 6.7% of returns )53206:
$4,523State:
$10,731
(% of AGI for various income ranges: 0.4% for AGIs below $25k , 1.5% for AGIs $25k-50k , 2.9% for AGIs $50k-75k , 4.0% for AGIs $75k-100k , 5.3% for AGIs $100k-200k ) Earned income credit: $3,115 (reported on 57.4% of returns )(% of AGI for various income ranges: 17.6% for AGIs below $25k , 2.2% for AGIs $25k-50k ) Percentage of individuals using paid preparers for their 2012 taxes: 40.6%(% for various income ranges: 40.0% for AGIs below $25k , 39.4% for AGIs $25k-50k , 50.0% for AGIs $50k-75k , 58.3% for AGIs $75k-100k , 57.1% for AGIs $100k-200k )
Averages for the 2004 tax year for zip code 53206, filed in 2005:
Average Adjusted Gross Income (AGI) in 2004: $19,493 (Individual Income Tax Returns) Here:
$19,493State:
$47,735
Salary/wage: $18,451 (reported on 88.8% of returns )Here:
$18,451State:
$41,540
(% of AGI for various income ranges: 80.6% for AGIs below $10k , 84.4% for AGIs $10k-25k , 88.9% for AGIs $25k-50k , 83.0% for AGIs $50k-75k , 78.9% for AGIs $75k-100k , 44.9% for AGIs over 100k ) Taxable interest for individuals: $432 (reported on 12.4% of returns )This zip code:
$432Wisconsin:
$1,420
(% of AGI for various income ranges: 0.3% for AGIs below $10k , 0.4% for AGIs $10k-25k , 0.2% for AGIs $25k-50k , 0.3% for AGIs $50k-75k , 0.2% for AGIs $75k-100k , 0.2% for AGIs over 100k ) Taxable dividends: $590 (reported on 3.6% of returns )(% of AGI for various income ranges: 0.1% for AGIs below $10k , 0.1% for AGIs $10k-25k , 0.1% for AGIs $25k-50k , 0.1% for AGIs $50k-75k , 0.1% for AGIs $75k-100k , 0.0% for AGIs over 100k ) Net capital gain/loss: +$4,847 (reported on 1.9% of returns )Here:
+$4,847State:
+$9,569
(% of AGI for various income ranges: 0.0% for AGIs below $10k , 0.1% for AGIs $10k-25k , 0.4% for AGIs $25k-50k , 1.0% for AGIs $50k-75k , 2.9% for AGIs $75k-100k ) Profit/loss from business: +$6,800 (reported on 7.6% of returns )Here:
+$6,800State:
+$10,417
(% of AGI for various income ranges: 8.1% for AGIs below $10k , 3.8% for AGIs $10k-25k , 1.0% for AGIs $25k-50k , 1.3% for AGIs $50k-75k , 1.3% for AGIs $75k-100k ) IRA payment deduction: $920 (reported on 0.5% of returns )53206:
$920Wisconsin:
$2,900
Total itemized deductions: $12,213 (26% of AGI, reported on 7.9% of returns )Here:
$12,213State:
$18,160
Here:
26.4% of AGIState:
21.1% of AGI
(% of AGI for various income ranges: 2.0% for AGIs below $10k , 2.4% for AGIs $10k-25k , 5.1% for AGIs $25k-50k , 9.6% for AGIs $50k-75k , 10.7% for AGIs $75k-100k , 11.6% for AGIs over 100k ) Charity contributions deductions: $3,762 (8% of AGI, reported on 6.8% of returns )Here:
7.7% of AGIState:
3.0% of AGI
(% of AGI for various income ranges: 0.2% for AGIs below $10k , 0.5% for AGIs $10k-25k , 1.4% for AGIs $25k-50k , 2.9% for AGIs $50k-75k , 3.2% for AGIs $75k-100k , 2.5% for AGIs over 100k ) Total tax: $2,320 (reported on 45.5% of returns )(% of AGI for various income ranges: 1.7% for AGIs below $10k , 2.5% for AGIs $10k-25k , 5.9% for AGIs $25k-50k , 9.7% for AGIs $50k-75k , 11.6% for AGIs $75k-100k , 15.1% for AGIs over 100k ) Earned income credit: $2,066 (reported on 53.7% of returns )Percentage of individuals using paid preparers for their 2004 taxes: 70.5%(% for various income ranges: 72.0% for AGIs below $10k , 73.6% for AGIs $10k-25k , 63.8% for AGIs $25k-50k , 61.8% for AGIs $50k-75k , 67.5% for AGIs $75k-100k , 74.2% for AGIs over 100k )
Estimated median household income in 2022: This zip code:
$26,907Wisconsin:
$70,996
Nearest zip codes: 53205 ,
53212 ,
53233 ,
53210 ,
53203 ,
53208 .
Milwaukee Zip Code Map
Percentage of family households: This zip code:
43.5%Wisconsin:
43.1%
Percentage of households with unmarried partners: This zip code:
11.3%Wisconsin:
47.0%
Likely homosexual households (counted as self-reported same-sex unmarried-partner households)
Lesbian couples: 0.0% of all households Gay men: 0.1% of all households
Household received Food Stamps/SNAP in the past 12 months: 4,685Household did not receive Food Stamps/SNAP in the past 12 months: 3,681
Women who had a birth in the past 12 months: 294 (65 now married , 226 unmarried) Women who did not have a birth in the past 12 months: 5,144 (429 now married , 4,714 unmarried)
Housing units in zip code 53206 with a mortgage: 916 (77
second mortgage , 18
home equity loan , 50
both second mortgage and home equity loan )
Houses without a mortgage: 22
Median monthly owner costs for units with a mortgage: $1,075
Median monthly owner costs for units without a mortgage: $425
Residents with income below the poverty level in 2022:
This zip code:
39.7%Whole state:
10.7%
Residents with income below 50% of the poverty level in 2022:
This zip code:
23.3%Whole state:
5.7%
Median number of rooms in houses and condos: Median number of rooms in apartments: Notable locations in this zip code not listed on our city pages
Click to draw/clear zip code borders Notable locations in zip code 53206: (A) , Hillcrest Nursing Home (B) . Display/hide their locations on the map
Churches in zip code 53206 include: (A) , Saint Georges Episcopal Church (B) , North Shore Congregation Kingdom Hall of Jehovahs Witnesses (C) , First Psychic Science Church (D) , Gospel Evangelical Lutheran Church (E) , Gospel Truth Hall (F) , Grace Evangelical Church (G) , Saint Boniface Roman Catholic Church (H) , Greater Galilee Baptist Church (I) . Display/hide their locations on the map
Cemetery: (1) . Display/hide its location on the map
Parks in zip code 53206 include: (1) , Columbia Park (2) , Moody Park (3) , Lindbergh Park (4) . Display/hide their locations on the map
Tourist attraction (not listed on the city page) :
Year house built (houses)
5 2020 or later330 2010 to 2019257 2000 to 2009180 1990 to 1999155 1980 to 1989222 1970 to 1979465 1960 to 1969717 1950 to 19591,054 1940 to 19496,804 1939 or earlier
Zip code 53206 household income distribution in 2022 1,160 Less than $10,0001,314 $10,000 to $14,999618 $15,000 to $19,999701 $20,000 to $24,999435 $25,000 to $29,999601 $30,000 to $34,999437 $35,000 to $39,999472 $40,000 to $44,999276 $45,000 to $49,999342 $50,000 to $59,999725 $60,000 to $74,999459 $75,000 to $99,999269 $100,000 to $124,999116 $125,000 to $149,999106 $150,000 to $199,999101 $200,000 or moreEstimate of home value of owner-occupied houses/condos in 2022 in zip code 53206 49 Less than $10,00032 $10,000 to $14,999119 $15,000 to $19,999116 $20,000 to $24,99984 $25,000 to $29,999172 $30,000 to $34,999133 $35,000 to $39,999305 $40,000 to $49,999162 $50,000 to $59,999152 $60,000 to $69,999343 $70,000 to $79,999144 $80,000 to $89,999123 $90,000 to $99,999151 $100,000 to $124,99947 $125,000 to $149,999112 $150,000 to $174,99934 $175,000 to $199,99916 $200,000 to $249,99919 $250,000 to $299,99938 $300,000 to $399,99912 $400,000 to $499,99921 $500,000 to $749,999Rent paid by renters in 2022 in zip code 53206 14 Less than $10040 $150 to $19941 $200 to $24989 $250 to $29932 $300 to $34978 $350 to $39963 $400 to $44994 $450 to $499415 $500 to $549480 $550 to $599521 $600 to $649504 $650 to $699582 $700 to $749442 $750 to $799732 $800 to $899274 $900 to $999451 $1,000 to $1,249111 $1,250 to $1,49911 $1,500 to $1,999263 No cash rent
Median gross rent in 2022: $936.
Median price asked for vacant for-sale houses and condos in 2022: $184,143.
Estimated median house (or condo) value in 2022 for: White Non-Hispanic householders: $102,014Black or African American householders: $66,878American Indian or Alaska Native householders: $69,473Asian householders: $128,566Some other race householders: $169,692Two or more races householders: $181,071Hispanic or Latino householders: $161,706Estimated median house or condo value in 2022: $67,078
53206:
$67,078Wisconsin:
$252,800
Lower value quartile - upper value quartile: $41,931 - $97,996
Mean price in 2022: Detached houses: $94,028Here:
$94,028State:
$308,468
Townhouses or other attached units: $226,143Here:
$226,143State:
$265,873
In 2-unit structures: $175,021Here:
$175,021State:
$203,667
Housing units in structures:
One, detached: 4,265One, attached: 518Two: 4,0903 or 4: 4135 to 9: 24910 to 19: 31220 to 49: 8650 or more: 89Mobile homes: 23Unemployment : 7.9%
Means of transportation to work in zip code 53206 61.5% 4,217 Drove a car alone13.2% 905 Carpooled12.6% 865 Bus or trolley bus0.1% 8 Taxi0.2% 11 Bicycle0.8% 53 Walked0.4% 28 Other means9.2% 628 Worked at homeTravel time to work (commute) in zip code 53206 26 Less than 5 minutes356 5 to 9 minutes904 10 to 14 minutes951 15 to 19 minutes1,269 20 to 24 minutes304 25 to 29 minutes1,089 30 to 34 minutes154 35 to 39 minutes262 40 to 44 minutes282 45 to 59 minutes325 60 to 89 minutes232 90 or more minutes
Neighborhoods in zip code 53206: Percentage of zip code residents living and working in this county: 89.3%
Household type by relationship:
Households: 20,517
Male householders: 2,571 (1,398 living alone ), Female householders: 5,368 (1,498 living alone )783 spouses (769 opposite-sex spouses ), 595 unmarried partners , (564 opposite-sex unmarried partners ), 7,663 children (7,460 natural , 27 adopted , 161 stepchildren ), 823 grandchildren , 791 brothers or sisters , 229 parents , 103 foster children , 696 other relatives , 555 non-relatives In group quarters: 133 (-1 institutionalized population )
Size of family households: 1,630 2-persons , 1,261 3-persons , 792 4-persons , 509 5-persons , 184 6-persons , 215 7-or-more-persons
Size of nonfamily households: 2,895 1-person , 358 2-persons , 45 3-persons
459 married couples with children. single-parent households (516 men , 4,311 women ).
96.1% of residents of 53206 zip code speak English at home. of residents speak Spanish at home (70% very well, 10% well, 20% not well ).of residents speak other Indo-European language at home (88% very well, 12% well ).of residents speak Asian or Pacific Island language at home (79% very well, 21% well ).of residents speak other language at home (100% very well ).
Foreign born population: 187 (0.9%)
(68.1%
of them are naturalized citizens )
This zip code:
0.9%Whole state:
5.0%
26% Kenya 19% Honduras 18% Indonesia 16% Haiti 4% United Kingdom, excluding England and Scotland 3% Sweden 2% Cabo Verde 1% American 1% African 0% German 0% Greek 0% Jamaican 0% West Indian 0% Irish
Year of entry for the foreign-born population
151 2010 or later 80 2000 to 2009 61 1990 to 1999 53 Before 1990
There are
46 Medical Specialists in Zip Code 53206 .
Facilities with environmental interests located in this zip code:
CITGO #225 (905 W CENTER ST in MILWAUKEE, WI)
AIR MINOR (AIRS/AFS) Small Quantity Generators, between 100 kg and 1000 kg of hazardous waste/month (Resource Conservation and Recovery Act (tracking hazardous waste)) - notification STATE MASTER (Wisconsin database) - RCRAINFO-WID988568044, CESQG Business SIC classification: GASOLINE SERVICE STATIONSOrganizations: BULK PETROLEUM CORP (CONTACT/OWNER)
Alternative names: DARSHANS GAS INCORPORATED
CAPITOL& TEUTONIA PARTNERSHIP (3975 N TEUTONIA AVE in MILWAUKEE, WI)
Conditionally Exempt Small Quantity Generators, less than 100 kg/month of hazardous waste (Resource Conservation and Recovery Act (tracking hazardous waste)) - notification STATE MASTER (Wisconsin database) - RCRAINFO-WI0000004853, CESQG Organizations: CAPITOL AND TEUTONIA PARTNERSHI (CONTACT/OWNER)
CITGO #223 (1909 WEST HOPKINS STREET in MILWAUKEE, WI)
Small Quantity Generators, between 100 kg and 1000 kg of hazardous waste/month (Resource Conservation and Recovery Act (tracking hazardous waste)) - notification STATE MASTER (Wisconsin database) - RCRAINFO-WIR000034934, CESQG Organizations: DARSHAN S DHALIWAL (CONTACT/OWNER)
CLARK OIL STATION NO 26 (2308 N TEUTONIA RD in MILWAUKEE, WI)
Small Quantity Generators, between 100 kg and 1000 kg of hazardous waste/month (Resource Conservation and Recovery Act (tracking hazardous waste)) - notification Organizations: CLARK OIL AND REFINING CORP (CONTACT/OWNER)
Housing units lacking complete plumbing facilities: 3.7%
Housing units lacking complete kitchen facilities: 12.7%
89.1% Utility gas 8.6% Electricity 0.7% Bottled, tank, or LP gas 0.7% Fuel oil, kerosene, etc. 0.6% No fuel used
Population in 1990: 42,009.
Place of birth for U.S.-born residents:
This state: 14,460Northeast: 83Midwest: 2,572South: 2,824West: 241
54% of the 53206 zip code residents lived in the same house 5 years ago.
Out of people who lived in different houses, 88% lived in this county.
Out of people who lived in different counties, 50% lived in Wisconsin.
89% of the 53206 zip code residents lived in the same house 1 year ago.
Out of people who lived in different houses, 75% moved from this county.
Out of people who lived in different houses, 4% moved from different county within same state.
Out of people who lived in different houses, 15% moved from different state.
Out of people who lived in different houses, 1% moved from abroad.
Private vs. public school enrollment:
Students in private schools in grades 1 to 8 (elementary and middle school): 714
Here:
21.2%Wisconsin:
16.7%
Students in private schools in grades 9 to 12 (high school): 197
Here:
14.8%Wisconsin:
12.5%
Students in private undergraduate colleges: 176
Here:
44.0%Wisconsin:
17.5%
Occupation by median earnings in the past 12 months ($)
94,443 Architecture and engineering occupations 90,743 Computer and mathematical occupations 57,607 Installation, maintenance, and repair occupations 53,209 Business and financial operations occupations 51,848 Community and social service occupations 50,913 Health diagnosing and treating practitioners and other technical occupations
Companies with federal contracts located in this zip code:
CARTER, WILLIE (3842 N 25TH ST in MILWAUKEE, WI; small business)
$54,828 with Navy for Plumbing Fixtures and Accessories. Taking place in OK. Signed on 2003-08-14. Completion date: 2003-09-10.
Top industries in this zip code by the number of employees in 2005:
Educational Services: Elementary and Secondary Schools (100-249 employees: 1 establishment, 20-49 employees: 3 establishments, 10-19 employees: 1 establishment, 1-4 employees: 2 establishments)Health Care and Social Assistance: Child Day Care Services (20-49: 1, 10-19: 3, 5-9: 6, 1-4: 38)Other Services (except Public Administration): Religious Organizations (20-49: 1, 10-19: 3, 5-9: 5, 1-4: 5)Other Services (except Public Administration): Civic and Social Organizations (20-49: 2, 10-19: 1, 1-4: 1)Management of Companies and Enterprises: Corporate, Subsidiary, and Regional Managing Offices (50-99: 1)Health Care and Social Assistance: Nursing Care Facilities (50-99: 1)Health Care and Social Assistance: Emergency and Other Relief Services (50-99: 1)Health Care and Social Assistance: Blood and Organ Banks (20-49: 1, 1-4: 1)
People in group quarters in 2010:
99 people in other noninstitutional facilities
42 people in nursing facilities/skilled-nursing facilities
39 people in correctional residential facilities
34 people in emergency and transitional shelters (with sleeping facilities) for people experiencing homelessness
19 people in group homes for juveniles (non-correctional)
10 people in group homes intended for adults
8 people in residential treatment centers for adults
4 people in residential treatment centers for juveniles (non-correctional)
People in group quarters in 2000:
120 people in other noninstitutional group quarters
9 people in homes or halfway houses for drug/alcohol abuse
3 people in homes for the mentally ill
Fatal accident statistics in 2014:
Fatal accident count: 2Vehicles involved in fatal accidents: 4Fatal accidents caused by drunken drivers: 0Fatalities: 2Persons involved in fatal accidents: 4Pedestrians involved in fatal accidents: 1
Fatal accident statistics in 2013:
Fatal accident count: 3Vehicles involved in fatal accidents: 5Fatal accidents caused by drunken drivers: 1Fatalities: 4Persons involved in fatal accidents: 6Pedestrians involved in fatal accidents: 0
Home Mortgage Disclosure Act Aggregated Statistics For Year 2009(Based on 8 full and 24 partial tracts) A) FHA, FSA/RHS & VA B) Conventional C) Refinancings D) Home Improvement Loans E) Loans on Dwellings For 5+ Families F) Non-occupant Loans on G) Loans On Manufactured Number Average Value Number Average Value Number Average Value Number Average Value Number Average Value Number Average Value Number Average Value
LOANS ORIGINATED 6 $71,483 36 $55,525 131 $70,689 28 $28,171 4 $348,460 73 $55,667 0 $0 APPLICATIONS APPROVED, NOT ACCEPTED 1 $56,220 1 $28,860 35 $73,079 1 $15,000 0 $0 3 $58,847 0 $0 APPLICATIONS DENIED 11 $72,258 29 $48,961 219 $76,101 88 $29,940 0 $0 50 $50,776 2 $31,520 APPLICATIONS WITHDRAWN 2 $59,680 4 $110,532 73 $78,956 9 $22,310 0 $0 5 $67,508 0 $0 FILES CLOSED FOR INCOMPLETENESS 1 $171,620 1 $33,290 22 $84,646 5 $33,244 0 $0 7 $59,386 0 $0
Aggregated Statistics For Year 2008(Based on 8 full and 24 partial tracts) A) FHA, FSA/RHS & VA B) Conventional C) Refinancings D) Home Improvement Loans E) Loans on Dwellings For 5+ Families F) Non-occupant Loans on G) Loans On Manufactured Number Average Value Number Average Value Number Average Value Number Average Value Number Average Value Number Average Value Number Average Value
LOANS ORIGINATED 32 $90,262 110 $72,653 271 $74,421 55 $39,457 8 $433,498 180 $67,480 0 $0 APPLICATIONS APPROVED, NOT ACCEPTED 5 $56,392 37 $84,898 62 $59,121 15 $31,342 1 $18,910 48 $66,532 0 $0 APPLICATIONS DENIED 22 $90,056 108 $75,907 497 $82,270 137 $52,192 0 $0 131 $83,568 1 $33,450 APPLICATIONS WITHDRAWN 4 $48,070 33 $77,054 172 $86,797 14 $71,879 0 $0 47 $67,169 0 $0 FILES CLOSED FOR INCOMPLETENESS 3 $88,087 16 $75,918 60 $79,987 11 $25,473 0 $0 16 $68,056 0 $0
Aggregated Statistics For Year 2007(Based on 8 full and 24 partial tracts) A) FHA, FSA/RHS & VA B) Conventional C) Refinancings D) Home Improvement Loans E) Loans on Dwellings For 5+ Families F) Non-occupant Loans on G) Loans On Manufactured Number Average Value Number Average Value Number Average Value Number Average Value Number Average Value Number Average Value Number Average Value
LOANS ORIGINATED 22 $92,187 377 $75,568 722 $74,395 114 $50,082 17 $417,125 529 $68,881 0 $0 APPLICATIONS APPROVED, NOT ACCEPTED 1 $50,000 126 $78,847 202 $74,318 17 $39,056 0 $0 132 $74,300 0 $0 APPLICATIONS DENIED 7 $81,809 421 $78,803 1,058 $81,863 214 $45,462 7 $491,013 515 $74,642 4 $37,412 APPLICATIONS WITHDRAWN 3 $135,147 59 $86,251 325 $87,955 29 $63,781 3 $829,993 70 $87,442 1 $68,620 FILES CLOSED FOR INCOMPLETENESS 1 $107,630 39 $90,510 164 $84,276 9 $48,253 0 $0 63 $75,741 0 $0
Aggregated Statistics For Year 2006(Based on 8 full and 24 partial tracts) A) FHA, FSA/RHS & VA B) Conventional C) Refinancings D) Home Improvement Loans E) Loans on Dwellings For 5+ Families F) Non-occupant Loans on G) Loans On Manufactured Number Average Value Number Average Value Number Average Value Number Average Value Number Average Value Number Average Value Number Average Value
LOANS ORIGINATED 26 $86,505 795 $70,416 1,067 $70,532 147 $44,427 12 $230,152 825 $65,067 2 $42,905 APPLICATIONS APPROVED, NOT ACCEPTED 3 $111,360 304 $71,971 292 $76,662 25 $65,625 0 $0 230 $71,634 0 $0 APPLICATIONS DENIED 4 $95,255 626 $71,419 1,107 $76,158 242 $45,170 0 $0 545 $71,000 7 $50,950 APPLICATIONS WITHDRAWN 2 $68,395 271 $75,283 444 $77,563 21 $54,978 2 $79,800 246 $67,819 0 $0 FILES CLOSED FOR INCOMPLETENESS 0 $0 39 $77,377 115 $77,367 6 $49,385 0 $0 33 $63,742 0 $0
Aggregated Statistics For Year 2005(Based on 8 full and 24 partial tracts) A) FHA, FSA/RHS & VA B) Conventional C) Refinancings D) Home Improvement Loans E) Loans on Dwellings For 5+ Families F) Non-occupant Loans on G) Loans On Manufactured Number Average Value Number Average Value Number Average Value Number Average Value Number Average Value Number Average Value Number Average Value
LOANS ORIGINATED 10 $80,032 753 $57,086 933 $61,388 132 $40,999 35 $213,119 848 $57,033 3 $162,687 APPLICATIONS APPROVED, NOT ACCEPTED 1 $141,920 205 $55,545 221 $63,702 30 $30,156 0 $0 131 $62,411 0 $0 APPLICATIONS DENIED 4 $69,330 452 $57,922 1,087 $66,741 172 $34,239 1 $179,800 380 $58,649 0 $0 APPLICATIONS WITHDRAWN 6 $76,635 228 $66,647 532 $72,479 56 $83,276 2 $170,395 211 $65,340 0 $0 FILES CLOSED FOR INCOMPLETENESS 2 $61,630 46 $63,637 147 $76,586 3 $32,687 1 $263,410 46 $57,783 0 $0
Aggregated Statistics For Year 2004(Based on 8 full and 24 partial tracts) A) FHA, FSA/RHS & VA B) Conventional C) Refinancings D) Home Improvement Loans E) Loans on Dwellings For 5+ Families F) Non-occupant Loans on G) Loans On Manufactured Number Average Value Number Average Value Number Average Value Number Average Value Number Average Value Number Average Value Number Average Value
LOANS ORIGINATED 26 $69,539 483 $49,787 837 $53,419 133 $37,537 30 $223,216 595 $47,480 2 $39,760 APPLICATIONS APPROVED, NOT ACCEPTED 2 $68,910 130 $52,961 215 $55,292 24 $25,449 2 $113,750 112 $49,627 2 $53,675 APPLICATIONS DENIED 4 $76,772 273 $54,181 920 $54,326 168 $23,815 2 $143,685 242 $49,975 2 $21,820 APPLICATIONS WITHDRAWN 4 $57,665 71 $58,178 266 $57,265 18 $17,223 2 $55,305 40 $52,389 0 $0 FILES CLOSED FOR INCOMPLETENESS 0 $0 15 $45,228 81 $63,563 1 $10,000 0 $0 13 $52,558 0 $0
Aggregated Statistics For Year 2003(Based on 8 full and 24 partial tracts) A) FHA, FSA/RHS & VA B) Conventional C) Refinancings D) Home Improvement Loans E) Loans on Dwellings For 5+ Families F) Non-occupant Loans on Number Average Value Number Average Value Number Average Value Number Average Value Number Average Value Number Average Value
LOANS ORIGINATED 12 $59,665 254 $40,835 569 $48,639 81 $15,539 12 $205,070 360 $40,389 APPLICATIONS APPROVED, NOT ACCEPTED 1 $66,530 49 $52,893 137 $44,868 13 $15,965 2 $212,965 46 $46,228 APPLICATIONS DENIED 0 $0 150 $46,141 662 $46,468 131 $19,193 2 $104,770 169 $40,426 APPLICATIONS WITHDRAWN 3 $34,663 69 $52,641 210 $53,792 10 $34,313 0 $0 39 $43,673 FILES CLOSED FOR INCOMPLETENESS 0 $0 15 $48,639 31 $43,286 1 $41,740 0 $0 7 $35,776
Aggregated Statistics For Year 2002(Based on 8 full and 24 partial tracts) A) FHA, FSA/RHS & VA B) Conventional C) Refinancings D) Home Improvement Loans E) Loans on Dwellings For 5+ Families F) Non-occupant Loans on Number Average Value Number Average Value Number Average Value Number Average Value Number Average Value Number Average Value
LOANS ORIGINATED 27 $50,983 194 $40,651 413 $42,414 91 $12,924 15 $103,758 213 $35,855 APPLICATIONS APPROVED, NOT ACCEPTED 0 $0 59 $38,097 134 $42,547 13 $14,631 1 $53,940 51 $36,020 APPLICATIONS DENIED 10 $42,972 136 $42,370 591 $45,337 155 $12,373 0 $0 129 $36,035 APPLICATIONS WITHDRAWN 4 $41,510 62 $52,038 173 $42,921 19 $19,352 0 $0 46 $38,950 FILES CLOSED FOR INCOMPLETENESS 1 $114,900 9 $52,337 26 $41,370 0 $0 0 $0 5 $38,914
Aggregated Statistics For Year 2001(Based on 8 full and 24 partial tracts) A) FHA, FSA/RHS & VA B) Conventional C) Refinancings D) Home Improvement Loans E) Loans on Dwellings For 5+ Families F) Non-occupant Loans on Number Average Value Number Average Value Number Average Value Number Average Value Number Average Value Number Average Value
LOANS ORIGINATED 20 $40,262 177 $35,888 378 $38,831 96 $13,024 4 $123,525 164 $30,888 APPLICATIONS APPROVED, NOT ACCEPTED 3 $58,817 43 $42,363 140 $38,416 14 $16,769 1 $112,380 32 $34,838 APPLICATIONS DENIED 0 $0 159 $37,380 800 $37,592 248 $13,637 2 $131,710 134 $31,095 APPLICATIONS WITHDRAWN 10 $38,715 41 $43,897 394 $40,140 34 $19,697 1 $27,170 30 $34,640 FILES CLOSED FOR INCOMPLETENESS 3 $45,980 11 $31,430 48 $38,829 5 $23,766 0 $0 8 $36,709
Aggregated Statistics For Year 2000(Based on 8 full and 24 partial tracts) A) FHA, FSA/RHS & VA B) Conventional C) Refinancings D) Home Improvement Loans E) Loans on Dwellings For 5+ Families F) Non-occupant Loans on Number Average Value Number Average Value Number Average Value Number Average Value Number Average Value Number Average Value
LOANS ORIGINATED 11 $44,107 226 $34,358 427 $33,401 113 $12,854 8 $90,209 181 $29,075 APPLICATIONS APPROVED, NOT ACCEPTED 2 $50,890 35 $35,845 167 $33,867 28 $11,706 0 $0 36 $29,811 APPLICATIONS DENIED 8 $37,931 146 $38,485 659 $37,584 262 $17,392 3 $782,833 133 $33,309 APPLICATIONS WITHDRAWN 5 $51,328 44 $33,120 228 $34,072 23 $20,972 1 $1,618,200 35 $28,429 FILES CLOSED FOR INCOMPLETENESS 5 $40,240 22 $38,205 94 $52,746 6 $21,082 0 $0 16 $65,619
Aggregated Statistics For Year 1999(Based on 6 full and 12 partial tracts) A) FHA, FSA/RHS & VA B) Conventional C) Refinancings D) Home Improvement Loans E) Loans on Dwellings For 5+ Families F) Non-occupant Loans on Number Average Value Number Average Value Number Average Value Number Average Value Number Average Value Number Average Value
LOANS ORIGINATED 9 $36,366 108 $49,118 323 $31,073 68 $12,680 3 $94,560 111 $28,039 APPLICATIONS APPROVED, NOT ACCEPTED 0 $0 35 $28,431 158 $33,201 27 $11,771 0 $0 38 $26,756 APPLICATIONS DENIED 3 $33,240 91 $37,372 439 $34,931 164 $11,161 0 $0 92 $31,173 APPLICATIONS WITHDRAWN 4 $53,382 25 $36,996 202 $36,621 26 $12,493 0 $0 17 $36,733 FILES CLOSED FOR INCOMPLETENESS 0 $0 17 $32,542 85 $67,290 2 $17,000 0 $0 19 $40,378
Private Mortgage Insurance Companies Aggregated Statistics For Year 2009(Based on 1 full and 8 partial tracts) A) Conventional B) Refinancings C) Non-occupant Loans on Number Average Value Number Average Value Number Average Value
LOANS ORIGINATED 0 $0 2 $160,530 0 $0 APPLICATIONS APPROVED, NOT ACCEPTED 5 $60,076 0 $0 2 $65,850 APPLICATIONS DENIED 0 $0 0 $0 0 $0 APPLICATIONS WITHDRAWN 0 $0 0 $0 0 $0 FILES CLOSED FOR INCOMPLETENESS 1 $72,820 0 $0 0 $0
Aggregated Statistics For Year 2008(Based on 7 full and 22 partial tracts) A) Conventional B) Refinancings C) Non-occupant Loans on Number Average Value Number Average Value Number Average Value
LOANS ORIGINATED 37 $90,712 11 $91,306 7 $81,791 APPLICATIONS APPROVED, NOT ACCEPTED 43 $82,894 8 $90,938 22 $79,478 APPLICATIONS DENIED 9 $53,183 2 $89,630 6 $62,413 APPLICATIONS WITHDRAWN 2 $74,360 0 $0 2 $74,360 FILES CLOSED FOR INCOMPLETENESS 1 $49,450 0 $0 1 $49,450
Aggregated Statistics For Year 2007(Based on 8 full and 24 partial tracts) A) Conventional B) Refinancings C) Non-occupant Loans on Number Average Value Number Average Value Number Average Value
LOANS ORIGINATED 90 $80,836 52 $92,916 55 $76,684 APPLICATIONS APPROVED, NOT ACCEPTED 12 $94,976 13 $91,528 5 $81,106 APPLICATIONS DENIED 4 $109,582 2 $76,745 2 $96,395 APPLICATIONS WITHDRAWN 3 $96,017 2 $132,705 0 $0 FILES CLOSED FOR INCOMPLETENESS 1 $67,420 0 $0 0 $0
Aggregated Statistics For Year 2006(Based on 8 full and 22 partial tracts) A) Conventional B) Refinancings C) Non-occupant Loans on Number Average Value Number Average Value Number Average Value
LOANS ORIGINATED 59 $82,674 30 $89,524 35 $63,794 APPLICATIONS APPROVED, NOT ACCEPTED 11 $64,956 7 $63,666 8 $60,285 APPLICATIONS DENIED 3 $52,800 1 $74,620 3 $77,673 APPLICATIONS WITHDRAWN 3 $59,900 1 $104,640 2 $65,850 FILES CLOSED FOR INCOMPLETENESS 0 $0 0 $0 0 $0
Aggregated Statistics For Year 2005(Based on 8 full and 24 partial tracts) A) Conventional B) Refinancings C) Non-occupant Loans on Number Average Value Number Average Value Number Average Value
LOANS ORIGINATED 81 $72,753 31 $74,078 34 $53,356 APPLICATIONS APPROVED, NOT ACCEPTED 13 $54,599 2 $74,870 2 $46,000 APPLICATIONS DENIED 1 $58,380 0 $0 1 $58,380 APPLICATIONS WITHDRAWN 6 $56,570 3 $64,707 0 $0 FILES CLOSED FOR INCOMPLETENESS 0 $0 2 $59,350 2 $59,350
Aggregated Statistics For Year 2004(Based on 8 full and 22 partial tracts) A) Conventional B) Refinancings C) Non-occupant Loans on Number Average Value Number Average Value Number Average Value
LOANS ORIGINATED 89 $52,315 49 $54,781 49 $43,476 APPLICATIONS APPROVED, NOT ACCEPTED 11 $30,195 7 $65,457 6 $25,460 APPLICATIONS DENIED 0 $0 1 $48,910 1 $62,820 APPLICATIONS WITHDRAWN 4 $57,355 0 $0 2 $54,985 FILES CLOSED FOR INCOMPLETENESS 0 $0 0 $0 0 $0
Aggregated Statistics For Year 2003(Based on 8 full and 24 partial tracts) A) Conventional B) Refinancings C) Non-occupant Loans on Number Average Value Number Average Value Number Average Value
LOANS ORIGINATED 45 $40,344 23 $48,620 21 $35,026 APPLICATIONS APPROVED, NOT ACCEPTED 8 $30,214 10 $58,995 5 $20,360 APPLICATIONS DENIED 4 $26,935 0 $0 3 $22,683 APPLICATIONS WITHDRAWN 4 $48,348 0 $0 2 $28,500 FILES CLOSED FOR INCOMPLETENESS 0 $0 0 $0 0 $0
Aggregated Statistics For Year 2002(Based on 8 full and 20 partial tracts) A) Conventional B) Refinancings C) Non-occupant Loans on Number Average Value Number Average Value Number Average Value
LOANS ORIGINATED 34 $47,415 32 $53,698 21 $36,124 APPLICATIONS APPROVED, NOT ACCEPTED 9 $48,800 8 $41,994 4 $32,868 APPLICATIONS DENIED 4 $51,258 3 $49,887 4 $42,505 APPLICATIONS WITHDRAWN 3 $38,063 4 $57,082 2 $37,075 FILES CLOSED FOR INCOMPLETENESS 0 $0 2 $57,870 0 $0
Aggregated Statistics For Year 2001(Based on 8 full and 20 partial tracts) A) Conventional B) Refinancings C) Non-occupant Loans on Number Average Value Number Average Value Number Average Value
LOANS ORIGINATED 60 $50,164 17 $55,185 10 $32,134 APPLICATIONS APPROVED, NOT ACCEPTED 9 $57,883 5 $45,782 3 $40,597 APPLICATIONS DENIED 2 $30,235 0 $0 2 $30,235 APPLICATIONS WITHDRAWN 0 $0 4 $44,628 1 $24,000 FILES CLOSED FOR INCOMPLETENESS 0 $0 0 $0 0 $0
Aggregated Statistics For Year 2000(Based on 8 full and 24 partial tracts) A) Conventional B) Refinancings C) Non-occupant Loans on Number Average Value Number Average Value Number Average Value
LOANS ORIGINATED 57 $45,582 31 $34,399 21 $30,999 APPLICATIONS APPROVED, NOT ACCEPTED 3 $32,727 5 $39,684 1 $33,000 APPLICATIONS DENIED 2 $14,910 5 $43,582 5 $26,038 APPLICATIONS WITHDRAWN 0 $0 0 $0 0 $0 FILES CLOSED FOR INCOMPLETENESS 0 $0 0 $0 0 $0
Aggregated Statistics For Year 1999(Based on 5 full and 10 partial tracts) A) Conventional B) Refinancings C) Non-occupant Loans on Number Average Value Number Average Value Number Average Value
LOANS ORIGINATED 16 $53,391 8 $35,988 2 $17,700 APPLICATIONS APPROVED, NOT ACCEPTED 3 $29,283 1 $39,140 0 $0 APPLICATIONS DENIED 0 $0 0 $0 0 $0 APPLICATIONS WITHDRAWN 0 $0 1 $18,580 1 $18,580 FILES CLOSED FOR INCOMPLETENESS 0 $0 1 $36,380 0 $0
2005 - 2018 National Fire Incident Reporting System (NFIRS) incidents See full 2006 National Fire Incident Reporting System statistics for zip code 53206, Wisconsin
Most common first names in zip code 53206 among deceased individuals Name Count Lived (average)
James 256 66.6 years John 214 70.2 years Willie 209 67.6 years William 175 71.8 years Mary 174 71.7 years Robert 144 64.5 years George 108 70.7 years Charles 103 67.7 years Henry 92 74.6 years Edward 85 69.3 years
Most common last names in zip code 53206 among deceased individuals Last name Count Lived (average)
Williams 162 64.4 years Johnson 149 66.1 years Smith 121 66.5 years Jones 112 67.2 years Brown 108 66.8 years Jackson 95 70.2 years Harris 67 64.2 years Davis 66 66.6 years Robinson 55 69.8 years Taylor 55 65.7 years
Businesses in zip code 53206
Name Count Name Count
Cricket Wireless 3 KFC 1 H&R Block 2 U-Haul 1
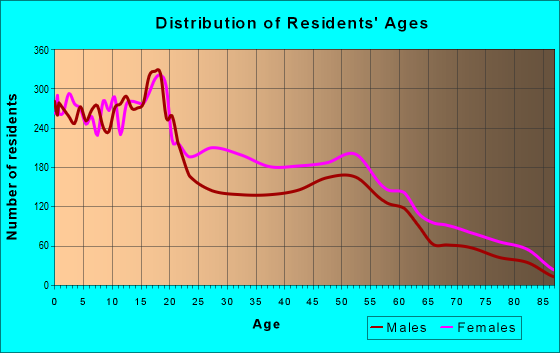
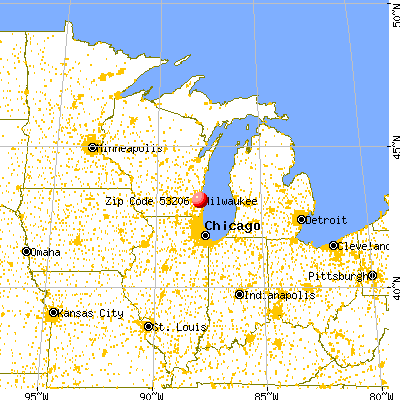


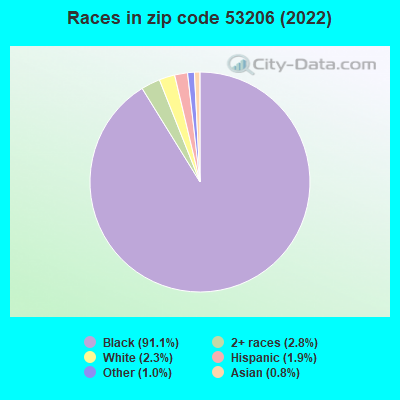


 Nearest zip codes: 53205, 53212, 53233, 53210, 53203, 53208.
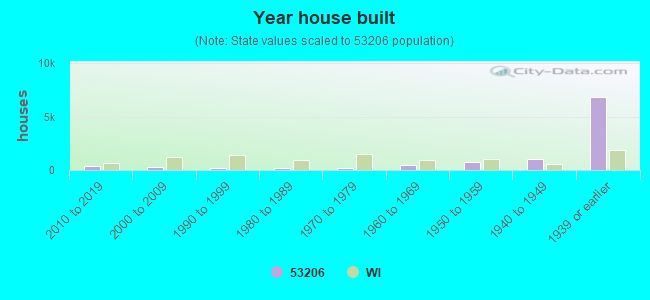

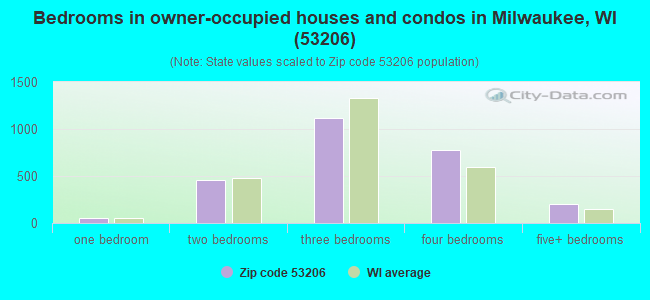
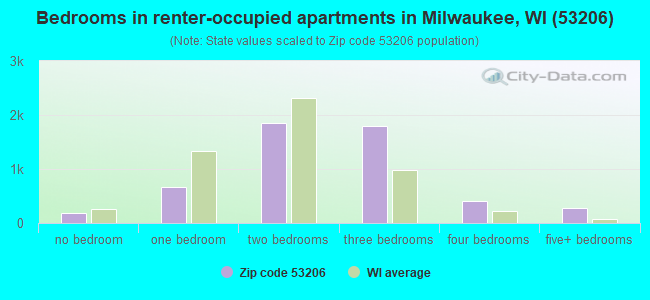
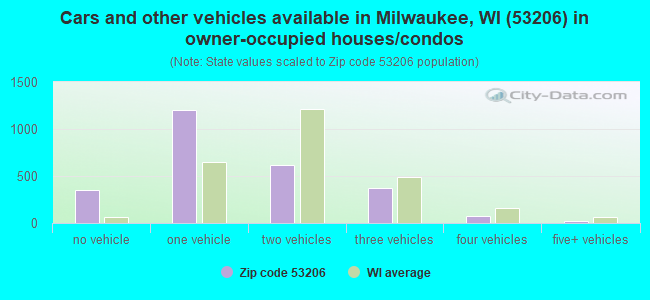
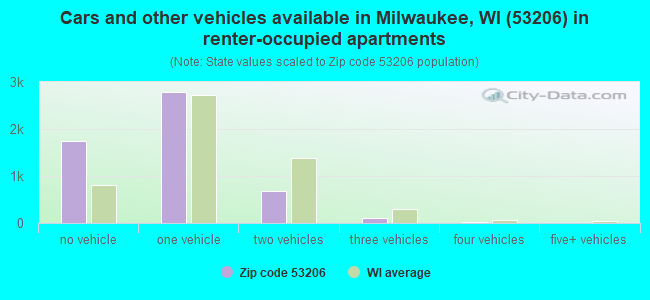


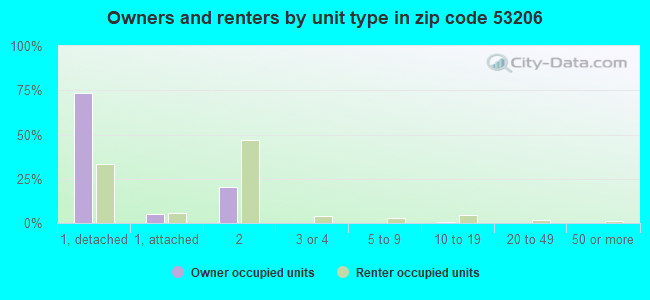
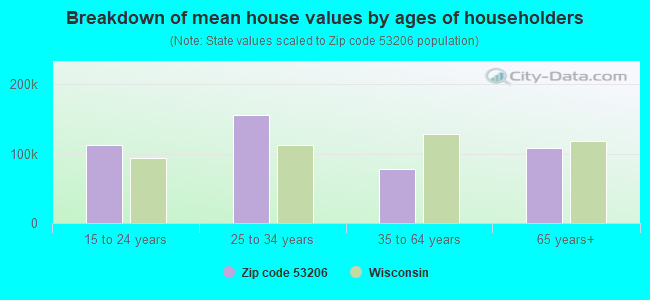


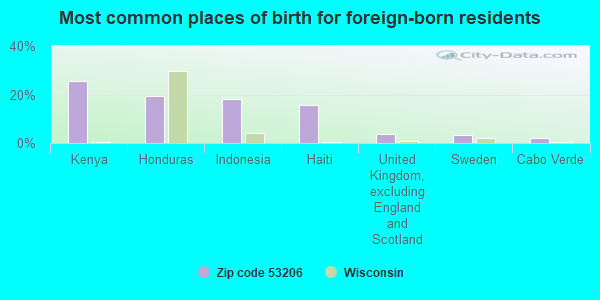
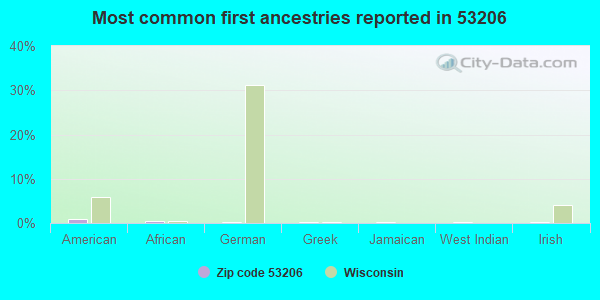
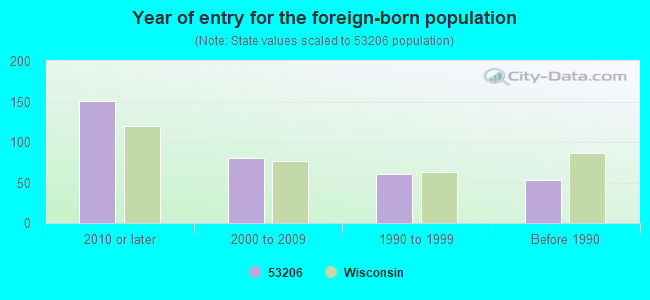
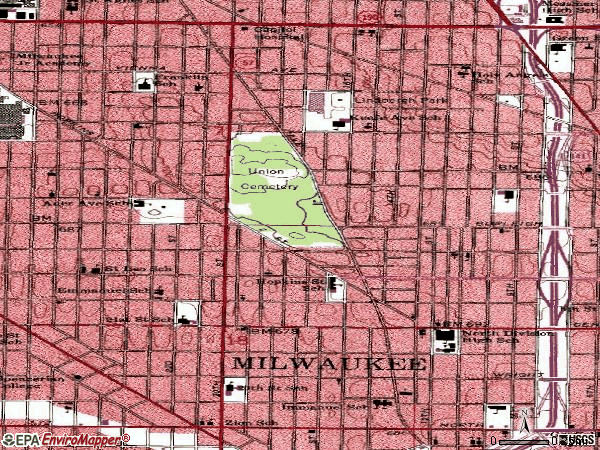

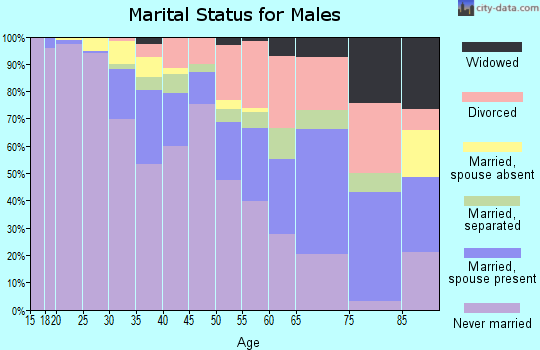
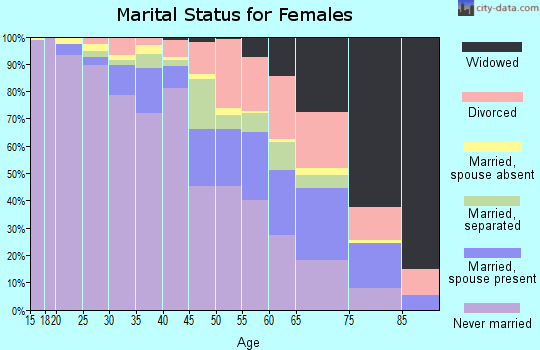
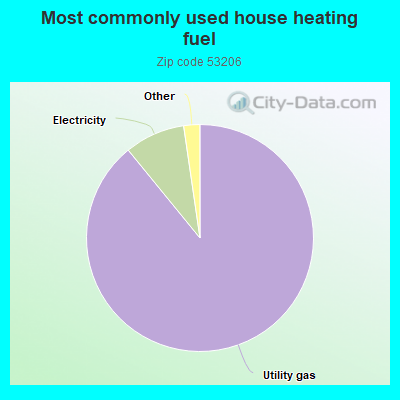
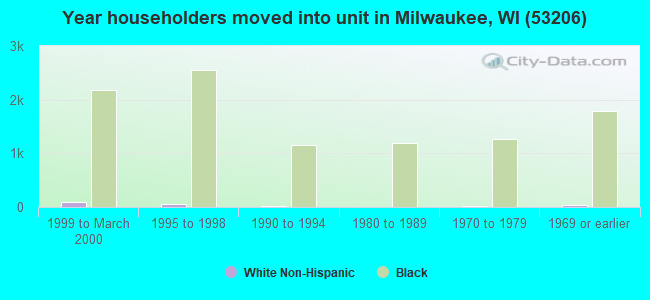
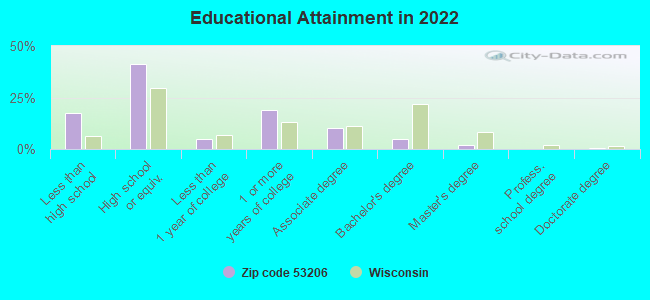
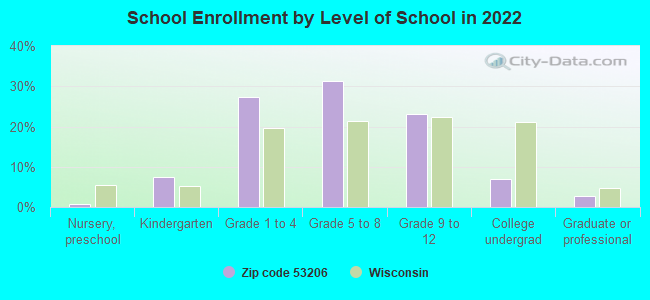
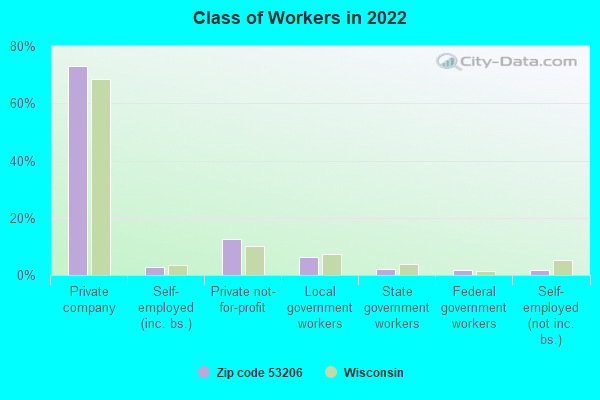
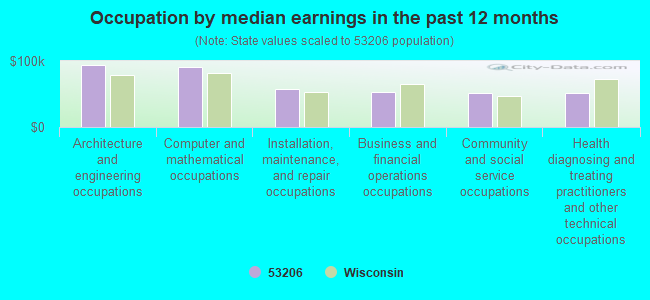
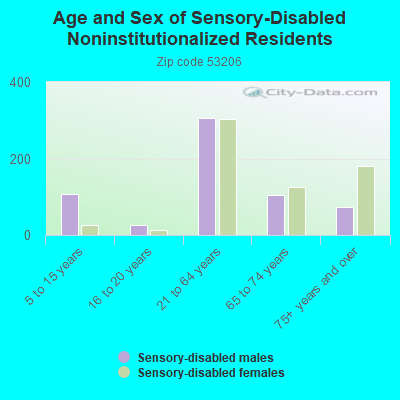
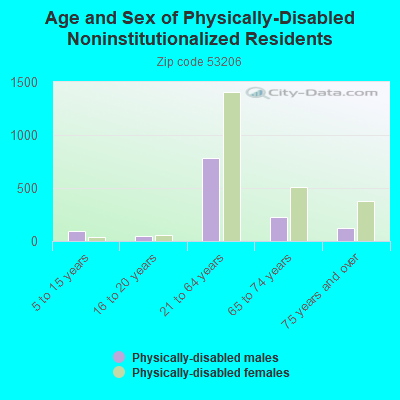
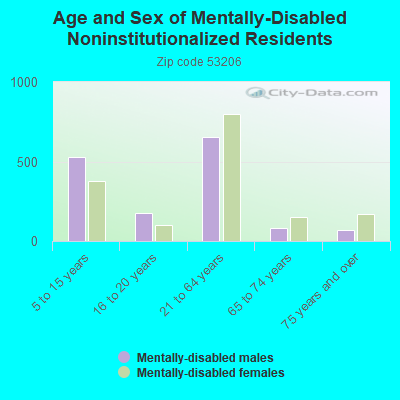
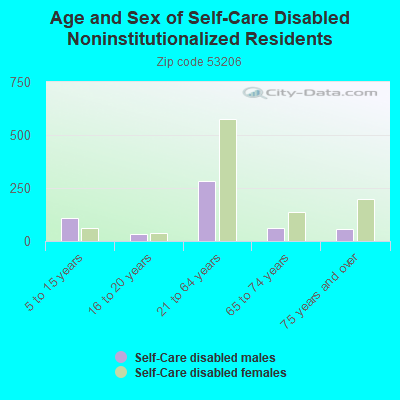
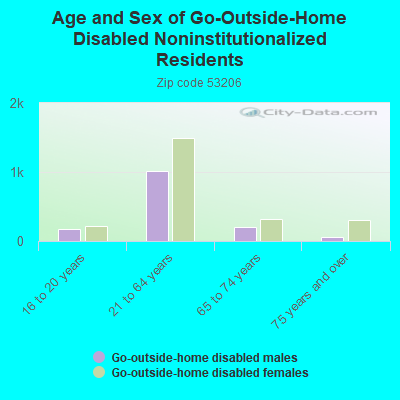
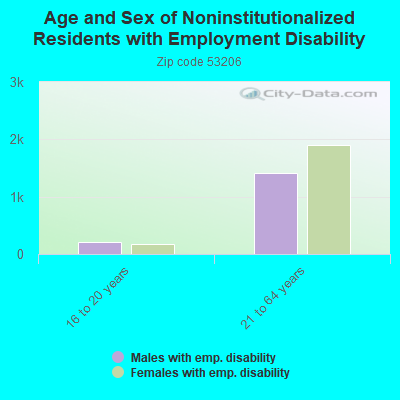
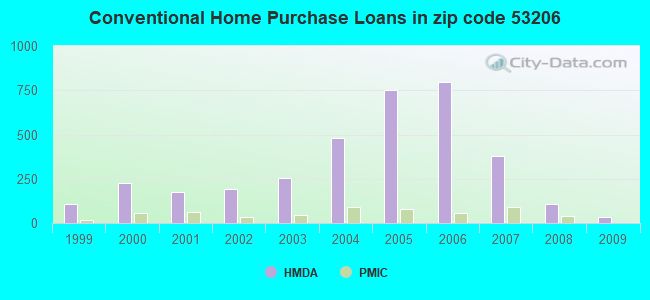
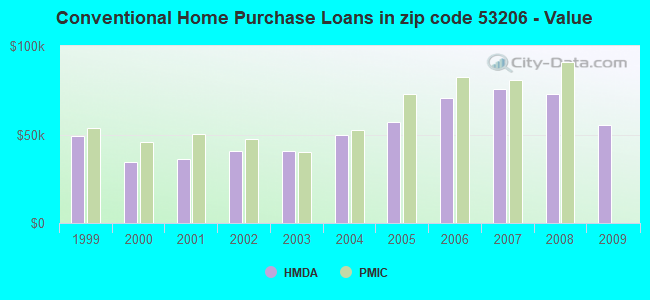
 According to the data from the years 2005 - 2018 the average number of fire incidents per year is 174. The highest number of reported fire incidents - 265 took place in 2012, and the least - 0 in 2006. The data has a declining trend.
 When looking into fire subcategories, the most reports belonged to: Structure Fires (46.0%), and Outside Fires (28.0%).