Estimated zip code population in 2022: 24,103 Zip code population in 2010: 28,126 Zip code population in 2000: 30,509
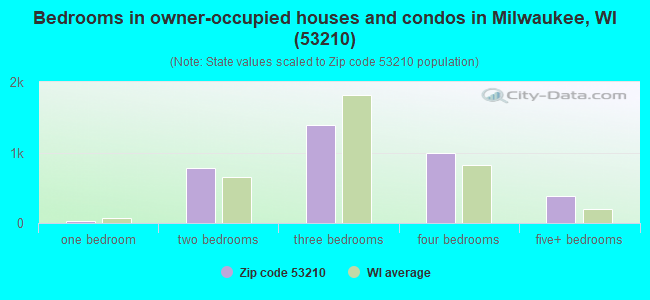
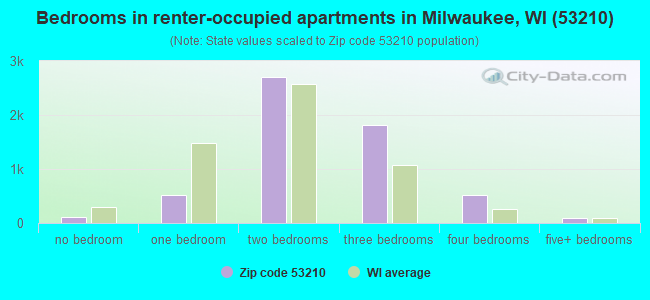
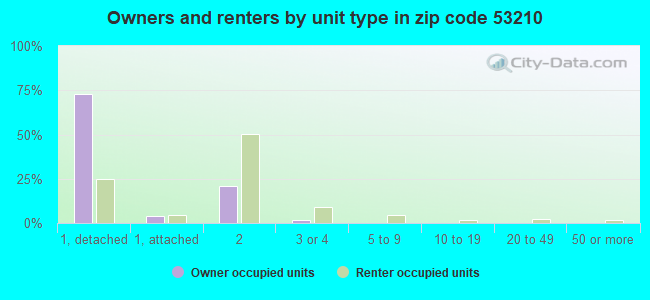
Houses and condos: 11,006 Renter-occupied apartments: 5,824
% of renters here:
62%
State:
32%
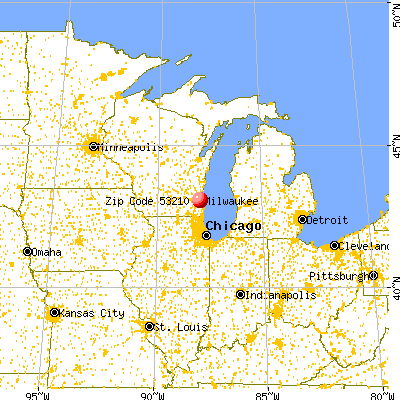
March 2022 cost of living index in zip code 53210: 97.3 (near average, U.S. average is 100)
Land area: 2.5 sq. mi. Water area: 0.0 sq. mi.
Population density: 9,469 people per square mile
(high).
OSM Map
General Map
Google Map
MSN Map
OSM Map
General Map
Google Map
MSN Map
OSM Map
General Map
Google Map
MSN Map
OSM Map
General Map
Google Map
MSN Map
Please wait while loading the map...
Real estate property taxes paid for housing units in 2022:
This zip code:
2.1% ($3,118)
Wisconsin:
1.4% ($3,497)
Median real estate property taxes paid for housing units with mortgages in 2022: $3,322 (2.1%) Median real estate property taxes paid for housing units with no mortgage in 2022: $2,481 (2.2%)
Business Search- 14 Million verified businesses
Males: 10,591
(44.0%)
Females: 13,506
(56.0%)
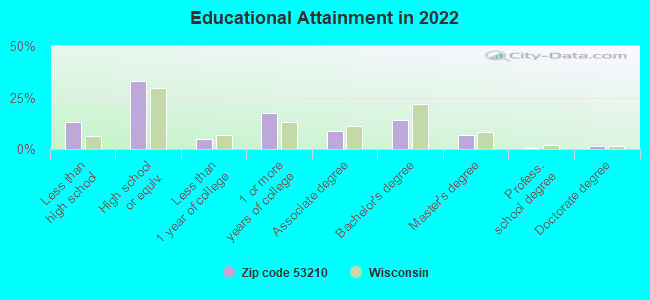
For population 25 years and over in 53210:
High school or higher: 85.6%
Bachelor's degree or higher: 22.3%
Graduate or professional degree: 8.4%
Unemployed: 6.8%
Mean travel time to work (commute): 22.0 minutes
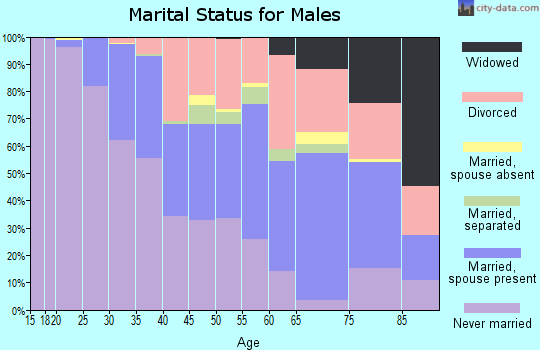
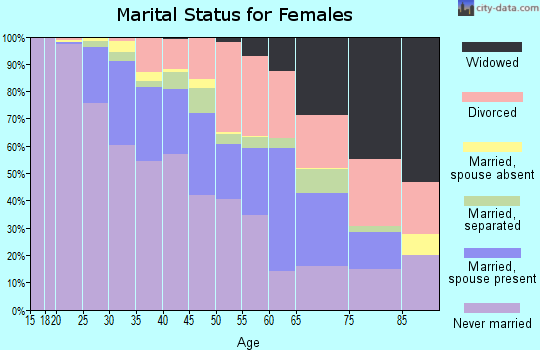
For population 15 years and over in 53210:
Never married: 58.7%
Now married: 25.6%
Separated: 2.2%
Widowed: 3.6%
Divorced: 9.9%
Zip code 53210 compared to state average:
Median household income below state average.
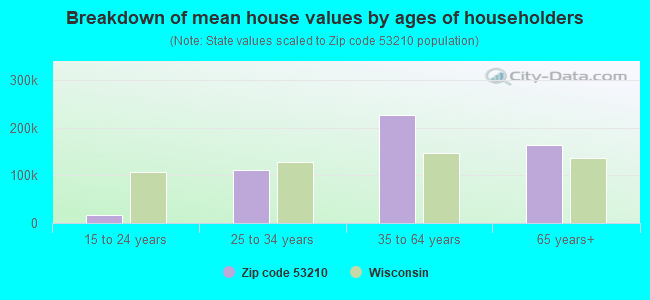
Median house value below state average.
Unemployed percentage above state average.
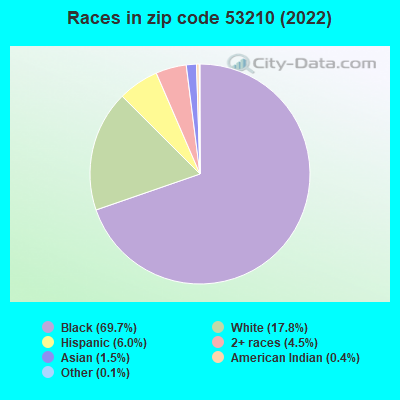
Black race population percentage significantly above state average.
Median age below state average.
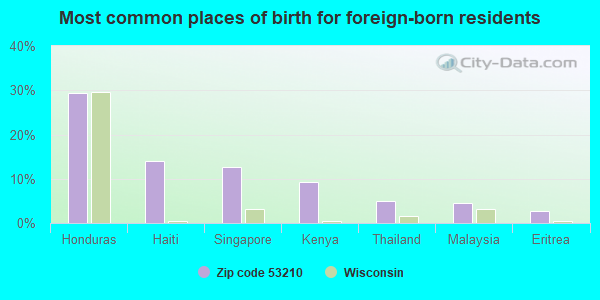
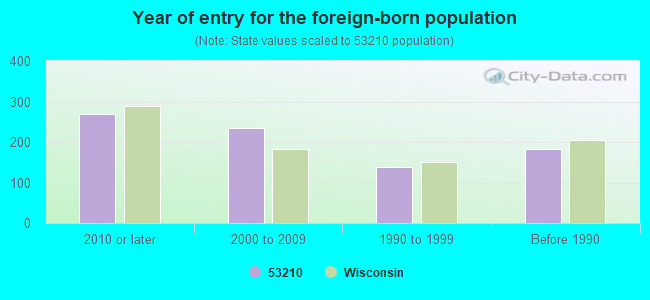
Foreign-born population percentage below state average.
Renting percentage above state average.
Length of stay since moving in significantly above state average.
House age above state average.
Percentage of population with a bachelor's degree or higher below state average.
Averages for the 2020 tax year for zip code 53210, filed in 2021:
Average Adjusted Gross Income (AGI) in 2020: $34,704 (Individual Income Tax Returns)
Here:
$34,704
State:
$72,319
Salary/wage: $32,389 (reported on 88.6% of returns)
Here:
$32,389
State:
$59,242
(% of AGI for various income ranges: 1162.0% for AGIs below $25k, 4055.4% for AGIs $25k-50k, 7704.8% for AGIs $50k-75k, 11943.1% for AGIs $75k-100k, 19282.3% for AGIs $100k-200k)
Taxable interest for individuals: $365 (reported on 12.5% of returns)
This zip code:
$365
Wisconsin:
$1,431
(% of AGI for various income ranges: 2.1% for AGIs below $25k, 3.2% for AGIs $25k-50k, 9.8% for AGIs $50k-75k, 21.9% for AGIs $75k-100k, 54.7% for AGIs $100k-200k)
Ordinary dividends: $2,531 (reported on 6.0% of returns)
Here:
$2,531
State:
$6,481
(% of AGI for various income ranges: 3.6% for AGIs below $25k, 8.6% for AGIs $25k-50k, 26.8% for AGIs $50k-75k, 76.2% for AGIs $75k-100k, 227.0% for AGIs $100k-200k)
Net capital gain/loss in AGI: +$4,317 (reported on 5.2% of returns)
Here:
+$4,317
State:
+$18,329
(% of AGI for various income ranges: 0.7% for AGIs below $25k, 6.8% for AGIs $25k-50k, 50.0% for AGIs $50k-75k, 113.8% for AGIs $75k-100k, 376.0% for AGIs $100k-200k)
Profit/loss from business: +$7,352 (reported on 12.8% of returns)
Here:
+$7,352
State:
+$14,562
(% of AGI for various income ranges: 104.1% for AGIs below $25k, 59.1% for AGIs $25k-50k, 134.4% for AGIs $50k-75k, 518.5% for AGIs $75k-100k, 608.0% for AGIs $100k-200k)
Taxable individual retirement arrangement distribution: $13,818 (reported on 3.5% of returns)
53210:
$13,818
Wisconsin:
$19,348
(% of AGI for various income ranges: 14.3% for AGIs below $25k, 27.8% for AGIs $25k-50k, 154.6% for AGIs $50k-75k, 376.2% for AGIs $75k-100k, 633.7% for AGIs $100k-200k)
Total itemized deductions: $22,858 (reported on 3.5% of returns)
Here:
$22,858
State:
$33,000
(% of AGI for various income ranges: 11.7% for AGIs below $25k, 73.6% for AGIs $25k-50k, 248.1% for AGIs $50k-75k, 604.6% for AGIs $75k-100k, 1024.7% for AGIs $100k-200k)
Charity contributions: $7,855 (reported on 2.7% of returns)
Here:
$7,855
State:
$12,044
(% of AGI for various income ranges: 23.9% for AGIs $25k-50k, 62.6% for AGIs $50k-75k, 152.7% for AGIs $75k-100k, 300.3% for AGIs $100k-200k)
Taxes paid: $6,710 (reported on 3.5% of returns)
53210:
$6,710
State:
$8,228
(% of AGI for various income ranges: 2.6% for AGIs below $25k, 12.1% for AGIs $25k-50k, 81.4% for AGIs $50k-75k, 204.2% for AGIs $75k-100k, 351.7% for AGIs $100k-200k)
Earned income credit: $2,931 (reported on 37.9% of returns)
Here:
$2,931
State:
$2,155
(% of AGI for various income ranges: 200.3% for AGIs below $25k, 122.3% for AGIs $25k-50k)
Percentage of individuals using paid preparers for their 2020 taxes: 92.8%
Here:
93%
State:
94%
(% for various income ranges: 93.9% for AGIs below $25k, 91.9% for AGIs $25k-50k, 92.6% for AGIs $50k-75k, 89.4% for AGIs $75k-100k, 91.1% for AGIs $100k-200k, 100.0% for AGIs over 200k)
Averages for the 2012 tax year for zip code 53210, filed in 2013:
Average Adjusted Gross Income (AGI) in 2012: $30,330 (Individual Income Tax Returns)
Here:
$30,330
State:
$57,939
Salary/wage: $28,671 (reported on 87.9% of returns)
Here:
$28,671
State:
$48,248
(% of AGI for various income ranges: 77.1% for AGIs below $25k, 88.7% for AGIs $25k-50k, 85.8% for AGIs $50k-75k, 85.3% for AGIs $75k-100k, 82.5% for AGIs $100k-200k, 56.3% for AGIs over 200k)
Taxable interest for individuals: $430 (reported on 15.1% of returns)
This zip code:
$430
Wisconsin:
$1,224
(% of AGI for various income ranges: 0.2% for AGIs below $25k, 0.2% for AGIs $25k-50k, 0.2% for AGIs $50k-75k, 0.2% for AGIs $75k-100k, 0.3% for AGIs $100k-200k, 0.4% for AGIs over 200k)
Ordinary dividends: $1,870 (reported on 7.0% of returns)
Here:
$1,870
State:
$5,137
(% of AGI for various income ranges: 0.3% for AGIs below $25k, 0.3% for AGIs $25k-50k, 0.5% for AGIs $50k-75k, 0.4% for AGIs $75k-100k, 0.9% for AGIs $100k-200k)
Net capital gain/loss in AGI: +$2,765 (reported on 4.3% of returns)
Here:
+$2,765
State:
+$11,137
(% of AGI for various income ranges: 0.1% for AGIs $25k-50k, 0.3% for AGIs $75k-100k, 2.0% for AGIs $100k-200k)
Profit/loss from business: +$9,440 (reported on 14.8% of returns)
Here:
+$9,440
State:
+$11,943
(% of AGI for various income ranges: 12.9% for AGIs below $25k, 1.9% for AGIs $25k-50k, 1.1% for AGIs $50k-75k, 1.8% for AGIs $75k-100k, 3.1% for AGIs $100k-200k)
Taxable individual retirement arrangement distribution: $8,964 (reported on 4.2% of returns)
53210:
$8,964
Wisconsin:
$14,087
(% of AGI for various income ranges: 0.7% for AGIs below $25k, 1.1% for AGIs $25k-50k, 1.4% for AGIs $50k-75k, 1.7% for AGIs $75k-100k, 1.8% for AGIs $100k-200k)
Total itemized deductions: $16,811 (24% of AGI, reported on 18.5% of returns)
Here:
$16,811
State:
$22,257
Here:
24.2% of AGI
State:
20.1% of AGI
(% of AGI for various income ranges: 3.9% for AGIs below $25k, 7.7% for AGIs $25k-50k, 12.8% for AGIs $50k-75k, 16.1% for AGIs $75k-100k, 17.3% for AGIs $100k-200k, 12.6% for AGIs over 200k)
Charity contributions: $3,201 (reported on 14.6% of returns)
Here:
$3,201
State:
$3,370
(% of AGI for various income ranges: 0.5% for AGIs below $25k, 1.0% for AGIs $25k-50k, 2.1% for AGIs $50k-75k, 2.5% for AGIs $75k-100k, 2.8% for AGIs $100k-200k, 1.4% for AGIs over 200k)
Taxes paid: $6,989 (reported on 18.5% of returns)
53210:
$6,989
State:
$10,731
(% of AGI for various income ranges: 1.0% for AGIs below $25k, 2.6% for AGIs $25k-50k, 5.3% for AGIs $50k-75k, 7.2% for AGIs $75k-100k, 8.4% for AGIs $100k-200k, 7.0% for AGIs over 200k)
Earned income credit: $2,958 (reported on 45.0% of returns)
Here:
$2,958
State:
$2,094
(% of AGI for various income ranges: 15.6% for AGIs below $25k, 2.0% for AGIs $25k-50k)
Percentage of individuals using paid preparers for their 2012 taxes: 42.1%
Here:
42%
State:
54%
(% for various income ranges: 40.6% for AGIs below $25k, 42.4% for AGIs $25k-50k, 44.8% for AGIs $50k-75k, 50.0% for AGIs $75k-100k, 45.5% for AGIs $100k-200k, 66.7% for AGIs over 200k)
Averages for the 2004 tax year for zip code 53210, filed in 2005:
Average Adjusted Gross Income (AGI) in 2004: $28,138 (Individual Income Tax Returns)
Here:
$28,138
State:
$47,735
Salary/wage: $27,200 (reported on 91.5% of returns)
Here:
$27,200
State:
$41,540
(% of AGI for various income ranges: 89.0% for AGIs below $10k, 86.2% for AGIs $10k-25k, 92.2% for AGIs $25k-50k, 88.3% for AGIs $50k-75k, 86.0% for AGIs $75k-100k, 84.0% for AGIs over 100k)
Taxable interest for individuals: $677 (reported on 23.2% of returns)
This zip code:
$677
Wisconsin:
$1,420
(% of AGI for various income ranges: 1.1% for AGIs below $10k, 0.6% for AGIs $10k-25k, 0.5% for AGIs $25k-50k, 0.6% for AGIs $50k-75k, 0.5% for AGIs $75k-100k, 0.5% for AGIs over 100k)
Taxable dividends: $1,183 (reported on 10.1% of returns)
Here:
$1,183
State:
$2,869
(% of AGI for various income ranges: 0.8% for AGIs below $10k, 0.3% for AGIs $10k-25k, 0.3% for AGIs $25k-50k, 0.4% for AGIs $50k-75k, 0.6% for AGIs $75k-100k, 0.7% for AGIs over 100k)
Net capital gain/loss: +$3,469 (reported on 6.6% of returns)
Here:
+$3,469
State:
+$9,569
(% of AGI for various income ranges: 0.5% for AGIs below $10k, 0.1% for AGIs $10k-25k, 0.4% for AGIs $25k-50k, 0.6% for AGIs $50k-75k, 0.7% for AGIs $75k-100k, 4.1% for AGIs over 100k)
Profit/loss from business: +$7,850 (reported on 9.3% of returns)
Here:
+$7,850
State:
+$10,417
(% of AGI for various income ranges: 5.1% for AGIs below $10k, 4.6% for AGIs $10k-25k, 1.6% for AGIs $25k-50k, 2.4% for AGIs $50k-75k, 2.6% for AGIs $75k-100k, 1.5% for AGIs over 100k)
IRA payment deduction: $1,781 (reported on 1.5% of returns)
53210:
$1,781
Wisconsin:
$2,900
(% of AGI for various income ranges: 0.1% for AGIs $10k-25k, 0.1% for AGIs $25k-50k, 0.1% for AGIs $50k-75k, 0.2% for AGIs $75k-100k)
Total itemized deductions: $13,944 (25% of AGI, reported on 23.0% of returns)
Here:
$13,944
State:
$18,160
Here:
24.6% of AGI
State:
21.1% of AGI
(% of AGI for various income ranges: 5.4% for AGIs below $10k, 4.9% for AGIs $10k-25k, 10.3% for AGIs $25k-50k, 15.2% for AGIs $50k-75k, 17.6% for AGIs $75k-100k, 15.6% for AGIs over 100k)
Charity contributions deductions: $2,560 (4% of AGI, reported on 19.2% of returns)
Here:
$2,560
State:
$2,711
Here:
4.3% of AGI
State:
3.0% of AGI
(% of AGI for various income ranges: 0.4% for AGIs below $10k, 0.5% for AGIs $10k-25k, 1.6% for AGIs $25k-50k, 2.5% for AGIs $50k-75k, 2.7% for AGIs $75k-100k, 2.6% for AGIs over 100k)
Total tax: $3,632 (reported on 58.0% of returns)
53210:
$3,632
State:
$7,114
(% of AGI for various income ranges: 1.8% for AGIs below $10k, 2.9% for AGIs $10k-25k, 6.5% for AGIs $25k-50k, 9.3% for AGIs $50k-75k, 10.4% for AGIs $75k-100k, 14.9% for AGIs over 100k)
Earned income credit: $2,026 (reported on 39.2% of returns)
Here:
$2,026
State:
$1,544
Percentage of individuals using paid preparers for their 2004 taxes: 62.1%
Here:
62%
State:
57%
(% for various income ranges: 63.8% for AGIs below $10k, 69.2% for AGIs $10k-25k, 57.9% for AGIs $25k-50k, 51.2% for AGIs $50k-75k, 50.7% for AGIs $75k-100k, 54.6% for AGIs over 100k)
Likely homosexual households (counted as self-reported same-sex unmarried-partner households)
Lesbian couples: 0.6% of all households
Gay men: 0.2% of all households
Household received Food Stamps/SNAP in the past 12 months: 3,709 Household did not receive Food Stamps/SNAP in the past 12 months: 6,039
Women who had a birth in the past 12 months: 461 (232 now married, 226 unmarried) Women who did not have a birth in the past 12 months: 6,273 (1,061 now married, 5,212 unmarried)
Housing units in zip code 53210 with a mortgage: 2,478 (145 second mortgage, 17 home equity loan, 121 both second mortgage and home equity loan) Houses without a mortgage: 59
Median monthly owner costs for units with a mortgage: $1,358 Median monthly owner costs for units without a mortgage: $638
Residents with income below the poverty level in 2022:
This zip code:
30.6%
Whole state:
10.7%
Residents with income below 50% of the poverty level in 2022:
This zip code:
17.9%
Whole state:
5.7%
Median number of rooms in houses and condos:
Here:
6.6
State:
6.5
Median number of rooms in apartments:
Here:
5.1
State:
4.1
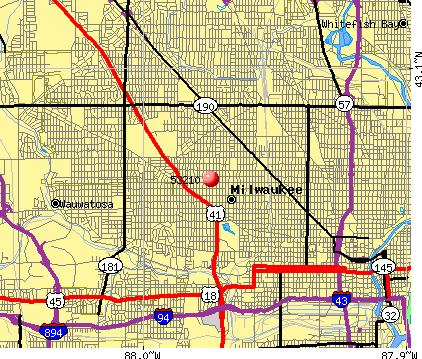
Notable locations in this zip code not listed on our city pages
Notable locations in zip code 53210: Park Industrial Center (A), Milwaukee Fire Department Engine 34 (B), Milwaukee Jewish Home tor the Aged (C), Fire Station Number 34 (D), Milwaukee Fire Department Engine 13 (E), Bennett Girls Dormitory (F). Display/hide their locations on the map
Churches in zip code 53210 include: Bethel German Baptist Church (A), Bethel United Church of Christ (B), Saint Catherines Roman Catholic Church (C), Calvary Evangelical United Brethren Church (D), Saint Anne Roman Catholic Church (E), Mount Calvary Evangelical Lutheran Church (F), Mother of Good Counsel Roman Catholic Church (G), Third Church of Christ Scientist (H), Saron Evangelical Lutheran Church (I). Display/hide their locations on the map
Parks in zip code 53210 include: Center Street Park (1), Butterfly Park (2), Metcalfe Park (3), Enderis Playground (4), Sherman Park (5). Display/hide their locations on the map
In group quarters: 256 (-1 institutionalized population)
Size of family households: 2,248 2-persons, 1,549 3-persons, 889 4-persons, 638 5-persons, 236 6-persons, 131 7-or-more-persons
Size of nonfamily households: 3,215 1-person, 417 2-persons, 83 3-persons
1,356 married couples with children.
4,309 single-parent households (651 men, 3,658 women).
93.3% of residents of 53210 zip code speak English at home.
3.3% of residents speak Spanish at home (70% very well, 19% well, 11% not well, 1% not at all).
0.8% of residents speak other Indo-European language at home (93% very well, 7% not well).
1.6% of residents speak Asian or Pacific Island language at home (47% very well, 12% well, 38% not well, 3% not at all).
0.3% of residents speak other language at home (100% very well).
Foreign born population: 544 (2.3%) (37.6% of them are naturalized citizens)
Facilities with environmental interests located in this zip code:
BOSTIK FINDLEY INC (3033 W PEMBERTON AVE in MILWAUKEE, WI)
Conditionally Exempt Small Quantity Generators, less than 100 kg/month of hazardous waste (Resource Conservation and Recovery Act (tracking hazardous waste)) - notification TRI REPORTER (Tracking of toxic chemicals releasing facilities) STATE MASTER (Wisconsin database) - TRIS-53210FNDLY3033W, TRI REPORTER, RCRAINFO-WID006083364, CESQG Business SIC classification: ADHESIVES AND SEALANTS Organizations: TOTAL FINA ELF (CONTACT/OWNER)
Alternative names: ATO FINDLEY INC, FINDLEY ADHESIVES INC.
BUMPER TO BUMPER AUTO PARTS SPECIALIST (3211 W BURLEIGH ST in MILWAUKEE, WI)
(Resource Conservation and Recovery Act (tracking hazardous waste)) STATE MASTER (Wisconsin database) - RCRAINFO-WIR000032078, SQG Alternative names: BUMPER TO BUMPER AUTO PARTS SPECIALISTS
AMERICAN RECYCLING& AUTO (3015 W CENTER ST in MILWAUKEE, WI)
Conditionally Exempt Small Quantity Generators, less than 100 kg/month of hazardous waste (Resource Conservation and Recovery Act (tracking hazardous waste)) - notification STATE MASTER (Wisconsin database) - RCRAINFO-WID063493639, CESQG Organizations: BEYBER AARON (CONTACT/OWNER)
BOSTIK FINDLEY INC (2930 W CENTER ST in MILWAUKEE, WI)
Conditionally Exempt Small Quantity Generators, less than 100 kg/month of hazardous waste (Resource Conservation and Recovery Act (tracking hazardous waste)) - notification STATE MASTER (Wisconsin database) - RCRAINFO-WID981101819, CESQG Business SIC classification: ADHESIVES AND SEALANTS Organizations: TOTAL FINA ELF (CONTACT/OWNER)
Alternative names: ATO FINDLEY INC
ACA MGMT SERV AMOCO (4811 W LISBON AVE in MILWAUKEE, WI)
Small Quantity Generators, between 100 kg and 1000 kg of hazardous waste/month (Resource Conservation and Recovery Act (tracking hazardous waste)) - notification STATE MASTER (Wisconsin database) - RCRAINFO-WID988609772, SQG Organizations: AMOCO OIL CO (CONTACT/OWNER)
AMOCO STATION 15220 (2707 N BURLEIGH ST in MILWAUKEE, WI)
Conditionally Exempt Small Quantity Generators, less than 100 kg/month of hazardous waste (Resource Conservation and Recovery Act (tracking hazardous waste)) - notification STATE MASTER (Wisconsin database) - RCRAINFO-WIR000008425, CESQG Organizations: AMOCO OIL CO (CONTACT/OWNER)
Alternative names: WILLIAMS AMOCO
BECKER RITTER FUNERAL HOME (5330 W LISBON AVE in MILWAUKEE, WI)
Conditionally Exempt Small Quantity Generators, less than 100 kg/month of hazardous waste (Resource Conservation and Recovery Act (tracking hazardous waste)) - notification STATE MASTER (Wisconsin database) - RCRAINFO-WIR000014316, CESQG Organizations: J H BECKER & SONS INC (CONTACT/OWNER)
CENTRAL SUPPORT FACILITY (5011 W LISBON AVE in MILWAUKEE, WI)
Conditionally Exempt Small Quantity Generators, less than 100 kg/month of hazardous waste (Resource Conservation and Recovery Act (tracking hazardous waste)) - notification STATE MASTER (Wisconsin database) - RCRAINFO-WI0000135756, CESQG Organizations: HOUSING AUTHORITY CITY OF MILWAUKEE (CONTACT/OWNER)
A TO Z PRINTING CO INC (4923 W LISBON AVE in MILWAUKEE, WI)
(Resource Conservation and Recovery Act (tracking hazardous waste)) Organizations: NICK SZABO (CONTACT/OWNER)
2947 THR 55 N 67TH ST 17 UNIT APT (2947 THRU 55 N 67TH ST 17 UNIT in MILWAUKEE, WI)
(Resource Conservation and Recovery Act (tracking hazardous waste))
A1 BUMPER (2879 N 30TH in MILWAUKEE, WI)
(Resource Conservation and Recovery Act (tracking hazardous waste))
BRIGGS & STRATTON (2560 N. 32ND ST. in MILWAUKEE, WI)
AIR MAJOR (AIRS/AFS) Business SIC classification: INTERNAL COMBUSTION ENGINES
Housing units lacking complete plumbing facilities: 1.7% Housing units lacking complete kitchen facilities: 5.8%
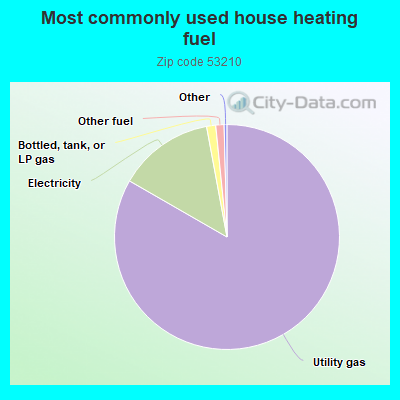
83.4%Utility gas
13.8%Electricity
1.3%Bottled, tank, or LP gas
1.2%Other fuel
Population in 1990: 32,111.
Place of birth for U.S.-born residents:
This state: 16,626
Northeast: 193
Midwest: 3,827
South: 2,320
West: 305
49% of the 53210 zip code residents lived in the same house 5 years ago. Out of people who lived in different houses, 85% lived in this county. Out of people who lived in different counties, 50% lived in Wisconsin.
83% of the 53210 zip code residents lived in the same house 1 year ago. Out of people who lived in different houses, 77% moved from this county. Out of people who lived in different houses, 6% moved from different county within same state. Out of people who lived in different houses, 7% moved from different state. Out of people who lived in different houses, 3% moved from abroad.
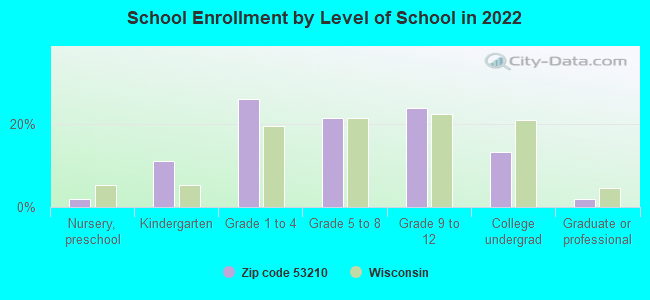
Private vs. public school enrollment:
Students in private schools in grades 1 to 8 (elementary and middle school): 692
Here:
22.3%
Wisconsin:
16.7%
Students in private schools in grades 9 to 12 (high school): 253
Here:
16.2%
Wisconsin:
12.5%
Students in private undergraduate colleges: 317
Here:
36.9%
Wisconsin:
17.5%
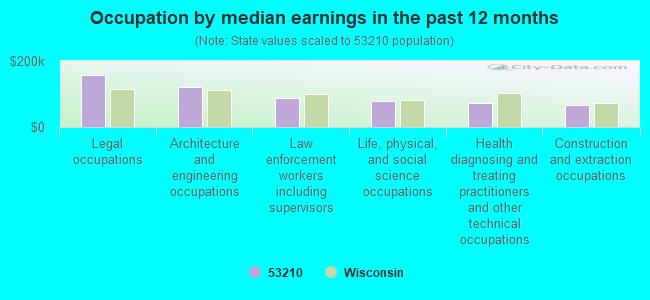
Occupation by median earnings in the past 12 months ($)
158,781Legal occupations
121,022Architecture and engineering occupations
87,394Law enforcement workers including supervisors
78,575Life, physical, and social science occupations
71,355Health diagnosing and treating practitioners and other technical occupations
67,304Construction and extraction occupations
Companies with federal contracts located in this zip code:
NORRIS & ASSOCIATES INC (7100 WEST CENTER STREET in MILWAUKEE, WI; small business) : $115,646 in 4 contractsfrom 2002 to 2003
$92,091 with U.S. Army Corps of Engineers - civil program financing only for Architect - Engineer Services (including landscaping, interior layout, and designing). Taking place in IL. Signed on 2002-10-30. Completion date: 2003-07-07.
$33,555, same as above.Signed on 2003-07-14. Completion date: 2003-08-25.
$10,000 with Army for Architect - Engineer Services (including landscaping, interior layout, and designing). Signed on 2003-10-20. Completion date: 2003-08-14.
-$20,000 with U.S. Army Corps of Engineers - civil program financing only for Architect - Engineer Services (including landscaping, interior layout, and designing). Signed on 2002-11-20. Completion date: 2003-08-14.
KING VACUUM CLEANER & CARPET C (2773 N 54TH ST in MILWAUKEE, WI; small business) : $63,274 in 5 contractsin 2005
Contracts for Grinding Machines, Floor Polishers and Vacuum Cleaning Equipment, Hand Tools, Power Driven, Miscellaneous Maintenance and Repair Shop Specialized Equipment by Bureau of Prisoners/Federal Prison System, Bureau of Reclamation, Army Signed by year:2000: $0; 2001: $0; 2002: $0; 2003: $0; 2004: $0; 2005: $63,274; 2006: $0.
Biggest contracts:
$23,688 with Bureau of Prisoners/Federal Prison System for Grinding Machines. Taking place in SC. Signed on 2005-07-21. Completion date: 2005-09-30.
$22,560 with Bureau of Prisoners/Federal Prison System for Floor Polishers and Vacuum Cleaning Equipment. Taking place in SC. Signed on 2005-07-15. Completion date: 2005-09-30.
$14,687 with Bureau of Reclamation for Hand Tools, Power Driven. Taking place in CO. Signed on 2005-01-28. Completion date: 2005-02-18.
$3,467 with Army for Miscellaneous Maintenance and Repair Shop Specialized Equipment. Signed on 2005-03-25. Completion date: 2005-06-30.
Top industries in this zip code by the number of employees in 2005:
Health Care and Social Assistance: General Medical and Surgical Hospitals (over 1000 employees: 1 establishment, 100-249 employees: 1 establishment)
Health Care and Social Assistance: Child Day Care Services (20-49: 4, 10-19: 7, 5-9: 11, 1-4: 33)
Health Care and Social Assistance: Offices of Physicians (except Mental Health Specialists) (50-99: 1, 20-49: 3, 10-19: 3, 5-9: 6, 1-4: 19)
2005 - 2018 National Fire Incident Reporting System (NFIRS) incidents
According to the data from the years 2005 - 2018 the average number of fire incidents per year is 149. The highest number of fires - 257 took place in 2012, and the least - 0 in 2006. The data has an increasing trend.
When looking into fire subcategories, the most incidents belonged to: Structure Fires (42.3%), and Outside Fires (33.7%).
Fire incident types reported to NFIRS in Zip Code 53210


 Nearest zip codes: 53216, 53208, 53213, 53206, 53205, 53295.
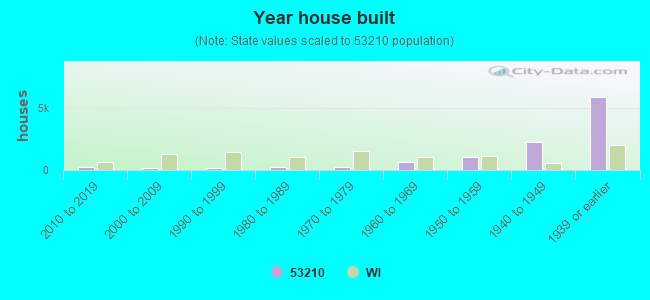


 According to the data from the years 2005 - 2018 the average number of fire incidents per year is 149. The highest number of fires - 257 took place in 2012, and the least - 0 in 2006. The data has an increasing trend.
 When looking into fire subcategories, the most incidents belonged to: Structure Fires (42.3%), and Outside Fires (33.7%).