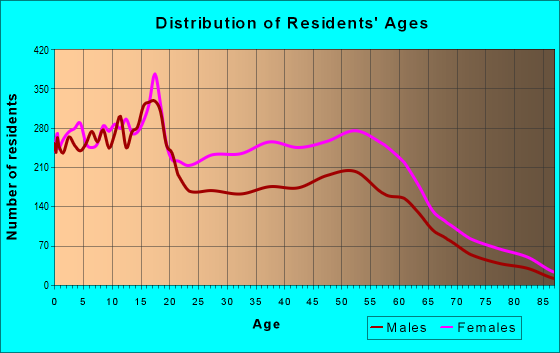
Estimated zip code population in 2022: 31,084 Zip code population in 2010: 32,264 Zip code population in 2000: 33,871
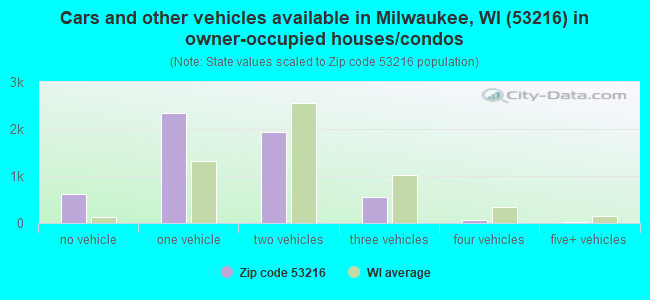
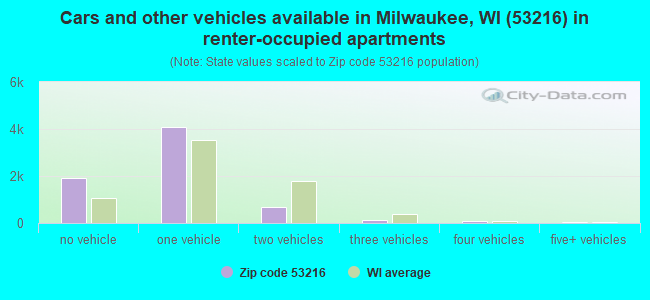
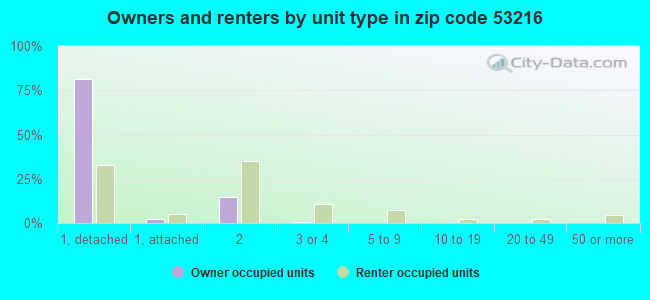
Houses and condos: 14,067 Renter-occupied apartments: 6,843
% of renters here:
54%
State:
32%
March 2022 cost of living index in zip code 53216: 96.6 (near average, U.S. average is 100)
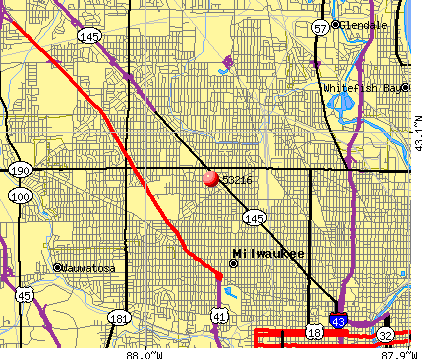
Land area: 4.6 sq. mi. Water area: 0.0 sq. mi.
Population density: 6,701 people per square mile
(high).
OSM Map
General Map
Google Map
MSN Map
OSM Map
General Map
Google Map
MSN Map
OSM Map
General Map
Google Map
MSN Map
OSM Map
General Map
Google Map
MSN Map
Please wait while loading the map...
Real estate property taxes paid for housing units in 2022:
This zip code:
1.9% ($2,399)
Wisconsin:
1.4% ($3,497)
Median real estate property taxes paid for housing units with mortgages in 2022: $2,467 (1.8%) Median real estate property taxes paid for housing units with no mortgage in 2022: $2,277 (2.1%)
Averages for the 2020 tax year for zip code 53216, filed in 2021:
Average Adjusted Gross Income (AGI) in 2020: $34,852 (Individual Income Tax Returns)
Here:
$34,852
State:
$72,319
Salary/wage: $31,679 (reported on 86.8% of returns)
Here:
$31,679
State:
$59,242
(% of AGI for various income ranges: 1190.4% for AGIs below $25k, 4100.0% for AGIs $25k-50k, 7914.1% for AGIs $50k-75k, 11421.3% for AGIs $75k-100k, 18955.9% for AGIs $100k-200k)
Taxable interest for individuals: $462 (reported on 12.1% of returns)
This zip code:
$462
Wisconsin:
$1,431
(% of AGI for various income ranges: 2.6% for AGIs below $25k, 3.9% for AGIs $25k-50k, 10.4% for AGIs $50k-75k, 16.6% for AGIs $75k-100k, 107.4% for AGIs $100k-200k)
Ordinary dividends: $2,395 (reported on 4.7% of returns)
Here:
$2,395
State:
$6,481
(% of AGI for various income ranges: 3.7% for AGIs below $25k, 3.3% for AGIs $25k-50k, 14.3% for AGIs $50k-75k, 32.4% for AGIs $75k-100k, 277.8% for AGIs $100k-200k)
Net capital gain/loss in AGI: +$5,723 (reported on 3.4% of returns)
Here:
+$5,723
State:
+$18,329
(% of AGI for various income ranges: 2.2% for AGIs below $25k, 2.8% for AGIs $25k-50k, 22.2% for AGIs $50k-75k, 53.4% for AGIs $75k-100k, 291.9% for AGIs $100k-200k)
Profit/loss from business: +$6,716 (reported on 12.7% of returns)
Here:
+$6,716
State:
+$14,562
(% of AGI for various income ranges: 85.6% for AGIs below $25k, 39.5% for AGIs $25k-50k, 102.0% for AGIs $50k-75k, 303.2% for AGIs $75k-100k, 1434.1% for AGIs $100k-200k)
Taxable individual retirement arrangement distribution: $12,236 (reported on 4.2% of returns)
53216:
$12,236
Wisconsin:
$19,348
(% of AGI for various income ranges: 18.2% for AGIs below $25k, 39.2% for AGIs $25k-50k, 153.0% for AGIs $50k-75k, 213.2% for AGIs $75k-100k, 914.1% for AGIs $100k-200k)
Total itemized deductions: $25,840 (reported on 3.7% of returns)
Here:
$25,840
State:
$33,000
(% of AGI for various income ranges: 15.7% for AGIs below $25k, 69.2% for AGIs $25k-50k, 373.6% for AGIs $50k-75k, 543.2% for AGIs $75k-100k, 1350.0% for AGIs $100k-200k)
Charity contributions: $10,442 (reported on 3.0% of returns)
Here:
$10,442
State:
$12,044
(% of AGI for various income ranges: 2.6% for AGIs below $25k, 18.9% for AGIs $25k-50k, 98.0% for AGIs $50k-75k, 183.7% for AGIs $75k-100k, 727.0% for AGIs $100k-200k)
Taxes paid: $6,153 (reported on 3.7% of returns)
53216:
$6,153
State:
$8,228
(% of AGI for various income ranges: 2.9% for AGIs below $25k, 12.9% for AGIs $25k-50k, 84.0% for AGIs $50k-75k, 150.0% for AGIs $75k-100k, 357.8% for AGIs $100k-200k)
Earned income credit: $2,834 (reported on 34.2% of returns)
Here:
$2,834
State:
$2,155
(% of AGI for various income ranges: 182.8% for AGIs below $25k, 115.1% for AGIs $25k-50k, 1.9% for AGIs $50k-75k)
Percentage of individuals using paid preparers for their 2020 taxes: 91.6%
Here:
92%
State:
94%
(% for various income ranges: 92.8% for AGIs below $25k, 91.7% for AGIs $25k-50k, 88.4% for AGIs $50k-75k, 90.9% for AGIs $75k-100k, 87.9% for AGIs $100k-200k, 80.0% for AGIs over 200k)
Averages for the 2012 tax year for zip code 53216, filed in 2013:
Average Adjusted Gross Income (AGI) in 2012: $31,919 (Individual Income Tax Returns)
Here:
$31,919
State:
$57,939
Salary/wage: $28,923 (reported on 87.1% of returns)
Here:
$28,923
State:
$48,248
(% of AGI for various income ranges: 76.4% for AGIs below $25k, 86.7% for AGIs $25k-50k, 80.4% for AGIs $50k-75k, 80.3% for AGIs $75k-100k, 74.6% for AGIs $100k-200k, 24.3% for AGIs over 200k)
Taxable interest for individuals: $382 (reported on 16.1% of returns)
This zip code:
$382
Wisconsin:
$1,224
(% of AGI for various income ranges: 0.3% for AGIs below $25k, 0.1% for AGIs $25k-50k, 0.2% for AGIs $50k-75k, 0.2% for AGIs $75k-100k, 0.2% for AGIs $100k-200k, 0.2% for AGIs over 200k)
Ordinary dividends: $1,810 (reported on 6.4% of returns)
Here:
$1,810
State:
$5,137
(% of AGI for various income ranges: 0.3% for AGIs below $25k, 0.2% for AGIs $25k-50k, 0.3% for AGIs $50k-75k, 0.5% for AGIs $75k-100k, 0.8% for AGIs $100k-200k)
Net capital gain/loss in AGI: +$5,155 (reported on 3.4% of returns)
Here:
+$5,155
State:
+$11,137
(% of AGI for various income ranges: 0.2% for AGIs $50k-75k, 0.3% for AGIs $75k-100k, 3.6% for AGIs $100k-200k)
Profit/loss from business: +$7,582 (reported on 12.6% of returns)
Here:
+$7,582
State:
+$11,943
(% of AGI for various income ranges: 9.3% for AGIs below $25k, 1.0% for AGIs $25k-50k, 0.6% for AGIs $50k-75k, 1.2% for AGIs $75k-100k, 3.1% for AGIs $100k-200k)
Taxable individual retirement arrangement distribution: $9,851 (reported on 5.5% of returns)
53216:
$9,851
Wisconsin:
$14,087
(% of AGI for various income ranges: 1.3% for AGIs below $25k, 1.2% for AGIs $25k-50k, 1.9% for AGIs $50k-75k, 2.3% for AGIs $75k-100k, 3.0% for AGIs $100k-200k)
Total itemized deductions: $16,383 (26% of AGI, reported on 22.0% of returns)
Here:
$16,383
State:
$22,257
Here:
25.9% of AGI
State:
20.1% of AGI
(% of AGI for various income ranges: 6.4% for AGIs below $25k, 9.5% for AGIs $25k-50k, 13.7% for AGIs $50k-75k, 15.3% for AGIs $75k-100k, 16.3% for AGIs $100k-200k, 11.2% for AGIs over 200k)
Charity contributions: $4,004 (reported on 17.9% of returns)
Here:
$4,004
State:
$3,370
(% of AGI for various income ranges: 0.8% for AGIs below $25k, 1.6% for AGIs $25k-50k, 2.8% for AGIs $50k-75k, 3.5% for AGIs $75k-100k, 4.1% for AGIs $100k-200k, 3.3% for AGIs over 200k)
Taxes paid: $6,298 (reported on 21.9% of returns)
53216:
$6,298
State:
$10,731
(% of AGI for various income ranges: 1.9% for AGIs below $25k, 3.4% for AGIs $25k-50k, 5.3% for AGIs $50k-75k, 6.2% for AGIs $75k-100k, 7.2% for AGIs $100k-200k, 5.0% for AGIs over 200k)
Earned income credit: $2,746 (reported on 37.9% of returns)
Here:
$2,746
State:
$2,094
(% of AGI for various income ranges: 12.5% for AGIs below $25k, 1.7% for AGIs $25k-50k)
Percentage of individuals using paid preparers for their 2012 taxes: 42.3%
Here:
42%
State:
54%
(% for various income ranges: 40.1% for AGIs below $25k, 41.2% for AGIs $25k-50k, 47.2% for AGIs $50k-75k, 50.7% for AGIs $75k-100k, 55.6% for AGIs $100k-200k, 100.0% for AGIs over 200k)
Averages for the 2004 tax year for zip code 53216, filed in 2005:
Average Adjusted Gross Income (AGI) in 2004: $30,323 (Individual Income Tax Returns)
Here:
$30,323
State:
$47,735
Salary/wage: $29,137 (reported on 89.7% of returns)
Here:
$29,137
State:
$41,540
(% of AGI for various income ranges: 93.8% for AGIs below $10k, 83.6% for AGIs $10k-25k, 89.8% for AGIs $25k-50k, 86.1% for AGIs $50k-75k, 87.1% for AGIs $75k-100k, 75.5% for AGIs over 100k)
Taxable interest for individuals: $831 (reported on 25.9% of returns)
This zip code:
$831
Wisconsin:
$1,420
(% of AGI for various income ranges: 1.4% for AGIs below $10k, 0.7% for AGIs $10k-25k, 0.5% for AGIs $25k-50k, 0.7% for AGIs $50k-75k, 0.7% for AGIs $75k-100k, 1.2% for AGIs over 100k)
Taxable dividends: $1,514 (reported on 10.4% of returns)
Here:
$1,514
State:
$2,869
(% of AGI for various income ranges: 0.9% for AGIs below $10k, 0.3% for AGIs $10k-25k, 0.4% for AGIs $25k-50k, 0.4% for AGIs $50k-75k, 0.7% for AGIs $75k-100k, 1.2% for AGIs over 100k)
Net capital gain/loss: +$4,382 (reported on 6.6% of returns)
Here:
+$4,382
State:
+$9,569
(% of AGI for various income ranges: -0.2% for AGIs below $10k, 0.1% for AGIs $10k-25k, 0.4% for AGIs $25k-50k, 1.1% for AGIs $50k-75k, 0.3% for AGIs $75k-100k, 5.3% for AGIs over 100k)
Profit/loss from business: +$6,271 (reported on 9.0% of returns)
Here:
+$6,271
State:
+$10,417
(% of AGI for various income ranges: 7.7% for AGIs below $10k, 3.3% for AGIs $10k-25k, 1.1% for AGIs $25k-50k, 1.2% for AGIs $50k-75k, 1.3% for AGIs $75k-100k, 2.3% for AGIs over 100k)
IRA payment deduction: $2,000 (reported on 1.0% of returns)
53216:
$2,000
Wisconsin:
$2,900
Self-employed pension: $7,364 (reported on 0.2% of returns)
Here:
$7,364
Wisconsin:
$11,934
Total itemized deductions: $13,823 (26% of AGI, reported on 28.6% of returns)
Here:
$13,823
State:
$18,160
Here:
25.5% of AGI
State:
21.1% of AGI
(% of AGI for various income ranges: 8.4% for AGIs below $10k, 8.0% for AGIs $10k-25k, 12.0% for AGIs $25k-50k, 15.7% for AGIs $50k-75k, 16.8% for AGIs $75k-100k, 16.5% for AGIs over 100k)
Charity contributions deductions: $3,229 (6% of AGI, reported on 24.4% of returns)
Here:
$3,229
State:
$2,711
Here:
5.7% of AGI
State:
3.0% of AGI
(% of AGI for various income ranges: 0.7% for AGIs below $10k, 1.1% for AGIs $10k-25k, 2.2% for AGIs $25k-50k, 3.3% for AGIs $50k-75k, 3.7% for AGIs $75k-100k, 4.5% for AGIs over 100k)
Total tax: $3,643 (reported on 62.9% of returns)
53216:
$3,643
State:
$7,114
(% of AGI for various income ranges: 2.1% for AGIs below $10k, 3.2% for AGIs $10k-25k, 6.2% for AGIs $25k-50k, 9.1% for AGIs $50k-75k, 10.5% for AGIs $75k-100k, 14.5% for AGIs over 100k)
Earned income credit: $1,919 (reported on 32.3% of returns)
Here:
$1,919
State:
$1,544
Percentage of individuals using paid preparers for their 2004 taxes: 61.9%
Here:
62%
State:
57%
(% for various income ranges: 60.5% for AGIs below $10k, 67.3% for AGIs $10k-25k, 58.7% for AGIs $25k-50k, 59.7% for AGIs $50k-75k, 58.6% for AGIs $75k-100k, 60.6% for AGIs over 100k)
Likely homosexual households (counted as self-reported same-sex unmarried-partner households)
Lesbian couples: 0.0% of all households
Gay men: 0.1% of all households
Household received Food Stamps/SNAP in the past 12 months: 4,779 Household did not receive Food Stamps/SNAP in the past 12 months: 8,256
Women who had a birth in the past 12 months: 384 (77 now married, 303 unmarried) Women who did not have a birth in the past 12 months: 7,390 (1,355 now married, 6,035 unmarried)
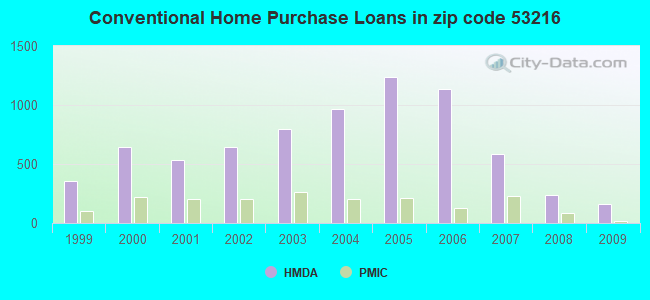
Housing units in zip code 53216 with a mortgage: 3,690 (285 second mortgage, 189 both second mortgage and home equity loan) Houses without a mortgage: 45
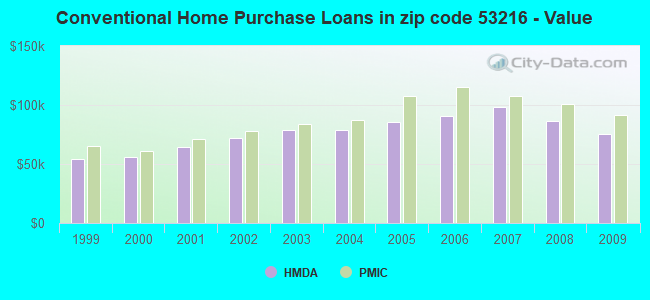
Median monthly owner costs for units with a mortgage: $1,231 Median monthly owner costs for units without a mortgage: $516
Residents with income below the poverty level in 2022:
This zip code:
22.0%
Whole state:
10.7%
Residents with income below 50% of the poverty level in 2022:
This zip code:
12.3%
Whole state:
5.7%
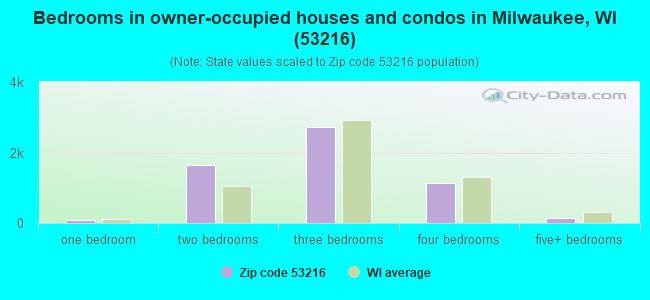
Median number of rooms in houses and condos:
Here:
5.8
State:
6.5
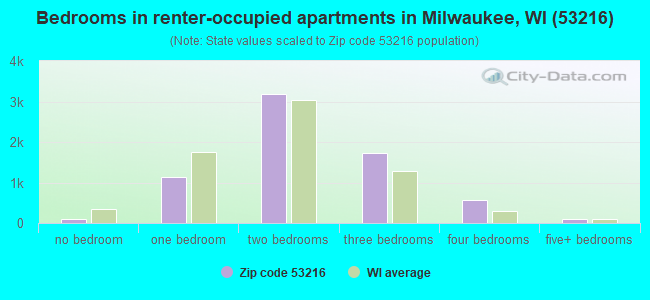
Median number of rooms in apartments:
Here:
4.7
State:
4.1
Notable locations in this zip code not listed on our city pages
Notable locations in zip code 53216: Concordia Sub-Station (A), Paratech Ambulance Service Milwaukee Division Station 6 (B), Milwaukee Fire Department Engine 36 (C), Seventh District Police Station (D), Milwaukee Fire Department Engine 24 (E). Display/hide their locations on the map
Churches in zip code 53216 include: Trinity Presbyterian Church (A), First Reformed Church (B), First Pilgrim Holiness Church (C), Capitol Drive Lutheran Church (D), The Church of Jesus Christ of Latter Day Saints (E), Temple Baptist Church (F), Wayside Congregational Church (G), Pentecost Evangelical Lutheran Church (H), Parklawn Assembly of God Church (I). Display/hide their locations on the map
1,873 married couples with children.
5,294 single-parent households (834 men, 4,460 women).
92.8% of residents of 53216 zip code speak English at home.
3.6% of residents speak Spanish at home (81% very well, 3% well, 15% not well, 1% not at all).
0.5% of residents speak other Indo-European language at home (85% very well, 5% well, 11% not well).
2.0% of residents speak Asian or Pacific Island language at home (45% very well, 14% well, 40% not well, 2% not at all).
0.5% of residents speak other language at home (62% very well, 26% well, 12% not at all).
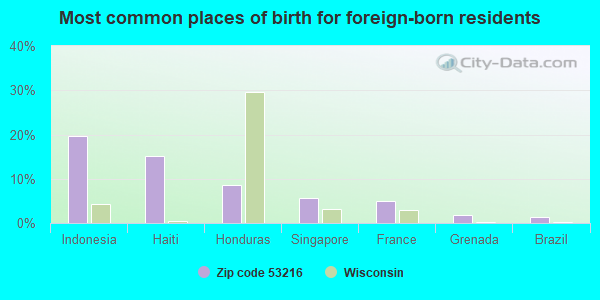
Foreign born population: 1,128 (3.6%) (59.0% of them are naturalized citizens)
Major facilities with environmental interests located in this zip code:
CITATION CORPORATION-INTERSTATE FORGING INDUSTRIES MIDWEST (4051 NORTH 27TH STREET in MILWAUKEE, WI)
CRITERIA AND HAZARDOUS AIR POLLUTANT INVENTORY (Inventory of air pollution sources) Small Quantity Generators, between 100 kg and 1000 kg of hazardous waste/month (Resource Conservation and Recovery Act (tracking hazardous waste)) - notification TRI REPORTER (Tracking of toxic chemicals releasing facilities) STATE MASTER (Wisconsin database) - TRIS-53216NTRST4051N, TRI REPORTER, NEI-WI241019020, AIR PROGRAM Business SIC classification: IRON AND STEEL FORGINGS; INTERNATIONAL AFFAIRS Business NAICS classification: IRON AND STEEL FORGING.; IRON AND STEEL FORGING. Organizations: CITATION INTERSTATE FORGING MIDWEST Alternative names: INTERSTATE FORGING IND. INC.
CITGO #205 (3381 N 35TH ST in MILWAUKEE, WI)
AIR MINOR (AIRS/AFS) Small Quantity Generators, between 100 kg and 1000 kg of hazardous waste/month (Resource Conservation and Recovery Act (tracking hazardous waste)) - notification STATE MASTER (Wisconsin database) - RCRAINFO-WIR000032086, SQG Business SIC classification: GASOLINE SERVICE STATIONS Organizations: DHALIWALL CHILDREN TRUST 80 (CONTACT/OWNER)
Alternative names: DARSHANS GAS INCORPORATED
CARRIAGE HOUSE CLEANERS (3923 W CAPITOL DR in MILWAUKEE, WI)
Small Quantity Generators, between 100 kg and 1000 kg of hazardous waste/month (Resource Conservation and Recovery Act (tracking hazardous waste)) - notification STATE MASTER (Wisconsin database) - RCRAINFO-WID093015808, SQG Business SIC classification: DRYCLEANING PLANTS, EXCEPT RUG CLEANING Organizations: CASS CHARLES (CONTACT/OWNER)
Alternative names: ONE HOUR MARTINIZING
7TH DIST POLICE STN (3626 W FOND DU LAC AVE in MILWAUKEE, WI)
Small Quantity Generators, between 100 kg and 1000 kg of hazardous waste/month (Resource Conservation and Recovery Act (tracking hazardous waste)) - notification STATE MASTER (Wisconsin database) - RCRAINFO-WID988642559, SQG Business NAICS classification: POLICE PROTECTION. Organizations: MILWAUKEE CITY OF (CONTACT/OWNER)
ACA MGMT SERV AMOCO (3114 N SHERMAN BLVD in MILWAUKEE, WI)
Small Quantity Generators, between 100 kg and 1000 kg of hazardous waste/month (Resource Conservation and Recovery Act (tracking hazardous waste)) - notification STATE MASTER (Wisconsin database) - RCRAINFO-WID988616413, CESQG Organizations: AMOCO OIL CO (CONTACT/OWNER)
BULK PETROLEUM CORP (4137 W FOND DU LAC AVE in MILWAUKEE, WI)
Conditionally Exempt Small Quantity Generators, less than 100 kg/month of hazardous waste (Resource Conservation and Recovery Act (tracking hazardous waste)) - notification STATE MASTER (Wisconsin database) - RCRAINFO-WID988640280, CESQG Organizations: DARSHAN S DHALIWAL (CONTACT/OWNER)
Alternative names: BULK PETROLEUM CORP #214
CAPITOL COURT ASSN (5500 W CAPITOL DR in MILWAUKEE, WI)
Conditionally Exempt Small Quantity Generators, less than 100 kg/month of hazardous waste (Resource Conservation and Recovery Act (tracking hazardous waste)) - notification STATE MASTER (Wisconsin database) - RCRAINFO-WID988626701, CESQG Organizations: CAPITOL COURT CORP (CONTACT/OWNER)
Alternative names: CAPITOL COURT ASSOC
AMATEUR ELECTRONIC SUPPLY (4828 W FOND DU LAC AVE in MILWAUKEE, WI)
Conditionally Exempt Small Quantity Generators, less than 100 kg/month of hazardous waste (Resource Conservation and Recovery Act (tracking hazardous waste)) STATE MASTER (Wisconsin database) - RCRAINFO-WID988596714, CESQG Business SIC classification: ELECTRONIC PARTS AND EQUIPMENT
BENJAMIN CARSON ACAD OF SCI (4920 W CAPITOL DR in MILWAUKEE, WI)
(National Center for Education Statistics) - STATE ID-0108 Organizations: MILWAUKEE SCH DIST (SCHOOL DISTRICT)
CAREER YOUTH DVLP SCH EXCEL (3026 W CONCORDIA AVE in MILWAUKEE, WI)
(National Center for Education Statistics) - STATE ID-0282 Organizations: MILWAUKEE SCH DIST (SCHOOL DISTRICT)
CENTRAL CITY CYBERSCHOOL (4301 N 44TH ST in MILWAUKEE, WI)
(National Center for Education Statistics) - STATE ID-1211
CLEMENS EL (3600 W HOPE AVE in MILWAUKEE, WI)
(National Center for Education Statistics) - STATE ID-0114 Organizations: MILWAUKEE SCH DIST (SCHOOL DISTRICT)
A1 DRIVESHAFT CO INC (3453 N 35TH ST in MILWAUKEE, WI)
(Resource Conservation and Recovery Act (tracking hazardous waste)) Organizations: GEIER RALPH (CONTACT/OWNER)
Housing units lacking complete plumbing facilities: 1.6% Housing units lacking complete kitchen facilities: 4.6%
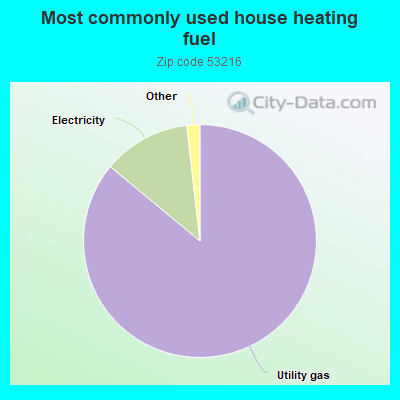
86.1%Utility gas
12.2%Electricity
0.7%Fuel oil, kerosene, etc.
0.6%Bottled, tank, or LP gas
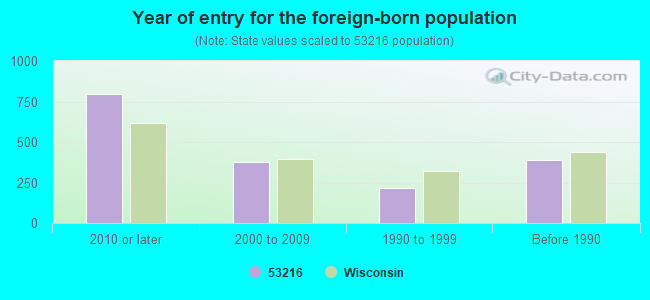
Population in 1990: 34,881.
Place of birth for U.S.-born residents:
This state: 21,772
Northeast: 302
Midwest: 3,185
South: 3,829
West: 232
58% of the 53216 zip code residents lived in the same house 5 years ago. Out of people who lived in different houses, 84% lived in this county. Out of people who lived in different counties, 50% lived in Wisconsin.
88% of the 53216 zip code residents lived in the same house 1 year ago. Out of people who lived in different houses, 79% moved from this county. Out of people who lived in different houses, 6% moved from different county within same state. Out of people who lived in different houses, 6% moved from different state. Out of people who lived in different houses, 2% moved from abroad.
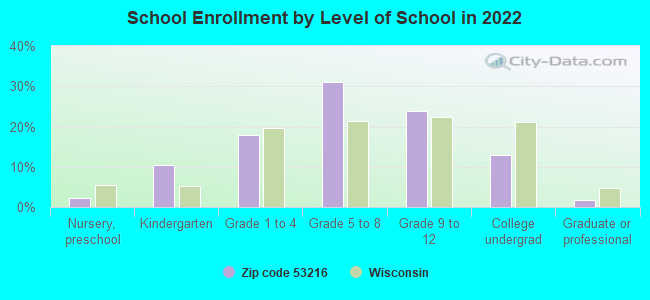
Private vs. public school enrollment:
Students in private schools in grades 1 to 8 (elementary and middle school): 1,130
Here:
27.2%
Wisconsin:
16.7%
Students in private schools in grades 9 to 12 (high school): 208
Here:
10.4%
Wisconsin:
12.5%
Students in private undergraduate colleges: 192
Here:
17.7%
Wisconsin:
17.5%
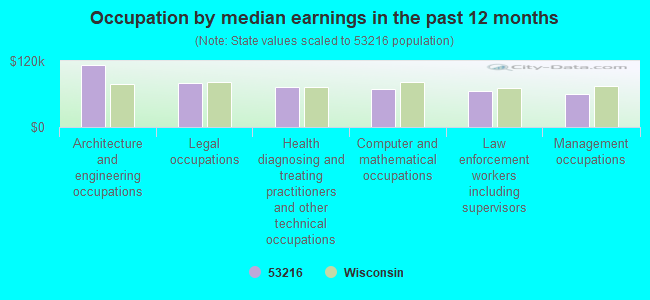
Occupation by median earnings in the past 12 months ($)
112,575Architecture and engineering occupations
79,480Legal occupations
72,785Health diagnosing and treating practitioners and other technical occupations
68,609Computer and mathematical occupations
65,477Law enforcement workers including supervisors
60,564Management occupations
Companies with federal contracts located in this zip code (MILWAUKEE, WI):
D R S POWER & CONTROL TECHNOLO (4265 N 30TH ST) : $2,352,959 in 58 contractsfrom 2002 to 2006
Contracts for Coils and Transformers, Electrical Control Equipment, Fans, Air Circulators, and Blower Equipment, Electrical and Electronic assemblies, Boards, Cards, and Associated Hardware, and moreby Navy Signed by year:2000: $0; 2001: $0; 2002: $780,583; 2003: $479,739; 2004: $291,409; 2005: $473,377; 2006: $327,851.
Biggest contracts:
$345,575 with Navy for Coils and Transformers. Signed on 2003-05-29. Completion date: 2004-01-24.
$214,017 with Navy for Electrical Control Equipment. Signed on 2004-02-27. Completion date: 2004-09-30.
$184,701 with Navy for Coils and Transformers. Signed on 2002-10-21. Completion date: 2003-03-10.
$156,981 with Navy for Fans, Air Circulators, and Blower Equipment. Signed on 2002-10-18. Completion date: 2003-06-15.
EATON CORPORATION (4201 N 27TH ST) : $631,446 in 10 contractsfrom 2000 to 2005
Contracts for Optoelectronic Devices and Associated Hardware, Microcircuits, Electronic, Hand Tools, Nonedged, Nonpowered, Switches, and moreby Navy Signed by year:2000: $616,566; 2001: $0; 2002: $0; 2003: $0; 2004: $0; 2005: $14,880; 2006: $0.
Biggest contracts:
$148,800 with Navy for Optoelectronic Devices and Associated Hardware. Signed on 2000-02-25. Completion date: 2000-02-23.
$148,685 with Navy for Microcircuits, Electronic. Signed on 2000-04-25. Completion date: 2000-10-23.
$86,111 with Navy for Hand Tools, Nonedged, Nonpowered. Signed on 2000-01-31. Completion date: 2000-10-27.
$49,600 with Navy for Optoelectronic Devices and Associated Hardware. Signed on 2000-04-20. Completion date: 2000-05-22.
CONCENTRIX + LTD (4044 N 31ST ST UNIT A; small business)
$602,397 with Defense Logistics Agency for Guns, through 30 mm. Signed on 2004-04-26. Completion date: 2005-01-21.
WILKINSONCAPSTRAN INC (3813 N 35TH ST; small business)
$10,400 with Army for Maintenance, Repair or Alteration of Real Property -- Tank Automotive Facilities. Signed on 2006-04-12. Completion date: 2006-04-21.
DRS POWER & CONTROL TECHNOLOGI (4265 N 30TH STREET) : $9,806 in 3 contractsin 2006
$47,544 with Navy for Electrical Control Equipment. Signed on 2006-05-04. Completion date: 2006-09-01.
$9,806 with Defense Logistics Agency for Time Measuring Instruments. Signed on 2006-02-07. Completion date: 2006-04-09.
-$47,544 with Navy for Electrical Control Equipment. Signed on 2006-05-25. Completion date: 2006-05-31.
Top industries in this zip code by the number of employees in 2005:
2005 - 2018 National Fire Incident Reporting System (NFIRS) incidents
According to the data from the years 2005 - 2018 the average number of fire incidents per year is 107. The highest number of fire incidents - 181 took place in 2012, and the least - 0 in 2006. The data has an increasing trend.
When looking into fire subcategories, the most reports belonged to: Structure Fires (43.5%), and Outside Fires (27.8%).
Fire incident types reported to NFIRS in Zip Code 53216
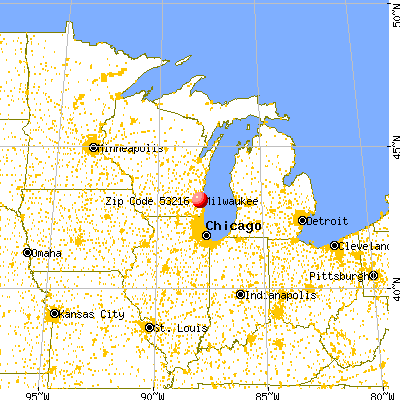


 Nearest zip codes: 53210, 53218, 53208, 53206, 53213, 53209.
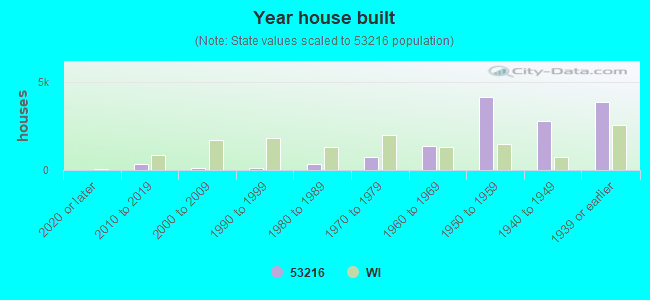


 According to the data from the years 2005 - 2018 the average number of fire incidents per year is 107. The highest number of fire incidents - 181 took place in 2012, and the least - 0 in 2006. The data has an increasing trend.
 When looking into fire subcategories, the most reports belonged to: Structure Fires (43.5%), and Outside Fires (27.8%).