Estimated zip code population in 2022: 41,848 Zip code population in 2010: 40,625 Zip code population in 2000: 40,513
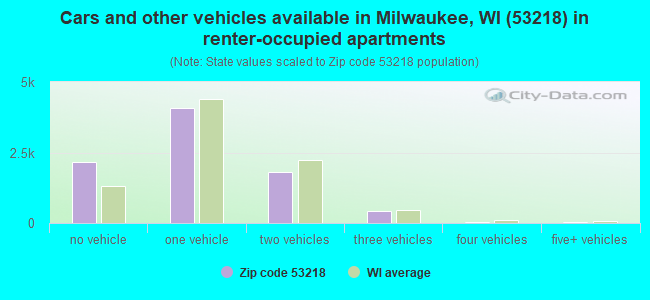
Houses and condos: 15,804 Renter-occupied apartments: 8,531
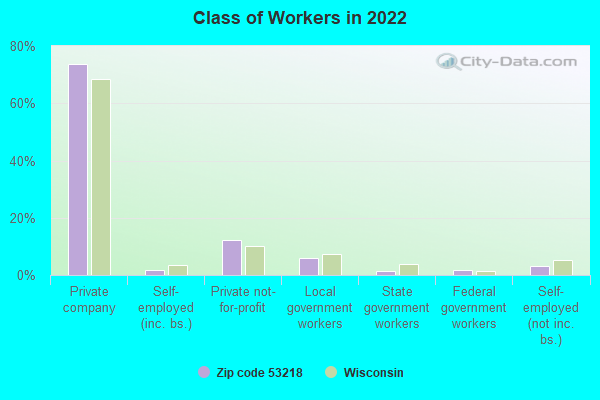
% of renters here:
58%
State:
32%
March 2022 cost of living index in zip code 53218: 96.6 (near average, U.S. average is 100)
Land area: 5.9 sq. mi. Water area: 0.0 sq. mi.
Population density: 7,126 people per square mile
(high).
OSM Map
General Map
Google Map
MSN Map
OSM Map
General Map
Google Map
MSN Map
OSM Map
General Map
Google Map
MSN Map
OSM Map
General Map
Google Map
MSN Map
Please wait while loading the map...
Real estate property taxes paid for housing units in 2022:
This zip code:
1.9% ($2,209)
Wisconsin:
1.4% ($3,497)
Median real estate property taxes paid for housing units with mortgages in 2022: $2,229 (1.8%) Median real estate property taxes paid for housing units with no mortgage in 2022: $2,174 (2.0%)
Business Search- 14 Million verified businesses
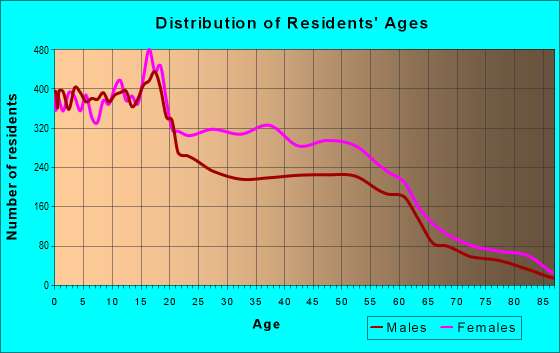
Males: 19,806
(47.3%)
Females: 22,039
(52.7%)
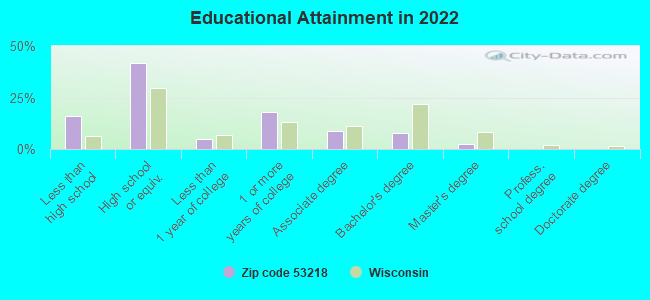
For population 25 years and over in 53218:
High school or higher: 82.2%
Bachelor's degree or higher: 10.4%
Graduate or professional degree: 2.7%
Unemployed: 10.0%
Mean travel time to work (commute): 22.9 minutes
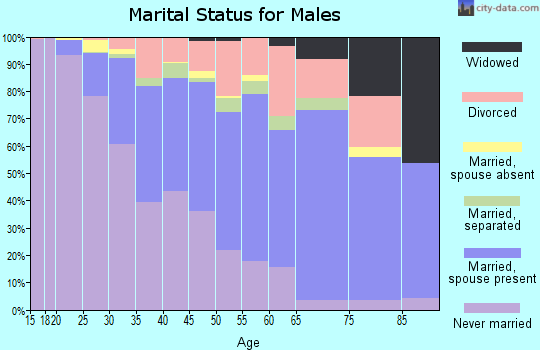
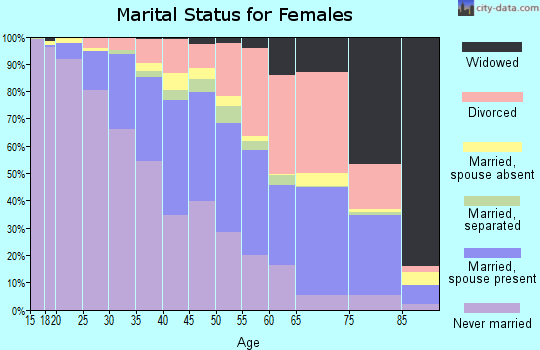
For population 15 years and over in 53218:
Never married: 60.1%
Now married: 25.1%
Separated: 2.1%
Widowed: 4.4%
Divorced: 8.4%
Zip code 53218 compared to state average:
Median household income below state average.
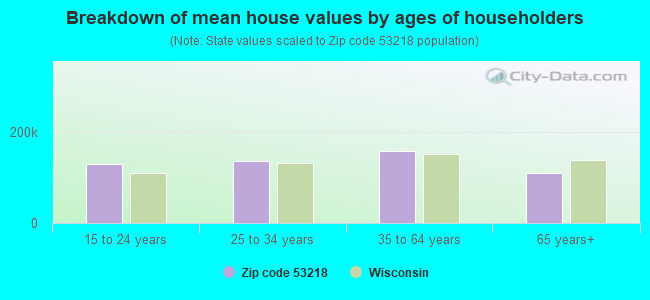
Median house value below state average.
Unemployed percentage significantly above state average.
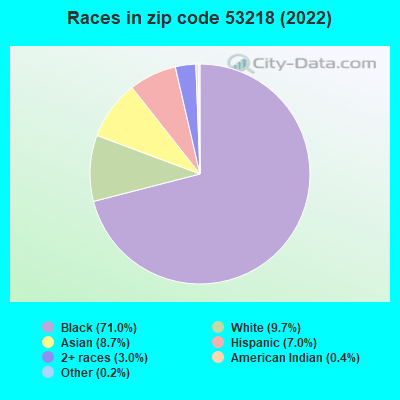
Black race population percentage significantly above state average.
Median age significantly below state average.
Renting percentage above state average.
Length of stay since moving in above state average.
Percentage of population with a bachelor's degree or higher significantly below state average.
Averages for the 2020 tax year for zip code 53218, filed in 2021:
Average Adjusted Gross Income (AGI) in 2020: $32,253 (Individual Income Tax Returns)
Here:
$32,253
State:
$72,319
Salary/wage: $30,114 (reported on 89.2% of returns)
Here:
$30,114
State:
$59,242
(% of AGI for various income ranges: 1220.3% for AGIs below $25k, 4056.1% for AGIs $25k-50k, 7600.0% for AGIs $50k-75k, 11216.4% for AGIs $75k-100k, 18683.9% for AGIs $100k-200k)
Taxable interest for individuals: $428 (reported on 10.4% of returns)
This zip code:
$428
Wisconsin:
$1,431
(% of AGI for various income ranges: 2.6% for AGIs below $25k, 3.6% for AGIs $25k-50k, 18.2% for AGIs $50k-75k, 20.5% for AGIs $75k-100k, 44.8% for AGIs $100k-200k)
Ordinary dividends: $1,213 (reported on 3.6% of returns)
Here:
$1,213
State:
$6,481
(% of AGI for various income ranges: 2.7% for AGIs below $25k, 3.1% for AGIs $25k-50k, 11.6% for AGIs $50k-75k, 24.8% for AGIs $75k-100k, 68.3% for AGIs $100k-200k)
Net capital gain/loss in AGI: +$3,945 (reported on 2.8% of returns)
Here:
+$3,945
State:
+$18,329
(% of AGI for various income ranges: 0.9% for AGIs below $25k, 4.3% for AGIs $25k-50k, 21.7% for AGIs $50k-75k, 110.0% for AGIs $75k-100k, 390.9% for AGIs $100k-200k)
Profit/loss from business: +$4,849 (reported on 11.4% of returns)
Here:
+$4,849
State:
+$14,562
(% of AGI for various income ranges: 81.0% for AGIs below $25k, 25.5% for AGIs $25k-50k, 83.2% for AGIs $50k-75k, 145.2% for AGIs $75k-100k, 507.4% for AGIs $100k-200k)
Taxable individual retirement arrangement distribution: $9,795 (reported on 3.5% of returns)
53218:
$9,795
Wisconsin:
$19,348
(% of AGI for various income ranges: 15.4% for AGIs below $25k, 20.8% for AGIs $25k-50k, 101.5% for AGIs $50k-75k, 223.6% for AGIs $75k-100k, 710.0% for AGIs $100k-200k)
Total itemized deductions: $23,483 (reported on 2.8% of returns)
Here:
$23,483
State:
$33,000
(% of AGI for various income ranges: 9.3% for AGIs below $25k, 58.2% for AGIs $25k-50k, 223.5% for AGIs $50k-75k, 461.4% for AGIs $75k-100k, 1283.9% for AGIs $100k-200k)
Charity contributions: $8,921 (reported on 2.2% of returns)
Here:
$8,921
State:
$12,044
(% of AGI for various income ranges: 1.7% for AGIs below $25k, 14.5% for AGIs $25k-50k, 71.8% for AGIs $50k-75k, 130.5% for AGIs $75k-100k, 509.1% for AGIs $100k-200k)
Taxes paid: $5,621 (reported on 2.8% of returns)
53218:
$5,621
State:
$8,228
(% of AGI for various income ranges: 1.8% for AGIs below $25k, 10.4% for AGIs $25k-50k, 53.8% for AGIs $50k-75k, 136.8% for AGIs $75k-100k, 340.0% for AGIs $100k-200k)
Earned income credit: $2,910 (reported on 38.6% of returns)
Here:
$2,910
State:
$2,155
(% of AGI for various income ranges: 197.9% for AGIs below $25k, 127.6% for AGIs $25k-50k, 1.8% for AGIs $50k-75k)
Percentage of individuals using paid preparers for their 2020 taxes: 92.4%
Here:
92%
State:
94%
(% for various income ranges: 93.0% for AGIs below $25k, 92.7% for AGIs $25k-50k, 91.3% for AGIs $50k-75k, 91.5% for AGIs $75k-100k, 87.2% for AGIs $100k-200k, 66.7% for AGIs over 200k)
Averages for the 2012 tax year for zip code 53218, filed in 2013:
Average Adjusted Gross Income (AGI) in 2012: $28,509 (Individual Income Tax Returns)
Here:
$28,509
State:
$57,939
Salary/wage: $26,851 (reported on 88.2% of returns)
Here:
$26,851
State:
$48,248
(% of AGI for various income ranges: 77.6% for AGIs below $25k, 89.1% for AGIs $25k-50k, 84.6% for AGIs $50k-75k, 81.7% for AGIs $75k-100k, 73.7% for AGIs $100k-200k)
Taxable interest for individuals: $392 (reported on 14.7% of returns)
This zip code:
$392
Wisconsin:
$1,224
(% of AGI for various income ranges: 0.3% for AGIs below $25k, 0.2% for AGIs $25k-50k, 0.2% for AGIs $50k-75k, 0.1% for AGIs $75k-100k)
Ordinary dividends: $1,168 (reported on 5.5% of returns)
Here:
$1,168
State:
$5,137
(% of AGI for various income ranges: 0.3% for AGIs below $25k, 0.1% for AGIs $25k-50k, 0.2% for AGIs $50k-75k, 0.3% for AGIs $75k-100k, 0.4% for AGIs $100k-200k)
Net capital gain/loss in AGI: +$816 (reported on 2.9% of returns)
Here:
+$816
State:
+$11,137
(% of AGI for various income ranges: 0.1% for AGIs $50k-75k, 0.6% for AGIs $100k-200k)
Profit/loss from business: +$7,215 (reported on 11.6% of returns)
Here:
+$7,215
State:
+$11,943
(% of AGI for various income ranges: 9.2% for AGIs below $25k, 0.5% for AGIs $25k-50k, 0.6% for AGIs $50k-75k, 1.1% for AGIs $75k-100k, 1.3% for AGIs $100k-200k)
Taxable individual retirement arrangement distribution: $9,110 (reported on 4.8% of returns)
53218:
$9,110
Wisconsin:
$14,087
(% of AGI for various income ranges: 1.1% for AGIs below $25k, 1.2% for AGIs $25k-50k, 1.5% for AGIs $50k-75k, 2.2% for AGIs $75k-100k, 3.4% for AGIs $100k-200k)
Total itemized deductions: $14,415 (26% of AGI, reported on 18.6% of returns)
Here:
$14,415
State:
$22,257
Here:
26.3% of AGI
State:
20.1% of AGI
(% of AGI for various income ranges: 4.3% for AGIs below $25k, 8.6% for AGIs $25k-50k, 12.6% for AGIs $50k-75k, 14.2% for AGIs $75k-100k, 14.3% for AGIs $100k-200k)
Charity contributions: $3,233 (reported on 14.3% of returns)
Here:
$3,233
State:
$3,370
(% of AGI for various income ranges: 0.5% for AGIs below $25k, 1.3% for AGIs $25k-50k, 2.5% for AGIs $50k-75k, 2.9% for AGIs $75k-100k, 2.7% for AGIs $100k-200k)
Taxes paid: $5,472 (reported on 18.5% of returns)
53218:
$5,472
State:
$10,731
(% of AGI for various income ranges: 1.1% for AGIs below $25k, 3.3% for AGIs $25k-50k, 4.8% for AGIs $50k-75k, 5.8% for AGIs $75k-100k, 6.2% for AGIs $100k-200k)
Earned income credit: $2,899 (reported on 42.2% of returns)
Here:
$2,899
State:
$2,094
(% of AGI for various income ranges: 13.8% for AGIs below $25k, 2.1% for AGIs $25k-50k)
Percentage of individuals using paid preparers for their 2012 taxes: 43.7%
Here:
44%
State:
54%
(% for various income ranges: 41.7% for AGIs below $25k, 44.4% for AGIs $25k-50k, 48.8% for AGIs $50k-75k, 51.7% for AGIs $75k-100k, 52.9% for AGIs $100k-200k)
Averages for the 2004 tax year for zip code 53218, filed in 2005:
Average Adjusted Gross Income (AGI) in 2004: $27,918 (Individual Income Tax Returns)
Here:
$27,918
State:
$47,735
Salary/wage: $26,906 (reported on 90.2% of returns)
Here:
$26,906
State:
$41,540
(% of AGI for various income ranges: 83.6% for AGIs below $10k, 84.0% for AGIs $10k-25k, 90.6% for AGIs $25k-50k, 87.7% for AGIs $50k-75k, 85.7% for AGIs $75k-100k, 73.7% for AGIs over 100k)
Taxable interest for individuals: $774 (reported on 25.0% of returns)
This zip code:
$774
Wisconsin:
$1,420
(% of AGI for various income ranges: 1.5% for AGIs below $10k, 0.9% for AGIs $10k-25k, 0.5% for AGIs $25k-50k, 0.7% for AGIs $50k-75k, 0.5% for AGIs $75k-100k, 0.6% for AGIs over 100k)
Taxable dividends: $1,090 (reported on 9.4% of returns)
Here:
$1,090
State:
$2,869
(% of AGI for various income ranges: 0.9% for AGIs below $10k, 0.4% for AGIs $10k-25k, 0.3% for AGIs $25k-50k, 0.3% for AGIs $50k-75k, 0.2% for AGIs $75k-100k, 1.1% for AGIs over 100k)
Net capital gain/loss: +$3,997 (reported on 5.6% of returns)
Here:
+$3,997
State:
+$9,569
(% of AGI for various income ranges: -0.3% for AGIs below $10k, 0.1% for AGIs $10k-25k, 0.2% for AGIs $25k-50k, 0.8% for AGIs $50k-75k, 1.4% for AGIs $75k-100k, 7.3% for AGIs over 100k)
Profit/loss from business: +$5,198 (reported on 7.5% of returns)
Here:
+$5,198
State:
+$10,417
(% of AGI for various income ranges: 6.1% for AGIs below $10k, 2.7% for AGIs $10k-25k, 0.9% for AGIs $25k-50k, 0.7% for AGIs $50k-75k, 0.9% for AGIs $75k-100k, 0.1% for AGIs over 100k)
IRA payment deduction: $1,745 (reported on 1.1% of returns)
53218:
$1,745
Wisconsin:
$2,900
Total itemized deductions: $12,665 (26% of AGI, reported on 25.5% of returns)
Here:
$12,665
State:
$18,160
Here:
26.3% of AGI
State:
21.1% of AGI
(% of AGI for various income ranges: 5.7% for AGIs below $10k, 6.6% for AGIs $10k-25k, 11.8% for AGIs $25k-50k, 14.0% for AGIs $50k-75k, 15.9% for AGIs $75k-100k, 15.7% for AGIs over 100k)
Charity contributions deductions: $2,553 (5% of AGI, reported on 20.7% of returns)
Here:
$2,553
State:
$2,711
Here:
5.1% of AGI
State:
3.0% of AGI
(% of AGI for various income ranges: 0.5% for AGIs below $10k, 0.9% for AGIs $10k-25k, 1.8% for AGIs $25k-50k, 2.4% for AGIs $50k-75k, 3.1% for AGIs $75k-100k, 3.3% for AGIs over 100k)
Total tax: $2,985 (reported on 60.4% of returns)
53218:
$2,985
State:
$7,114
(% of AGI for various income ranges: 1.6% for AGIs below $10k, 2.8% for AGIs $10k-25k, 5.9% for AGIs $25k-50k, 8.3% for AGIs $50k-75k, 10.1% for AGIs $75k-100k, 13.6% for AGIs over 100k)
Earned income credit: $1,955 (reported on 34.1% of returns)
Here:
$1,955
State:
$1,544
Percentage of individuals using paid preparers for their 2004 taxes: 60.9%
Here:
61%
State:
57%
(% for various income ranges: 59.0% for AGIs below $10k, 65.7% for AGIs $10k-25k, 58.1% for AGIs $25k-50k, 57.9% for AGIs $50k-75k, 57.9% for AGIs $75k-100k, 67.2% for AGIs over 100k)
Likely homosexual households (counted as self-reported same-sex unmarried-partner households)
Lesbian couples: 0.1% of all households
Gay men: 0.1% of all households
Household received Food Stamps/SNAP in the past 12 months: 6,347 Household did not receive Food Stamps/SNAP in the past 12 months: 9,003
Women who had a birth in the past 12 months: 491 (139 now married, 348 unmarried) Women who did not have a birth in the past 12 months: 10,358 (1,869 now married, 8,489 unmarried)
Housing units in zip code 53218 with a mortgage: 3,871 (238 second mortgage, 16 home equity loan, 181 both second mortgage and home equity loan) Houses without a mortgage: 111
Median monthly owner costs for units with a mortgage: $1,172 Median monthly owner costs for units without a mortgage: $509
Residents with income below the poverty level in 2022:
This zip code:
31.3%
Whole state:
10.7%
Residents with income below 50% of the poverty level in 2022:
This zip code:
15.2%
Whole state:
5.7%
Median number of rooms in houses and condos:
Here:
5.4
State:
6.5
Median number of rooms in apartments:
Here:
4.6
State:
4.1
Notable locations in this zip code not listed on our city pages
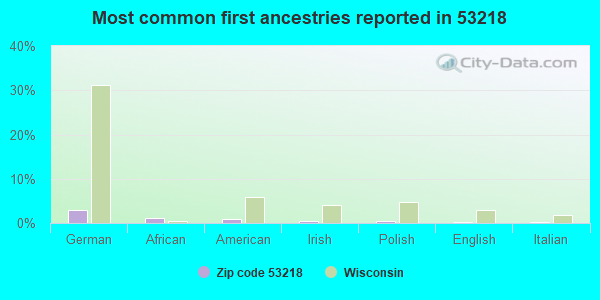
Parks in zip code 53218 include: Hampton Park (1), Columbus Park (2), William R McGovern Park (3), Wahl Park (4), Westlawn Playground (5). Display/hide their locations on the map
2,967 married couples with children.
8,563 single-parent households (1,379 men, 7,184 women).
88.0% of residents of 53218 zip code speak English at home.
3.2% of residents speak Spanish at home (65% very well, 20% well, 15% not well).
0.3% of residents speak other Indo-European language at home (91% very well, 6% well, 3% not well).
6.7% of residents speak Asian or Pacific Island language at home (49% very well, 17% well, 32% not well, 2% not at all).
1.2% of residents speak other language at home (97% very well, 3% well).
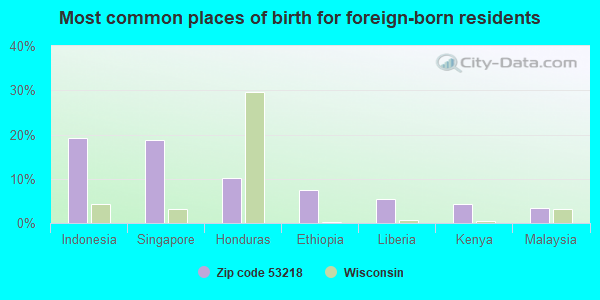
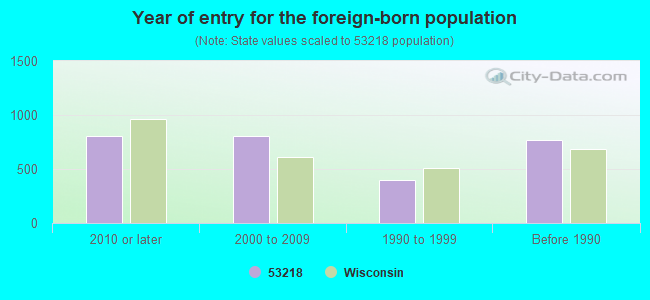
Foreign born population: 2,495 (6.0%) (74.0% of them are naturalized citizens)
Major facilities with environmental interests located in this zip code:
BULK PETROLEUM CORPORATION MILWAUKEE (6727 WEST VILLARD AVENUE in MILWAUKEE, WI)
AIR MINOR (AIRS/AFS) Small Quantity Generators, between 100 kg and 1000 kg of hazardous waste/month (Resource Conservation and Recovery Act (tracking hazardous waste)) STATE MASTER (Wisconsin database) - RCRAINFO-WID988568028, HAZARDOUS WASTE PROGRAM Business SIC classification: GASOLINE SERVICE STATIONS Organizations: HARSHINDER PAUL BHATIA (CONTACT/OPERATOR)
, DARSHAN DHALIWAL (CONTACT/OWNER)
Alternative names: DARSHANS GAS INCORPORATED, PHILLIPS 66 GAS STATION
7 ELEVEN #30499 (5835 W HAMPTON AVE in MILWAUKEE, WI)
(Resource Conservation and Recovery Act (tracking hazardous waste)) STATE MASTER (Wisconsin database) - RCRAINFO-WID988593059, SQG Business SIC classification: GASOLINE SERVICE STATIONS Business NAICS classification: GASOLINE STATIONS WITH CONVENIENCE STORES. Organizations: 7-ELEVEN INC (CONTACT/OWNER)
Alternative names: QUIK MART 30499
BRENNTAG GREAT LAKES LLC (8100 WEST FLORIST AVENUE in MILWAUKEE, WI)
(Resource Conservation and Recovery Act (tracking hazardous waste)) STATE MASTER (Wisconsin database) - RCRAINFO-WIR000110734, LQG Organizations: JAMES T BARRY CO INC / COLLIERS INTRNTL (CONTACT/OWNER)
ALL PRO TRANSMISSION INC (7501 W VILLARD in MILWAUKEE, WI)
Small Quantity Generators, between 100 kg and 1000 kg of hazardous waste/month (Resource Conservation and Recovery Act (tracking hazardous waste)) - notification STATE MASTER (Wisconsin database) - RCRAINFO-WID042774091, CESQG Business SIC classification: AUTOMOTIVE DEALERS
BERNARD IVAN (5284 NORTH 68TH STREET in MILWAUKEE, WI)
Conditionally Exempt Small Quantity Generators, less than 100 kg/month of hazardous waste (Resource Conservation and Recovery Act (tracking hazardous waste)) - notification STATE MASTER (Wisconsin database) - RCRAINFO-WIR000042036, CESQG
CHRISTIAN AUTO REPAIR SERVICE INC (4735 N 76TH ST in MILWAUKEE, WI)
Conditionally Exempt Small Quantity Generators, less than 100 kg/month of hazardous waste (Resource Conservation and Recovery Act (tracking hazardous waste)) - notification STATE MASTER (Wisconsin database) - RCRAINFO-WID056987928, CESQG Business SIC classification: GENERAL AUTOMOTIVE REPAIR SHOPS
ALUMATIC CORP (6353 N 64TH ST in MILWAUKEE, WI)
Conditionally Exempt Small Quantity Generators, less than 100 kg/month of hazardous waste (Resource Conservation and Recovery Act (tracking hazardous waste)) - notification STATE MASTER (Wisconsin database) - RCRAINFO-WID988622809, CESQG
APPLIED BIOCHEMISTS INCORPORATED (6120 WEST DOUGLAS AVENUE in MILWAUKEE, WI)
COMPLIANCE ACTIVITY (Tracking inspections of insecticide, fungicide, and rodenticide, and toxic substances) Business SIC classification: PESTICIDES AND AGRICULTURAL CHEMICALS Alternative names: APPLIED BIO-CHEMIST, APPLIES BIOCHEMISTS INC
BROWNING EL (5575 N 76TH ST in MILWAUKEE, WI)
(National Center for Education Statistics) - STATE ID-0092 Organizations: MILWAUKEE SCH DIST (SCHOOL DISTRICT)
AIRSAN CORP (4554 W WOOLWORTH AVE in MILWAUKEE, WI)
(Resource Conservation and Recovery Act (tracking hazardous waste)) Organizations: MAIERHOFER MAX (CONTACT/OWNER)
BARRETT WRECKING (FORMER) (6122 N 76TH ST in MILWAUKEE, WI)
(Resource Conservation and Recovery Act (tracking hazardous waste))
CAMP DRESSER AND MCKEE INC (6132 WEST FOND DU LAC AVENUE in MILWAUKEE, WI)
(Resource Conservation and Recovery Act (tracking hazardous waste))
ACCURATE TRANSMISSION SERVICE (7124 W FOND DU LAC in MILWAUKEE, WI)
Small Quantity Generators, between 100 kg and 1000 kg of hazardous waste/month (Resource Conservation and Recovery Act (tracking hazardous waste)) - notification Organizations: LEVIHN JOHN AND JEAN (CONTACT/OWNER)
Housing units lacking complete plumbing facilities: 0.6% Housing units lacking complete kitchen facilities: 4.0%
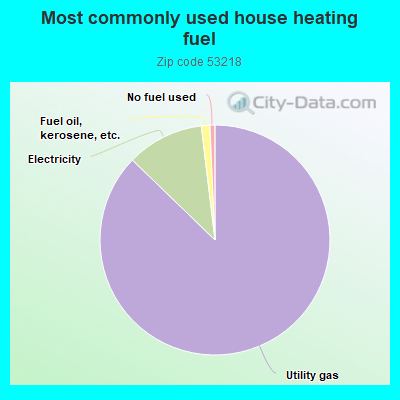
86.9%Utility gas
10.8%Electricity
1.2%Fuel oil, kerosene, etc.
0.7%No fuel used
Population in 1990: 40,443. Population change in the 1990s: +70 (+0.2%).
Place of birth for U.S.-born residents:
This state: 29,993
Northeast: 304
Midwest: 4,397
South: 3,582
West: 725
55% of the 53218 zip code residents lived in the same house 5 years ago. Out of people who lived in different houses, 87% lived in this county. Out of people who lived in different counties, 50% lived in Wisconsin.
88% of the 53218 zip code residents lived in the same house 1 year ago. Out of people who lived in different houses, 81% moved from this county. Out of people who lived in different houses, 7% moved from different county within same state. Out of people who lived in different houses, 5% moved from different state. Out of people who lived in different houses, 0% moved from abroad.
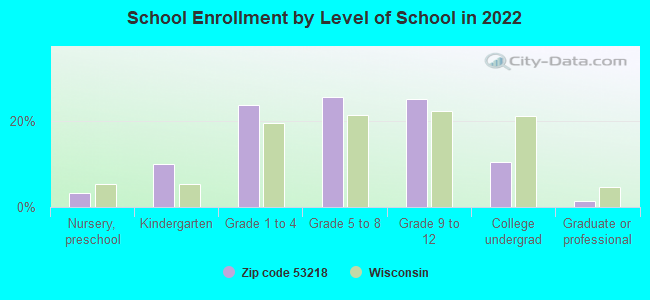
Private vs. public school enrollment:
Students in private schools in grades 1 to 8 (elementary and middle school): 1,424
Here:
22.6%
Wisconsin:
16.7%
Students in private schools in grades 9 to 12 (high school): 696
Here:
21.6%
Wisconsin:
12.5%
Students in private undergraduate colleges: 284
Here:
21.4%
Wisconsin:
17.5%
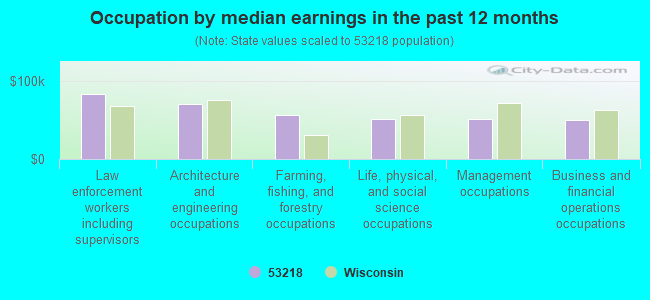
Occupation by median earnings in the past 12 months ($)
84,002Law enforcement workers including supervisors
70,411Architecture and engineering occupations
56,654Farming, fishing, and forestry occupations
51,887Life, physical, and social science occupations
51,872Management occupations
50,291Business and financial operations occupations
Companies with federal contracts located in this zip code (MILWAUKEE, WI):
NUVO SONAG JOINT VENTURE (6045 N 55 TH ST; small business) : $320,647 in 4 contractsin 2005
$324,125 with Air Force for Construction of Structures and Facilities -- Office Buildings. Signed on 2005-03-09. Completion date: 2005-08-01.
$1,609, same as above.Signed on 2005-05-16. Completion date: 2005-08-01.
-$1,150, same as above.Signed on 2005-04-12. Completion date: 2005-08-01.
-$3,937, same as above.Signed on 2005-07-20. Completion date: 2005-11-01.
ESKER TECHNOLOGIES, LLC (5915 N 55TH STREET; small business)
$98,684 with Air Force for Defense Missile and Space Systems -- Operational Systems Development (R&D). Signed on 2006-05-11. Completion date: 2007-05-10.
LEM USA INC (6643 W MILL RD) : $73,323 in 3 contractsfrom 2002 to 2005
$42,485 with Navy for Electrical and Electronic Properties Measuring and Testing Instruments. Signed on 2005-02-16. Completion date: 2005-05-13.
$28,218 with Navy for Combination and Miscellaneous Instruments. Signed on 2002-05-15. Completion date: 2002-06-14.
$2,620 with NASA for . Signed on 2004-01-07. Completion date: 2004-02-04.
AIRSAN CORP (4554 W WOOLWORTH AVE; small business) : $53,688 in 11 contractsfrom 2004 to 2006
Contracts for Refrigeration and Air Conditioning Components, Non-nuclear Ship Repair (East) Ship repair (including overhauls and conversions) performed on non-nuclear propelled and nonpropelled ships east of the 108th meridian, Centrifugals, Separators, and Pressure and Vacuum Filters by Defense Logistics Agency, Navy Signed by year:2000: $0; 2001: $0; 2002: $0; 2003: $0; 2004: $8,458; 2005: $37,959; 2006: $7,271.
Biggest contracts:
$7,753 with Defense Logistics Agency for Refrigeration and Air Conditioning Components. Signed on 2005-01-06. Completion date: 2005-05-07.
$6,382 with Navy for Non-nuclear Ship Repair (East) Ship repair (including overhauls and conversions) performed on non-nuclear propelled and nonpropelled ships east of the 108th meridian. Signed on 2005-03-09. Completion date: 2005-04-08.
$6,271 with Defense Logistics Agency for Refrigeration and Air Conditioning Components. Signed on 2005-10-06. Completion date: 2005-11-06.
$6,075 with Defense Logistics Agency for Centrifugals, Separators, and Pressure and Vacuum Filters. Signed on 2005-07-11. Completion date: 2005-08-25.
JORDAN CONTROLS INC (5607 W DOUGLAS AVE)
$43,644 with U.S. Army Corps of Engineers - civil program financing only for Miscellaneous Electric Power and Distribution Equipment. Taking place in MS. Signed on 2000-06-23. Completion date: 2000-05-01.
H & R NURSERY, INC (6520 W SILVER SPRING DR; small business) : $4,100 in 2 contractsin 2003
$4,100 with Army for Snow Removal/Salt Service (also spreading aggregate or other snow melting material). Signed on 2003-04-14. Completion date: 2003-10-31.
$0, same as above.Signed on 2003-04-14. Completion date: 2003-10-31.
Top industries in this zip code by the number of employees in 2005:
Health Care and Social Assistance: Home Health Care Services (250-499 employees: 1 establishment, 100-249 employees: 1 establishment)
Health Care and Social Assistance: Child Day Care Services (20-49: 5, 10-19: 5, 5-9: 5, 1-4: 46)
2005 - 2018 National Fire Incident Reporting System (NFIRS) incidents
According to the data from the years 2005 - 2018 the average number of fire incidents per year is 119. The highest number of fire incidents - 190 took place in 2012, and the least - 0 in 2006. The data has an increasing trend.
When looking into fire subcategories, the most incidents belonged to: Structure Fires (42.3%), and Outside Fires (30.1%).
Fire incident types reported to NFIRS in Zip Code 53218


 Nearest zip codes: 53216, 53209, 53210, 53223, 53225, 53222.
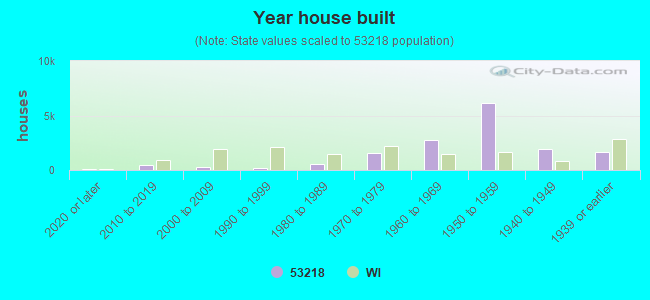


 According to the data from the years 2005 - 2018 the average number of fire incidents per year is 119. The highest number of fire incidents - 190 took place in 2012, and the least - 0 in 2006. The data has an increasing trend.
 When looking into fire subcategories, the most incidents belonged to: Structure Fires (42.3%), and Outside Fires (30.1%).