Estimated zip code population in 2022: 25,998 Zip code population in 2010: 25,706 Zip code population in 2000: 25,991
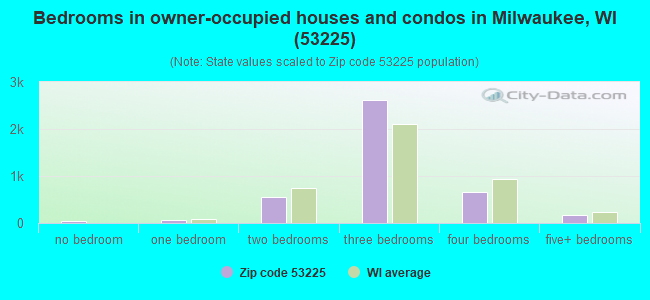
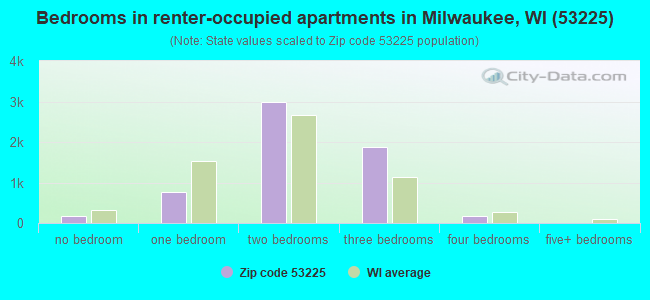
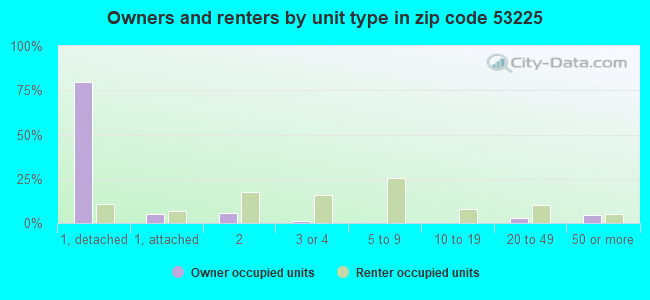
Houses and condos: 11,264 Renter-occupied apartments: 6,045
% of renters here:
59%
State:
32%
March 2022 cost of living index in zip code 53225: 97.5 (near average, U.S. average is 100)
Land area: 6.9 sq. mi. Water area: 0.0 sq. mi.
Population density: 3,784 people per square mile
(average).
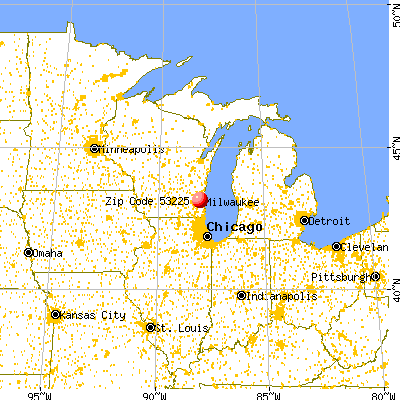
OSM Map
General Map
Google Map
MSN Map
OSM Map
General Map
Google Map
MSN Map
OSM Map
General Map
Google Map
MSN Map
OSM Map
General Map
Google Map
MSN Map
Please wait while loading the map...
Real estate property taxes paid for housing units in 2022:
This zip code:
1.9% ($3,427)
Wisconsin:
1.4% ($3,497)
Median real estate property taxes paid for housing units with mortgages in 2022: $3,569 (1.8%) Median real estate property taxes paid for housing units with no mortgage in 2022: $2,989 (2.2%)
Business Search- 14 Million verified businesses
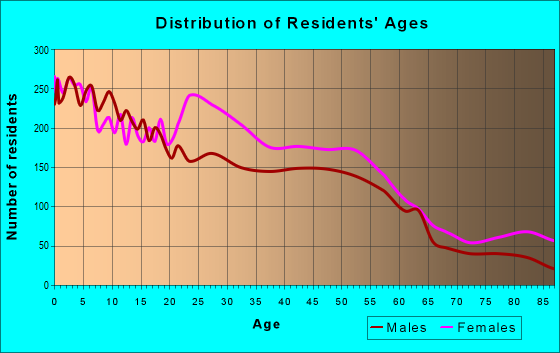
Males: 12,872
(49.5%)
Females: 13,125
(50.5%)
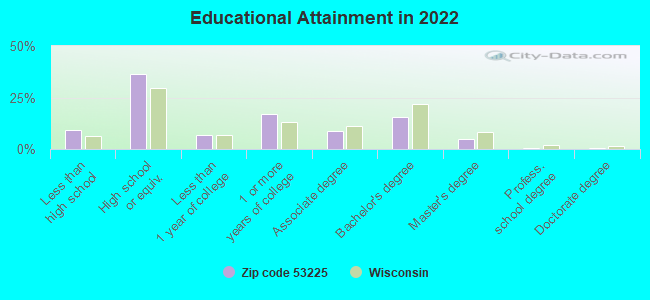
For population 25 years and over in 53225:
High school or higher: 89.6%
Bachelor's degree or higher: 21.2%
Graduate or professional degree: 5.8%
Unemployed: 6.1%
Mean travel time to work (commute): 22.5 minutes
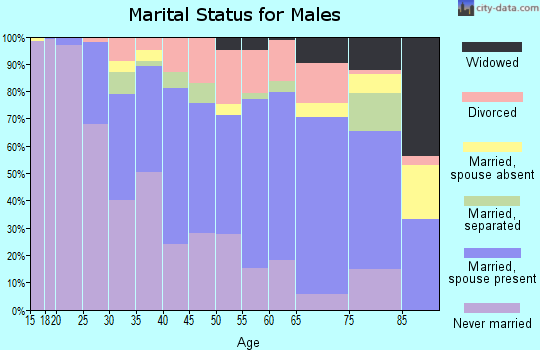
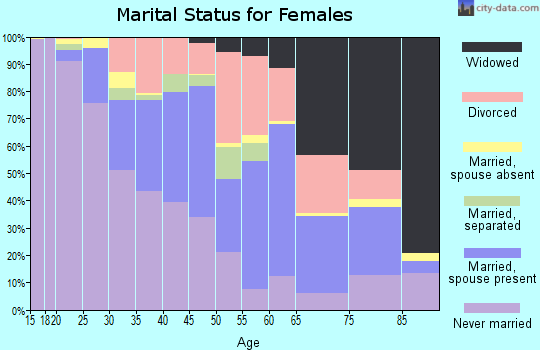
For population 15 years and over in 53225:
Never married: 53.0%
Now married: 29.7%
Separated: 1.8%
Widowed: 5.3%
Divorced: 10.3%
Zip code 53225 compared to state average:
Unemployed percentage above state average.
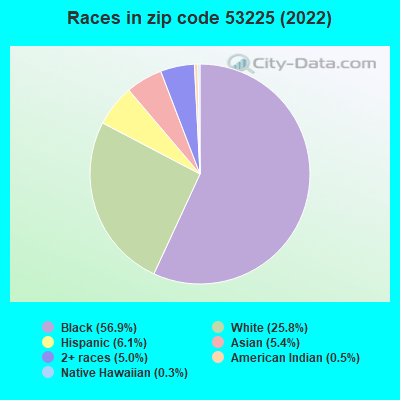
Black race population percentage significantly above state average.
Median age below state average.
Renting percentage above state average.
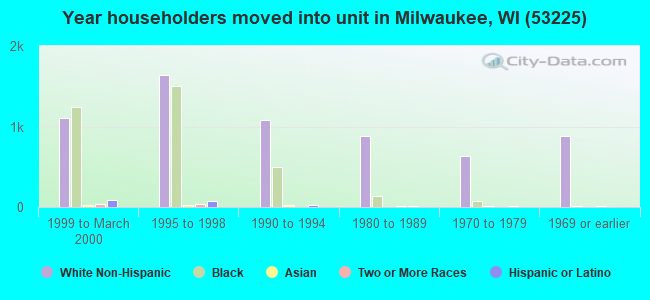
Length of stay since moving in significantly above state average.
Percentage of population with a bachelor's degree or higher below state average.
Averages for the 2020 tax year for zip code 53225, filed in 2021:
Average Adjusted Gross Income (AGI) in 2020: $40,554 (Individual Income Tax Returns)
Here:
$40,554
State:
$72,319
Salary/wage: $37,140 (reported on 88.4% of returns)
Here:
$37,140
State:
$59,242
(% of AGI for various income ranges: 1231.1% for AGIs below $25k, 4041.8% for AGIs $25k-50k, 7517.2% for AGIs $50k-75k, 10433.8% for AGIs $75k-100k, 18492.1% for AGIs $100k-200k)
Taxable interest for individuals: $639 (reported on 15.6% of returns)
This zip code:
$639
Wisconsin:
$1,431
(% of AGI for various income ranges: 5.2% for AGIs below $25k, 8.4% for AGIs $25k-50k, 19.7% for AGIs $50k-75k, 41.9% for AGIs $75k-100k, 59.5% for AGIs $100k-200k)
Ordinary dividends: $3,201 (reported on 8.0% of returns)
Here:
$3,201
State:
$6,481
(% of AGI for various income ranges: 8.2% for AGIs below $25k, 10.4% for AGIs $25k-50k, 39.9% for AGIs $50k-75k, 85.1% for AGIs $75k-100k, 308.7% for AGIs $100k-200k)
Net capital gain/loss in AGI: +$6,351 (reported on 6.7% of returns)
Here:
+$6,351
State:
+$18,329
(% of AGI for various income ranges: 1.1% for AGIs below $25k, 9.2% for AGIs $25k-50k, 45.2% for AGIs $50k-75k, 80.0% for AGIs $75k-100k, 324.6% for AGIs $100k-200k)
Profit/loss from business: +$7,453 (reported on 11.4% of returns)
Here:
+$7,453
State:
+$14,562
(% of AGI for various income ranges: 78.9% for AGIs below $25k, 42.3% for AGIs $25k-50k, 110.7% for AGIs $50k-75k, 248.7% for AGIs $75k-100k, 834.6% for AGIs $100k-200k)
Taxable individual retirement arrangement distribution: $12,434 (reported on 5.9% of returns)
53225:
$12,434
Wisconsin:
$19,348
(% of AGI for various income ranges: 29.4% for AGIs below $25k, 54.2% for AGIs $25k-50k, 130.5% for AGIs $50k-75k, 316.8% for AGIs $75k-100k, 767.4% for AGIs $100k-200k)
Total itemized deductions: $25,289 (reported on 3.9% of returns)
Here:
$25,289
State:
$33,000
(% of AGI for various income ranges: 14.3% for AGIs below $25k, 69.3% for AGIs $25k-50k, 258.1% for AGIs $50k-75k, 420.0% for AGIs $75k-100k, 760.5% for AGIs $100k-200k)
Charity contributions: $7,946 (reported on 3.0% of returns)
Here:
$7,946
State:
$12,044
(% of AGI for various income ranges: 16.5% for AGIs $25k-50k, 64.3% for AGIs $50k-75k, 122.1% for AGIs $75k-100k, 256.7% for AGIs $100k-200k)
Taxes paid: $6,644 (reported on 3.8% of returns)
53225:
$6,644
State:
$8,228
(% of AGI for various income ranges: 2.1% for AGIs below $25k, 14.1% for AGIs $25k-50k, 68.9% for AGIs $50k-75k, 147.0% for AGIs $75k-100k, 210.8% for AGIs $100k-200k)
Earned income credit: $2,751 (reported on 32.0% of returns)
Here:
$2,751
State:
$2,155
(% of AGI for various income ranges: 176.7% for AGIs below $25k, 114.3% for AGIs $25k-50k, 1.7% for AGIs $50k-75k)
Percentage of individuals using paid preparers for their 2020 taxes: 93.7%
Here:
94%
State:
94%
(% for various income ranges: 93.6% for AGIs below $25k, 94.1% for AGIs $25k-50k, 93.2% for AGIs $50k-75k, 91.8% for AGIs $75k-100k, 95.8% for AGIs $100k-200k, 87.5% for AGIs over 200k)
Averages for the 2012 tax year for zip code 53225, filed in 2013:
Average Adjusted Gross Income (AGI) in 2012: $35,215 (Individual Income Tax Returns)
Here:
$35,215
State:
$57,939
Salary/wage: $32,848 (reported on 85.7% of returns)
Here:
$32,848
State:
$48,248
(% of AGI for various income ranges: 75.5% for AGIs below $25k, 86.5% for AGIs $25k-50k, 82.5% for AGIs $50k-75k, 78.8% for AGIs $75k-100k, 76.6% for AGIs $100k-200k, 42.3% for AGIs over 200k)
Taxable interest for individuals: $780 (reported on 22.4% of returns)
This zip code:
$780
Wisconsin:
$1,224
(% of AGI for various income ranges: 0.6% for AGIs below $25k, 0.4% for AGIs $25k-50k, 0.4% for AGIs $50k-75k, 0.7% for AGIs $75k-100k, 0.7% for AGIs $100k-200k, 0.4% for AGIs over 200k)
Ordinary dividends: $3,340 (reported on 10.9% of returns)
Here:
$3,340
State:
$5,137
(% of AGI for various income ranges: 1.0% for AGIs below $25k, 0.6% for AGIs $25k-50k, 0.8% for AGIs $50k-75k, 0.8% for AGIs $75k-100k, 2.7% for AGIs $100k-200k)
Net capital gain/loss in AGI: +$1,965 (reported on 7.3% of returns)
Here:
+$1,965
State:
+$11,137
(% of AGI for various income ranges: 0.2% for AGIs $25k-50k, 0.2% for AGIs $50k-75k, 0.4% for AGIs $75k-100k, 1.7% for AGIs $100k-200k)
Profit/loss from business: +$8,214 (reported on 10.7% of returns)
Here:
+$8,214
State:
+$11,943
(% of AGI for various income ranges: 8.7% for AGIs below $25k, 1.0% for AGIs $25k-50k, 1.1% for AGIs $50k-75k, 1.0% for AGIs $75k-100k, 1.6% for AGIs $100k-200k)
Taxable individual retirement arrangement distribution: $10,565 (reported on 7.6% of returns)
53225:
$10,565
Wisconsin:
$14,087
(% of AGI for various income ranges: 2.2% for AGIs below $25k, 1.6% for AGIs $25k-50k, 1.9% for AGIs $50k-75k, 2.7% for AGIs $75k-100k, 4.1% for AGIs $100k-200k)
Total itemized deductions: $17,221 (25% of AGI, reported on 23.9% of returns)
Here:
$17,221
State:
$22,257
Here:
25.1% of AGI
State:
20.1% of AGI
(% of AGI for various income ranges: 6.1% for AGIs below $25k, 8.4% for AGIs $25k-50k, 14.2% for AGIs $50k-75k, 15.7% for AGIs $75k-100k, 16.4% for AGIs $100k-200k, 15.1% for AGIs over 200k)
Charity contributions: $2,854 (reported on 19.4% of returns)
Here:
$2,854
State:
$3,370
(% of AGI for various income ranges: 0.7% for AGIs below $25k, 1.1% for AGIs $25k-50k, 1.8% for AGIs $50k-75k, 2.4% for AGIs $75k-100k, 2.3% for AGIs $100k-200k, 1.6% for AGIs over 200k)
Taxes paid: $6,995 (reported on 23.9% of returns)
53225:
$6,995
State:
$10,731
(% of AGI for various income ranges: 1.5% for AGIs below $25k, 2.9% for AGIs $25k-50k, 5.7% for AGIs $50k-75k, 6.9% for AGIs $75k-100k, 8.3% for AGIs $100k-200k, 7.5% for AGIs over 200k)
Earned income credit: $2,781 (reported on 33.5% of returns)
Here:
$2,781
State:
$2,094
(% of AGI for various income ranges: 12.2% for AGIs below $25k, 1.6% for AGIs $25k-50k)
Percentage of individuals using paid preparers for their 2012 taxes: 43.6%
Here:
44%
State:
54%
(% for various income ranges: 40.4% for AGIs below $25k, 43.8% for AGIs $25k-50k, 47.9% for AGIs $50k-75k, 53.4% for AGIs $75k-100k, 51.9% for AGIs $100k-200k, 66.7% for AGIs over 200k)
Averages for the 2004 tax year for zip code 53225, filed in 2005:
Average Adjusted Gross Income (AGI) in 2004: $33,432 (Individual Income Tax Returns)
Here:
$33,432
State:
$47,735
Salary/wage: $31,422 (reported on 87.1% of returns)
Here:
$31,422
State:
$41,540
(% of AGI for various income ranges: 81.5% for AGIs below $10k, 79.8% for AGIs $10k-25k, 87.5% for AGIs $25k-50k, 83.6% for AGIs $50k-75k, 84.9% for AGIs $75k-100k, 64.4% for AGIs over 100k)
Taxable interest for individuals: $1,259 (reported on 34.6% of returns)
This zip code:
$1,259
Wisconsin:
$1,420
(% of AGI for various income ranges: 3.4% for AGIs below $10k, 1.9% for AGIs $10k-25k, 1.0% for AGIs $25k-50k, 1.0% for AGIs $50k-75k, 1.2% for AGIs $75k-100k, 1.6% for AGIs over 100k)
Taxable dividends: $2,440 (reported on 17.4% of returns)
Here:
$2,440
State:
$2,869
(% of AGI for various income ranges: 2.4% for AGIs below $10k, 1.2% for AGIs $10k-25k, 0.7% for AGIs $25k-50k, 1.0% for AGIs $50k-75k, 1.1% for AGIs $75k-100k, 3.0% for AGIs over 100k)
Net capital gain/loss: +$4,416 (reported on 11.9% of returns)
Here:
+$4,416
State:
+$9,569
(% of AGI for various income ranges: -1.5% for AGIs below $10k, 0.2% for AGIs $10k-25k, 0.5% for AGIs $25k-50k, 0.8% for AGIs $50k-75k, 1.4% for AGIs $75k-100k, 8.0% for AGIs over 100k)
Profit/loss from business: +$6,831 (reported on 8.3% of returns)
Here:
+$6,831
State:
+$10,417
(% of AGI for various income ranges: 5.1% for AGIs below $10k, 2.9% for AGIs $10k-25k, 1.0% for AGIs $25k-50k, 1.2% for AGIs $50k-75k, 1.3% for AGIs $75k-100k, 2.6% for AGIs over 100k)
IRA payment deduction: $2,475 (reported on 1.4% of returns)
53225:
$2,475
Wisconsin:
$2,900
(% of AGI for various income ranges: 0.1% for AGIs $10k-25k, 0.1% for AGIs $25k-50k, 0.1% for AGIs $50k-75k, 0.2% for AGIs $75k-100k)
Self-employed pension: $5,429 (reported on 0.1% of returns)
Here:
$5,429
Wisconsin:
$11,934
Total itemized deductions: $15,136 (25% of AGI, reported on 29.2% of returns)
Here:
$15,136
State:
$18,160
Here:
25.2% of AGI
State:
21.1% of AGI
(% of AGI for various income ranges: 8.6% for AGIs below $10k, 8.4% for AGIs $10k-25k, 11.1% for AGIs $25k-50k, 15.3% for AGIs $50k-75k, 17.7% for AGIs $75k-100k, 16.2% for AGIs over 100k)
Charity contributions deductions: $2,513 (4% of AGI, reported on 25.0% of returns)
Here:
$2,513
State:
$2,711
Here:
4.0% of AGI
State:
3.0% of AGI
(% of AGI for various income ranges: 0.7% for AGIs below $10k, 1.0% for AGIs $10k-25k, 1.5% for AGIs $25k-50k, 2.1% for AGIs $50k-75k, 2.5% for AGIs $75k-100k, 3.1% for AGIs over 100k)
Total tax: $4,058 (reported on 66.3% of returns)
53225:
$4,058
State:
$7,114
(% of AGI for various income ranges: 1.6% for AGIs below $10k, 3.1% for AGIs $10k-25k, 6.7% for AGIs $25k-50k, 8.6% for AGIs $50k-75k, 9.9% for AGIs $75k-100k, 15.4% for AGIs over 100k)
Earned income credit: $1,962 (reported on 26.1% of returns)
Here:
$1,962
State:
$1,544
Percentage of individuals using paid preparers for their 2004 taxes: 57.6%
Here:
58%
State:
57%
(% for various income ranges: 56.6% for AGIs below $10k, 63.1% for AGIs $10k-25k, 54.5% for AGIs $25k-50k, 54.8% for AGIs $50k-75k, 52.0% for AGIs $75k-100k, 63.7% for AGIs over 100k)
Likely homosexual households (counted as self-reported same-sex unmarried-partner households)
Lesbian couples: 0.1% of all households
Gay men: 0.2% of all households
Household received Food Stamps/SNAP in the past 12 months: 3,192 Household did not receive Food Stamps/SNAP in the past 12 months: 7,274
Women who had a birth in the past 12 months: 531 (235 now married, 292 unmarried) Women who did not have a birth in the past 12 months: 5,671 (1,456 now married, 4,215 unmarried)
Housing units in zip code 53225 with a mortgage: 2,904 (306 second mortgage, 241 both second mortgage and home equity loan) Houses without a mortgage: 44
Median monthly owner costs for units with a mortgage: $1,461 Median monthly owner costs for units without a mortgage: $573
Residents with income below the poverty level in 2022:
This zip code:
18.9%
Whole state:
10.7%
Residents with income below 50% of the poverty level in 2022:
This zip code:
12.2%
Whole state:
5.7%
Median number of rooms in houses and condos:
Here:
5.9
State:
6.5
Median number of rooms in apartments:
Here:
4.3
State:
4.1
Notable locations in this zip code not listed on our city pages
2,151 married couples with children.
4,387 single-parent households (678 men, 3,709 women).
88.8% of residents of 53225 zip code speak English at home.
3.9% of residents speak Spanish at home (81% very well, 14% well, 5% not well).
2.1% of residents speak other Indo-European language at home (63% very well, 25% well, 5% not well, 7% not at all).
4.0% of residents speak Asian or Pacific Island language at home (74% very well, 13% well, 10% not well, 3% not at all).
0.5% of residents speak other language at home (85% very well, 15% well).
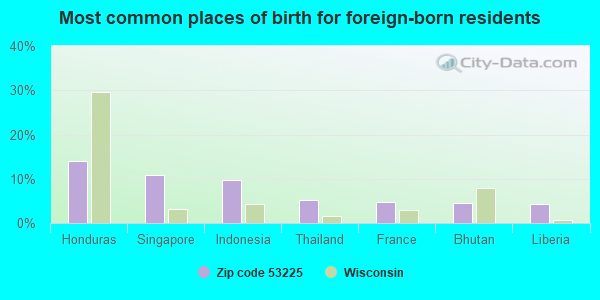
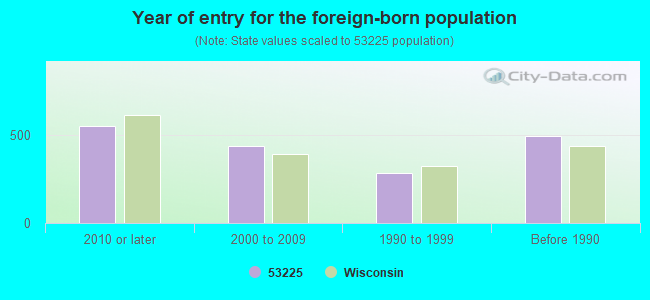
Foreign born population: 1,611 (6.2%) (50.4% of them are naturalized citizens)
Major facilities with environmental interests located in this zip code:
ACE IRON& STEEL CORP (5118 N 124TH ST in MILWAUKEE, WI)
AIR MINOR (AIRS/AFS) Conditionally Exempt Small Quantity Generators, less than 100 kg/month of hazardous waste (Resource Conservation and Recovery Act (tracking hazardous waste)) - notification STATE MASTER (Wisconsin database) - RCRAINFO-WID057164477, CESQG Business SIC classification: FABRICATED STRUCTURAL METAL; MISCELLANEOUS STRUCTURAL METALWORK Organizations: JACKSON REALTY (CONTACT/OWNER)
ADM COCOA (12500 WEST CARMEN AVENUE in MILWAUKEE, WI)
AIR SYNTHETIC MINOR (AIRS/AFS) CRITERIA AND HAZARDOUS AIR POLLUTANT INVENTORY (Inventory of air pollution sources) Conditionally Exempt Small Quantity Generators, less than 100 kg/month of hazardous waste (Resource Conservation and Recovery Act (tracking hazardous waste)) STATE MASTER (Wisconsin database) - NEI-WI268257220, AIR PROGRAM, RCRAINFO-WID988635363, SQG Business SIC classification: CHOCOLATE AND COCOA PRODUCTS Business NAICS classification: CHOCOLATE AND CONFECTIONERY MANUFACTURING FROM CACAO BEANS. Alternative names: ARCHER DANIELS MIDLAND COCOA
ASI TECHNOLOGIES INC. (5848 N. 95TH. CT. in MILWAUKEE, WI)
AIR SYNTHETIC MINOR (AIRS/AFS) CRITERIA AND HAZARDOUS AIR POLLUTANT INVENTORY (Inventory of air pollution sources) Small Quantity Generators, between 100 kg and 1000 kg of hazardous waste/month (Resource Conservation and Recovery Act (tracking hazardous waste)) - notification TRI REPORTER (Tracking of toxic chemicals releasing facilities) STATE MASTER (Wisconsin database) - TRIS-53225STCHN5848N, TRI REPORTER, NEI-WI241536350, AIR PROGRAM, RCRAINFO-WID988588455, SQG Business SIC classification: METAL DOORS, SASH, FRAMES, MOLDING, AND TRIM Business NAICS classification: METAL WINDOW AND DOOR MANUFACTURING.; METAL WINDOW AND DOOR MANUFACTURING.
CHURCH METAL (5050 N 124TH ST in MILWAUKEE, WI)
(Resource Conservation and Recovery Act (tracking hazardous waste)) STATE MASTER (Wisconsin database) - RCRAINFO-WIR000042499, CESQG Organizations: CHURCH METAL CORP (CONTACT/OWNER)
AJAX INDUSTRIES LTD (5830 N 95TH CT in MILWAUKEE, WI)
Conditionally Exempt Small Quantity Generators, less than 100 kg/month of hazardous waste (Resource Conservation and Recovery Act (tracking hazardous waste)) - notification STATE MASTER (Wisconsin database) - RCRAINFO-WID145351128, CESQG Business SIC classification: FABRICATED METAL PRODUCTS
CENTERLINE TRUCK REPAIR INC (9718 W FLAGG AVE in MILWAUKEE, WI)
Conditionally Exempt Small Quantity Generators, less than 100 kg/month of hazardous waste (Resource Conservation and Recovery Act (tracking hazardous waste)) - notification STATE MASTER (Wisconsin database) - RCRAINFO-WID052693876, CESQG Business SIC classification: GENERAL AUTOMOTIVE REPAIR SHOPS; AUTOMOTIVE REPAIR SHOPS Organizations: HOFFMAN DAVID AND REINHILDE (CONTACT/OWNER)
A& J AUTOMOTIVE (8401 W HAMPTON AVE in MILWAUKEE, WI)
Small Quantity Generators, between 100 kg and 1000 kg of hazardous waste/month (Resource Conservation and Recovery Act (tracking hazardous waste)) - notification STATE MASTER (Wisconsin database) - RCRAINFO-WIR000101006, HAZARDOUS WASTE PROGRAM Organizations: JOHN A PLANINSHEK (CONTACT/OWNER)
APPLETON HEIGHTS (9025 W APPLETON AVE in MILWAUKEE, WI)
Conditionally Exempt Small Quantity Generators, less than 100 kg/month of hazardous waste (Resource Conservation and Recovery Act (tracking hazardous waste)) - notification STATE MASTER (Wisconsin database) - RCRAINFO-WI0000908855, CESQG Organizations: TRUSHINSKY ALLEN (CONTACT/OWNER)
BRYANT SCHOOL (8718 W THURSTON in MILWAUKEE, WI)
Conditionally Exempt Small Quantity Generators, less than 100 kg/month of hazardous waste (Resource Conservation and Recovery Act (tracking hazardous waste)) - notification STATE MASTER (Wisconsin database) - RCRAINFO-WID988599239, CESQG Organizations: MILWAUKEE SCHOOL DISTRICT OF (CONTACT/OWNER)
BULK PETROLEUM (11006 W SILVER SPRING DR in MILWAUKEE, WI)
Small Quantity Generators, between 100 kg and 1000 kg of hazardous waste/month (Resource Conservation and Recovery Act (tracking hazardous waste)) - notification STATE MASTER (Wisconsin database) - RCRAINFO-WID988577276, SQG Business SIC classification: GASOLINE SERVICE STATIONS Organizations: BULK PETROLEUM CORP, NATIONAL PETROLEUM INC (CONTACT/OWNER)
Alternative names: EMRO MARKETING NO 7780, NATIONAL PETROLEUM INC
CAREVAN MED SYS (11301 W SILVER SPRING DR #101 in MILWAUKEE, WI)
Conditionally Exempt Small Quantity Generators, less than 100 kg/month of hazardous waste (Resource Conservation and Recovery Act (tracking hazardous waste)) - notification STATE MASTER (Wisconsin database) - RCRAINFO-WID988606760, CESQG Organizations: MEDISYS (CONTACT/OWNER)
Alternative names: CAREVAN MEDICAL SYSTEMS
BRAKE & EQUIPMENT COMPANY (11911 WEST SILVER SPRING ROAD in MILWAUKEE, WI)
AIR MINOR (AIRS/AFS) Small Quantity Generators, between 100 kg and 1000 kg of hazardous waste/month (Resource Conservation and Recovery Act (tracking hazardous waste)) Business SIC classification: AUTOMOTIVE REPAIR SHOPS; AUTOMOTIVE SERVICES, EXCEPT REPAIR AND CARWASHES Organizations: TOM AMAN (CONTACT/OPERATOR)
, BRAKE AND EQUIPMENT CO (CONTACT/OWNER)
BRYANT EL (8718 W THURSTON AVE in MILWAUKEE, WI)
(National Center for Education Statistics) - STATE ID-0094 Organizations: MILWAUKEE SCH DIST (SCHOOL DISTRICT)
Housing units lacking complete plumbing facilities: 0.3% Housing units lacking complete kitchen facilities: 3.3%
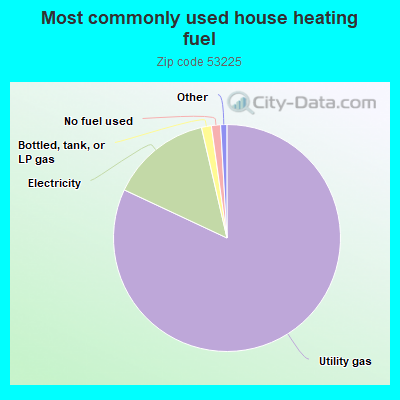
81.9%Utility gas
14.4%Electricity
1.4%Bottled, tank, or LP gas
1.3%No fuel used
Population in 1990: 25,395. Population change in the 1990s: +596 (+2.3%).
Place of birth for U.S.-born residents:
This state: 19,082
Northeast: 218
Midwest: 2,423
South: 1,999
West: 464
47% of the 53225 zip code residents lived in the same house 5 years ago. Out of people who lived in different houses, 75% lived in this county. Out of people who lived in different counties, 50% lived in Wisconsin.
90% of the 53225 zip code residents lived in the same house 1 year ago. Out of people who lived in different houses, 68% moved from this county. Out of people who lived in different houses, 17% moved from different county within same state. Out of people who lived in different houses, 11% moved from different state.
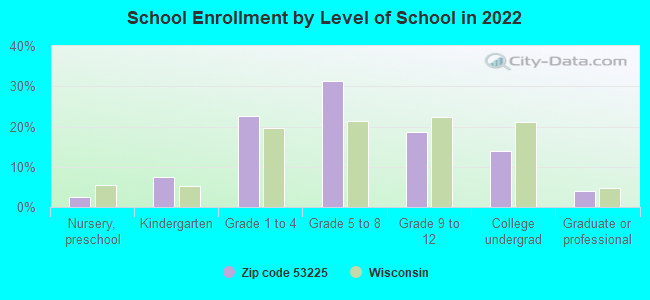
Private vs. public school enrollment:
Students in private schools in grades 1 to 8 (elementary and middle school): 790
Here:
22.6%
Wisconsin:
16.7%
Students in private schools in grades 9 to 12 (high school): 273
Here:
22.4%
Wisconsin:
12.5%
Students in private undergraduate colleges: 276
Here:
30.9%
Wisconsin:
17.5%
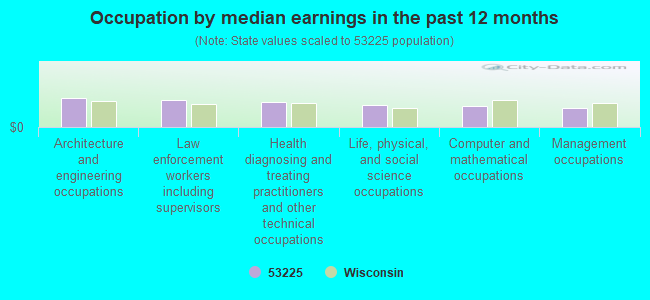
Occupation by median earnings in the past 12 months ($)
84,844Architecture and engineering occupations
79,163Law enforcement workers including supervisors
70,947Health diagnosing and treating practitioners and other technical occupations
64,631Life, physical, and social science occupations
59,490Computer and mathematical occupations
54,116Management occupations
Companies with biggest federal contracts located in this zip code (MILWAUKEE, WI):
INGERSOLL-RAND COMPANY (12311 W SILVER SPRING DR) : $6,869,661 in 187 contractsfrom 2001 to 2006
Contracts for Compressors and Vacuum Pumps, Truck and Tractor Attachments, Diesel Engines and Components, Drilling and Tapping Machines, and moreby Air Force, Army, U.S. Coast Guard, Navy, and others Signed by year:2000: $0; 2001: $154,960; 2002: $100,164; 2003: $1,139,811; 2004: $1,464,889; 2005: $2,766,546; 2006: $1,243,291.
Biggest contracts:
$830,403 with Air Force for Compressors and Vacuum Pumps. Signed on 2005-09-30. Completion date: 2006-01-31.
$767,120, same as above.Signed on 2006-05-25. Completion date: 2006-09-30.
$638,627 with Army for Truck and Tractor Attachments. Signed on 2005-07-08. Completion date: 2005-12-30.
$321,200 with Army for Compressors and Vacuum Pumps. Signed on 2004-07-09. Completion date: 2007-12-15.
ASI TECHNOLOGIES INC (5848 N 95TH CT; small business) : $1,256,674 in 30 contractsfrom 2002 to 2006
Contracts for Building Components, Prefabricated, Maintenance, Repair or Alteration of Real Property -- Office Buildings, Hydrographic Maps, Charts and Geodesic Products, Maintenance, Repair or Alteration of Real Property -- EPG Facilities - Hydro, and moreby Air Force, SOCIAL SECURITY ADMINISTRATION, Public Buildings Service, Army, and others Signed by year:2000: $0; 2001: $0; 2002: $50,000; 2003: $177,980; 2004: $364,927; 2005: $364,926; 2006: $298,841.
Biggest contracts:
$254,904 with Air Force for Building Components, Prefabricated. Taking place in FL. Signed on 2004-08-30. Completion date: 2004-09-13.
$102,000 with SOCIAL SECURITY ADMINISTRATION for Maintenance, Repair or Alteration of Real Property -- Office Buildings. Signed on 2006-09-30. Completion date: 2006-12-30.
$98,920 with Public Buildings Service for Hydrographic Maps, Charts and Geodesic Products. Taking place in DC. Signed on 2005-09-06. Completion date: 2005-09-06.
$93,500 with Public Buildings Service for Building Components, Prefabricated. Taking place in NM. Signed on 2005-03-23. Completion date: 2005-05-01.
THERMAL ENGINEERING INTERNATIO (4810 N 124TH STREET) : $241,866 in 5 contractsfrom 2001 to 2003
Contracts for Air Conditioning Equipment, Heat Exchangers and Steam Condensers by Navy Signed by year:2000: $0; 2001: $101,481; 2002: $49,312; 2003: $91,073; 2004: $0; 2005: $0; 2006: $0.
Biggest contracts:
$91,073 with Navy for Air Conditioning Equipment. Signed on 2003-03-12. Completion date: 2003-08-19.
$50,406 with Navy for Heat Exchangers and Steam Condensers. Signed on 2001-08-14. Completion date: 2002-01-04.
$49,312, same as above.Signed on 2002-01-07. Completion date: 2003-01-07.
$25,719, same as above.Signed on 2001-07-11. Completion date: 2002-03-01.
HURT ELECTRIC INC (10529 W APPLETON AVE; small business) : $109,810 in 3 contractsfrom 2002 to 2003
$60,733 with Army for Maintenance, Repair or Alteration of Real Property -- Other Non-Building Facilities. Signed on 2003-04-22. Completion date: 2003-04-25.
$24,915 with Air Force for Maintenance, Repair or Alteration of Real Property -- Miscellaneous Buildings. Signed on 2002-08-30. Completion date: 2002-10-30.
$24,162 with Army for Maintenance, Repair or Alteration of Real Property -- Other Non-Building Facilities. Signed on 2003-04-22. Completion date: 2002-10-18.
LAKESIDE INTERNATIONAL LLC (11000 W SILVER SPRING RD) : $35,642 in 2 contractsin 2006
$32,600 with Army for Trucks and Truck Tractors, Wheeled. Signed on 2006-06-09. Completion date: 2006-09-30.
$3,042 with Army for Maintenance, Repair and Rebuilding of Equipment -- Aircraft Launching, Landing, and Ground Handling Equipment. Signed on 2006-02-01. Completion date: 2006-02-03.
SPRINKMANN SONS CORPORATION (12100 W SILVER SPRING RD)
$32,200 with U.S. Army Corps of Engineers - civil program financing only for Maintenance, Repair and Rebuilding of Equipment -- Ships, Small Craft, Pontoons, and Floating Docks. Taking place in MN. Signed on 2003-02-26. Completion date: 2003-03-24.
MILWAUKEE LODGING ASSOCIATES L (5601 N LOVERS LANE; small business) : $24,990 in 5 contractsfrom 2003 to 2004
Contracts for Lodging - Hotel/Motel by Army Signed by year:2000: $0; 2001: $0; 2002: $0; 2003: $22,344; 2004: $2,646; 2005: $0; 2006: $0.
Biggest contracts:
$16,954 with Army for Lodging - Hotel/Motel. Signed on 2003-10-01. Completion date: 2004-02-29.
$3,430, same as above.Signed on 2003-10-01. Completion date: 2004-02-29.
$2,450, same as above.Signed on 2004-05-21. Completion date: 2004-05-21.
$1,960, same as above.Signed on 2003-10-01. Completion date: 2004-03-31.
MILWAUKEE LODGING ASSOCIATES, (5601 N LOVERS LANE; small business)
$6,272 with Army for Lodging - Hotel/Motel. Signed on 2005-12-23. Completion date: 2006-01-11.
MEE ENTERPRISES INC (11721 W CARMEN AVE; small business)
$4,306 with Army for Vehicular Cab, Body, and Frame Structural Components. Signed on 2002-09-30. Completion date: 2002-11-29.
HANSEN ENVIRONMENTAL, LLC (5811 NO 96TH STREET; small business)
$3,915 with Army for Fire Fighting Equipment. Signed on 2003-02-20. Completion date: 2003-03-07.
Top industries in this zip code by the number of employees in 2005:
Health Care and Social Assistance: Nursing Care Facilities (500-999 employees: 1 establishment, 250-499 employees: 1 establishment, 100-249 employees: 1 establishment, 50-99 employees: 1 establishment, 20-49 employees: 1 establishment)
Health Care and Social Assistance: Vocational Rehabilitation Services (500-999: 1)
Health Care and Social Assistance: Home Health Care Services (250-499: 1, 5-9: 1, 1-4: 1)
Wholesale Trade: Other Grocery and Related Products Merchant Wholesalers (250-499: 1, 1-4: 1)
Accommodation and Food Services: Limited-Service Restaurants (20-49: 6, 10-19: 4)
2002 - 2018 National Fire Incident Reporting System (NFIRS) incidents
According to the data from the years 2002 - 2018 the average number of fires per year is 51. The highest number of fire incidents - 111 took place in 2012, and the least - 0 in 2007. The data has a rising trend.
When looking into fire subcategories, the most reports belonged to: Structure Fires (37.7%), and Outside Fires (36.3%).
Fire incident types reported to NFIRS in Zip Code 53225


 Nearest zip codes: 53007, 53222, 53224, 53218, 53226, 53223.


 According to the data from the years 2002 - 2018 the average number of fires per year is 51. The highest number of fire incidents - 111 took place in 2012, and the least - 0 in 2007. The data has a rising trend.
 When looking into fire subcategories, the most reports belonged to: Structure Fires (37.7%), and Outside Fires (36.3%).