Estimated zip code population in 2022: 35,285 Zip code population in 2010: 33,880 Zip code population in 2000: 33,714
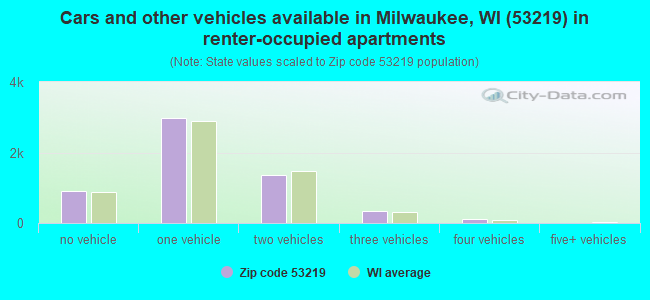
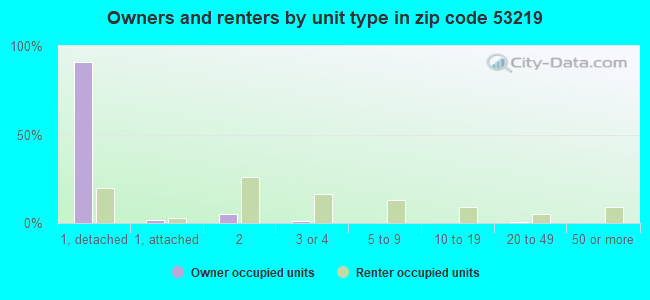
Houses and condos: 15,819 Renter-occupied apartments: 5,680
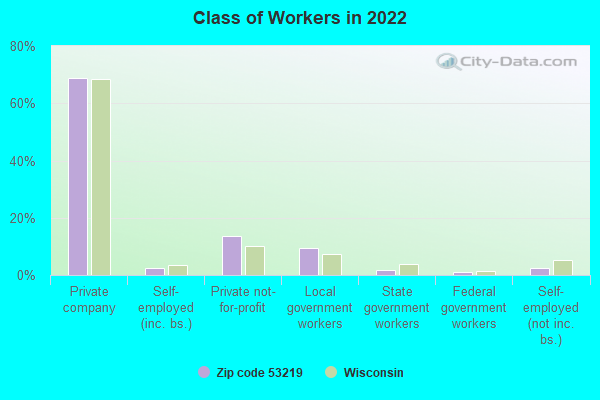
% of renters here:
37%
State:
32%
March 2022 cost of living index in zip code 53219: 96.3 (near average, U.S. average is 100)
Land area: 4.9 sq. mi. Water area: 0.0 sq. mi.
Population density: 7,133 people per square mile
(high).
OSM Map
General Map
Google Map
MSN Map
OSM Map
General Map
Google Map
MSN Map
OSM Map
General Map
Google Map
MSN Map
OSM Map
General Map
Google Map
MSN Map
Please wait while loading the map...
Real estate property taxes paid for housing units in 2022:
This zip code:
2.0% ($3,725)
Wisconsin:
1.4% ($3,497)
Median real estate property taxes paid for housing units with mortgages in 2022: $3,739 (1.9%) Median real estate property taxes paid for housing units with no mortgage in 2022: $3,701 (2.0%)
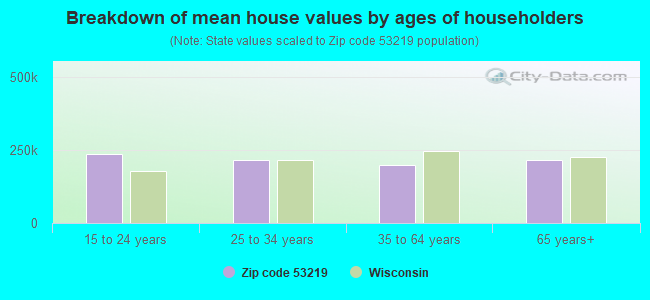
Estimated median house/condo value in 2022: $190,092
53219:
$190,092
Wisconsin:
$252,800
According to our research of Wisconsin and other state lists, there were 90 registered sex offenders living in 53219 zip code as of April 26, 2024. The ratio of all residents to sex offenders in zip code 53219 is 390 to 1. The ratio of registered sex offenders to all residents in this zip code is near the state average.
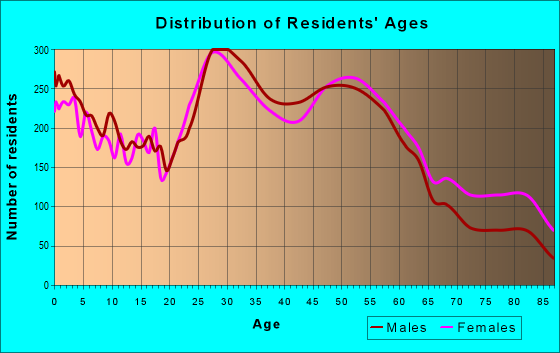
Median resident age:
This zip code:
38.0 years
Wisconsin median age:
40.4 years
Average household size:
This zip code:
2.3 people
Wisconsin:
2.3 people
Averages for the 2020 tax year for zip code 53219, filed in 2021:
Average Adjusted Gross Income (AGI) in 2020: $48,190 (Individual Income Tax Returns)
Here:
$48,190
State:
$72,319
Salary/wage: $44,739 (reported on 84.8% of returns)
Here:
$44,739
State:
$59,242
(% of AGI for various income ranges: 1185.6% for AGIs below $25k, 3849.1% for AGIs $25k-50k, 6699.8% for AGIs $50k-75k, 9953.8% for AGIs $75k-100k, 16556.4% for AGIs $100k-200k, 48780.0% for AGIs over 200k)
Taxable interest for individuals: $739 (reported on 26.2% of returns)
This zip code:
$739
Wisconsin:
$1,431
(% of AGI for various income ranges: 13.7% for AGIs below $25k, 13.3% for AGIs $25k-50k, 35.6% for AGIs $50k-75k, 38.2% for AGIs $75k-100k, 79.7% for AGIs $100k-200k, 770.0% for AGIs over 200k)
Ordinary dividends: $2,995 (reported on 13.8% of returns)
Here:
$2,995
State:
$6,481
(% of AGI for various income ranges: 14.6% for AGIs below $25k, 18.3% for AGIs $25k-50k, 52.2% for AGIs $50k-75k, 104.9% for AGIs $75k-100k, 205.9% for AGIs $100k-200k, 4910.0% for AGIs over 200k)
Net capital gain/loss in AGI: +$5,280 (reported on 11.1% of returns)
Here:
+$5,280
State:
+$18,329
(% of AGI for various income ranges: 2.1% for AGIs below $25k, 19.7% for AGIs $25k-50k, 43.2% for AGIs $50k-75k, 117.4% for AGIs $75k-100k, 356.0% for AGIs $100k-200k, 11793.3% for AGIs over 200k)
Profit/loss from business: +$10,137 (reported on 9.7% of returns)
Here:
+$10,137
State:
+$14,562
(% of AGI for various income ranges: 90.1% for AGIs below $25k, 101.2% for AGIs $25k-50k, 112.3% for AGIs $50k-75k, 198.7% for AGIs $75k-100k, 293.1% for AGIs $100k-200k, 5046.7% for AGIs over 200k)
Taxable individual retirement arrangement distribution: $12,919 (reported on 8.2% of returns)
53219:
$12,919
Wisconsin:
$19,348
(% of AGI for various income ranges: 62.3% for AGIs below $25k, 82.3% for AGIs $25k-50k, 154.1% for AGIs $50k-75k, 238.8% for AGIs $75k-100k, 540.3% for AGIs $100k-200k, 3063.3% for AGIs over 200k)
Total itemized deductions: $21,987 (reported on 4.6% of returns)
Here:
$21,987
State:
$33,000
(% of AGI for various income ranges: 26.7% for AGIs below $25k, 58.8% for AGIs $25k-50k, 186.0% for AGIs $50k-75k, 342.7% for AGIs $75k-100k, 469.0% for AGIs $100k-200k, 4263.3% for AGIs over 200k)
Charity contributions: $5,545 (reported on 3.1% of returns)
Here:
$5,545
State:
$12,044
(% of AGI for various income ranges: 1.8% for AGIs below $25k, 7.0% for AGIs $25k-50k, 15.5% for AGIs $50k-75k, 49.5% for AGIs $75k-100k, 116.0% for AGIs $100k-200k, 1833.3% for AGIs over 200k)
Taxes paid: $7,801 (reported on 4.6% of returns)
53219:
$7,801
State:
$8,228
(% of AGI for various income ranges: 5.0% for AGIs below $25k, 16.2% for AGIs $25k-50k, 74.7% for AGIs $50k-75k, 147.2% for AGIs $75k-100k, 176.4% for AGIs $100k-200k, 716.7% for AGIs over 200k)
Earned income credit: $2,197 (reported on 15.6% of returns)
Here:
$2,197
State:
$2,155
(% of AGI for various income ranges: 89.6% for AGIs below $25k, 56.6% for AGIs $25k-50k, 1.1% for AGIs $50k-75k)
Percentage of individuals using paid preparers for their 2020 taxes: 93.1%
Here:
93%
State:
94%
(% for various income ranges: 91.5% for AGIs below $25k, 94.0% for AGIs $25k-50k, 94.4% for AGIs $50k-75k, 92.2% for AGIs $75k-100k, 94.4% for AGIs $100k-200k, 90.9% for AGIs over 200k)
Averages for the 2012 tax year for zip code 53219, filed in 2013:
Average Adjusted Gross Income (AGI) in 2012: $42,983 (Individual Income Tax Returns)
Here:
$42,983
State:
$57,939
Salary/wage: $40,832 (reported on 84.7% of returns)
Here:
$40,832
State:
$48,248
(% of AGI for various income ranges: 73.2% for AGIs below $25k, 82.7% for AGIs $25k-50k, 80.9% for AGIs $50k-75k, 82.8% for AGIs $75k-100k, 81.5% for AGIs $100k-200k, 54.7% for AGIs over 200k)
Taxable interest for individuals: $762 (reported on 34.6% of returns)
This zip code:
$762
Wisconsin:
$1,224
(% of AGI for various income ranges: 1.1% for AGIs below $25k, 0.6% for AGIs $25k-50k, 0.5% for AGIs $50k-75k, 0.5% for AGIs $75k-100k, 0.6% for AGIs $100k-200k, 0.6% for AGIs over 200k)
Ordinary dividends: $2,532 (reported on 17.2% of returns)
Here:
$2,532
State:
$5,137
(% of AGI for various income ranges: 1.0% for AGIs below $25k, 0.8% for AGIs $25k-50k, 1.0% for AGIs $50k-75k, 0.6% for AGIs $75k-100k, 1.2% for AGIs $100k-200k, 5.6% for AGIs over 200k)
Net capital gain/loss in AGI: +$2,110 (reported on 10.8% of returns)
Here:
+$2,110
State:
+$11,137
(% of AGI for various income ranges: 0.1% for AGIs $25k-50k, 0.5% for AGIs $50k-75k, 0.4% for AGIs $75k-100k, 1.0% for AGIs $100k-200k, 5.9% for AGIs over 200k)
Profit/loss from business: +$9,350 (reported on 8.0% of returns)
Here:
+$9,350
State:
+$11,943
(% of AGI for various income ranges: 4.2% for AGIs below $25k, 1.2% for AGIs $25k-50k, 1.6% for AGIs $50k-75k, 1.4% for AGIs $75k-100k, 1.7% for AGIs $100k-200k)
Taxable individual retirement arrangement distribution: $9,823 (reported on 10.8% of returns)
53219:
$9,823
Wisconsin:
$14,087
(% of AGI for various income ranges: 3.7% for AGIs below $25k, 2.3% for AGIs $25k-50k, 2.2% for AGIs $50k-75k, 1.9% for AGIs $75k-100k, 3.0% for AGIs $100k-200k)
Self-employment retirement plans: $12,500 (reported on 0.2% of returns)
53219:
$12,500
Wisconsin:
$17,048
Total itemized deductions: $15,924 (23% of AGI, reported on 34.8% of returns)
Here:
$15,924
State:
$22,257
Here:
22.9% of AGI
State:
20.1% of AGI
(% of AGI for various income ranges: 8.4% for AGIs below $25k, 10.0% for AGIs $25k-50k, 14.2% for AGIs $50k-75k, 15.3% for AGIs $75k-100k, 15.0% for AGIs $100k-200k, 15.1% for AGIs over 200k)
Charity contributions: $1,822 (reported on 26.7% of returns)
Here:
$1,822
State:
$3,370
(% of AGI for various income ranges: 0.6% for AGIs below $25k, 0.8% for AGIs $25k-50k, 1.1% for AGIs $50k-75k, 1.4% for AGIs $75k-100k, 1.6% for AGIs $100k-200k, 1.9% for AGIs over 200k)
Taxes paid: $7,534 (reported on 34.8% of returns)
53219:
$7,534
State:
$10,731
(% of AGI for various income ranges: 2.7% for AGIs below $25k, 4.2% for AGIs $25k-50k, 6.6% for AGIs $50k-75k, 7.6% for AGIs $75k-100k, 8.4% for AGIs $100k-200k, 7.3% for AGIs over 200k)
Earned income credit: $2,002 (reported on 15.3% of returns)
Here:
$2,002
State:
$2,094
(% of AGI for various income ranges: 4.8% for AGIs below $25k, 0.7% for AGIs $25k-50k)
Percentage of individuals using paid preparers for their 2012 taxes: 48.1%
Here:
48%
State:
54%
(% for various income ranges: 46.1% for AGIs below $25k, 47.2% for AGIs $25k-50k, 50.2% for AGIs $50k-75k, 51.6% for AGIs $75k-100k, 52.6% for AGIs $100k-200k, 60.0% for AGIs over 200k)
Averages for the 2004 tax year for zip code 53219, filed in 2005:
Average Adjusted Gross Income (AGI) in 2004: $38,349 (Individual Income Tax Returns)
Here:
$38,349
State:
$47,735
Salary/wage: $37,257 (reported on 84.8% of returns)
Here:
$37,257
State:
$41,540
(% of AGI for various income ranges: 73.4% for AGIs below $10k, 71.2% for AGIs $10k-25k, 84.5% for AGIs $25k-50k, 85.8% for AGIs $50k-75k, 85.5% for AGIs $75k-100k, 75.4% for AGIs over 100k)
Taxable interest for individuals: $1,046 (reported on 52.5% of returns)
This zip code:
$1,046
Wisconsin:
$1,420
(% of AGI for various income ranges: 5.1% for AGIs below $10k, 3.2% for AGIs $10k-25k, 1.2% for AGIs $25k-50k, 0.9% for AGIs $50k-75k, 0.9% for AGIs $75k-100k, 1.7% for AGIs over 100k)
Taxable dividends: $1,524 (reported on 24.3% of returns)
Here:
$1,524
State:
$2,869
(% of AGI for various income ranges: 2.6% for AGIs below $10k, 1.3% for AGIs $10k-25k, 0.8% for AGIs $25k-50k, 0.7% for AGIs $50k-75k, 1.0% for AGIs $75k-100k, 1.5% for AGIs over 100k)
Net capital gain/loss: +$3,034 (reported on 15.6% of returns)
Here:
+$3,034
State:
+$9,569
(% of AGI for various income ranges: -1.4% for AGIs below $10k, 0.2% for AGIs $10k-25k, 0.5% for AGIs $25k-50k, 0.6% for AGIs $50k-75k, 1.1% for AGIs $75k-100k, 6.5% for AGIs over 100k)
Profit/loss from business: +$7,381 (reported on 7.7% of returns)
Here:
+$7,381
State:
+$10,417
(% of AGI for various income ranges: 3.8% for AGIs below $10k, 2.0% for AGIs $10k-25k, 1.0% for AGIs $25k-50k, 1.1% for AGIs $50k-75k, 1.5% for AGIs $75k-100k, 2.6% for AGIs over 100k)
IRA payment deduction: $2,275 (reported on 1.9% of returns)
53219:
$2,275
Wisconsin:
$2,900
(% of AGI for various income ranges: 0.1% for AGIs below $10k, 0.2% for AGIs $10k-25k, 0.2% for AGIs $25k-50k, 0.1% for AGIs $50k-75k, 0.1% for AGIs $75k-100k)
Self-employed pension: $7,204 (reported on 0.3% of returns)
Here:
$7,204
Wisconsin:
$11,934
(% of AGI for various income ranges: 0.0% for AGIs $25k-50k, 0.0% for AGIs $50k-75k, 0.1% for AGIs $75k-100k, 0.3% for AGIs over 100k)
Total itemized deductions: $13,856 (24% of AGI, reported on 39.7% of returns)
Here:
$13,856
State:
$18,160
Here:
23.7% of AGI
State:
21.1% of AGI
(% of AGI for various income ranges: 14.6% for AGIs below $10k, 10.5% for AGIs $10k-25k, 12.4% for AGIs $25k-50k, 16.1% for AGIs $50k-75k, 16.6% for AGIs $75k-100k, 15.3% for AGIs over 100k)
Charity contributions deductions: $1,590 (3% of AGI, reported on 33.9% of returns)
Here:
$1,590
State:
$2,711
Here:
2.6% of AGI
State:
3.0% of AGI
(% of AGI for various income ranges: 1.0% for AGIs below $10k, 0.9% for AGIs $10k-25k, 1.0% for AGIs $25k-50k, 1.6% for AGIs $50k-75k, 1.7% for AGIs $75k-100k, 1.9% for AGIs over 100k)
Total tax: $4,242 (reported on 79.9% of returns)
53219:
$4,242
State:
$7,114
(% of AGI for various income ranges: 1.6% for AGIs below $10k, 4.2% for AGIs $10k-25k, 7.7% for AGIs $25k-50k, 9.1% for AGIs $50k-75k, 10.3% for AGIs $75k-100k, 14.4% for AGIs over 100k)
Earned income credit: $1,352 (reported on 9.7% of returns)
Here:
$1,352
State:
$1,544
Percentage of individuals using paid preparers for their 2004 taxes: 51.9%
Here:
52%
State:
57%
(% for various income ranges: 45.9% for AGIs below $10k, 52.8% for AGIs $10k-25k, 52.0% for AGIs $25k-50k, 53.5% for AGIs $50k-75k, 55.0% for AGIs $75k-100k, 57.2% for AGIs over 100k)
Likely homosexual households (counted as self-reported same-sex unmarried-partner households)
Lesbian couples: 0.4% of all households
Gay men: 0.2% of all households
Household received Food Stamps/SNAP in the past 12 months: 2,764 Household did not receive Food Stamps/SNAP in the past 12 months: 12,732
Women who had a birth in the past 12 months: 595 (377 now married, 216 unmarried) Women who did not have a birth in the past 12 months: 7,562 (2,822 now married, 4,739 unmarried)
Housing units in zip code 53219 with a mortgage: 6,455 (616 second mortgage, 15 home equity loan, 550 both second mortgage and home equity loan) Houses without a mortgage: 498
Median monthly owner costs for units with a mortgage: $1,406 Median monthly owner costs for units without a mortgage: $636
Residents with income below the poverty level in 2022:
This zip code:
10.2%
Whole state:
10.7%
Residents with income below 50% of the poverty level in 2022:
This zip code:
6.0%
Whole state:
5.7%
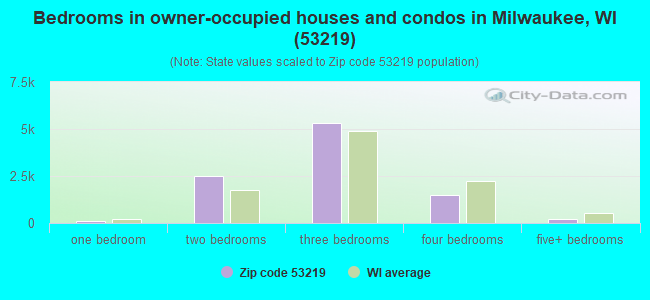
Median number of rooms in houses and condos:
Here:
5.7
State:
6.5
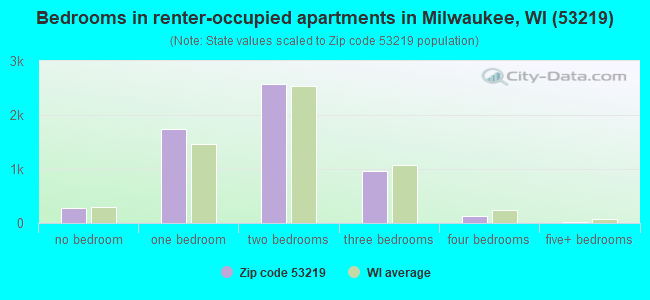
Median number of rooms in apartments:
Here:
4.0
State:
4.1
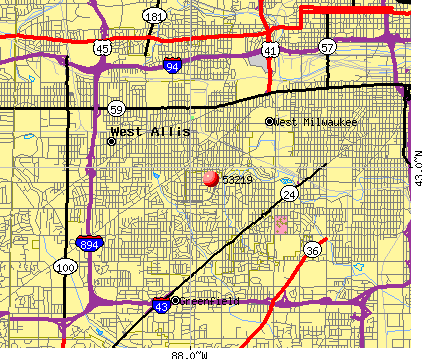
Notable locations in this zip code not listed on our city pages
Notable locations in zip code 53219: Meda - Care Ambulance Station 3 (A), Milwaukee Fire Department Engine 33 (B), Milwaukee Fire Department Engine 10 (C), West Allis-West Milwaukee Recreation Center (D), Saint Josephs Home (E), West Allis Fire Department Station 2 (F), East Branch West Allis Public Library (G). Display/hide their locations on the map
Churches in zip code 53219 include: Saint Augustine Roman Catholic Church (A), Trinity Evangelical Lutheran Church (B), Third Spiritual Science Church (C), The Church of Jesus Christ of Latter Day Saints (D), Divine Peace Lutheran Church (E), Zion United Church of Christ (F), Our Lady of Mount Carmel Catholic Church (G), Saint Pauls Lutheran Church (H), Saint Peters Episcopal Church (I). Display/hide their locations on the map
Parks in zip code 53219 include: Arnold Klentz Park (1), Manitoba Park (2), Fred Zirkel Field (3), Fairview Playground (4), Kinnickinnic River Parkway (5), Lyons Park (6), McCarty Park (7), Rogers Park (8). Display/hide their locations on the map
Tourist attraction (not listed on the city page) : D J Novelty Inc (Amusement & Theme Parks; 4520 West Forest Home Avenue).
4,507 married couples with children.
2,452 single-parent households (795 men, 1,657 women).
78.5% of residents of 53219 zip code speak English at home.
16.5% of residents speak Spanish at home (61% very well, 20% well, 16% not well, 3% not at all).
1.1% of residents speak other Indo-European language at home (72% very well, 9% well, 18% not well).
2.8% of residents speak Asian or Pacific Island language at home (50% very well, 19% well, 23% not well, 8% not at all).
0.5% of residents speak other language at home (52% very well, 5% well, 43% not well).
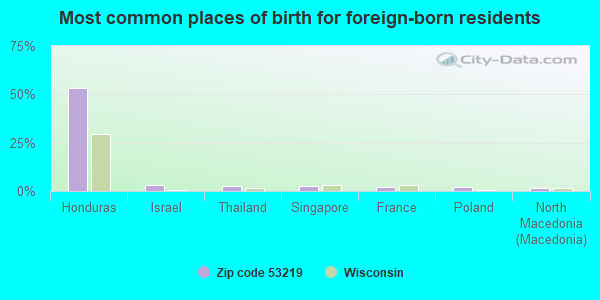
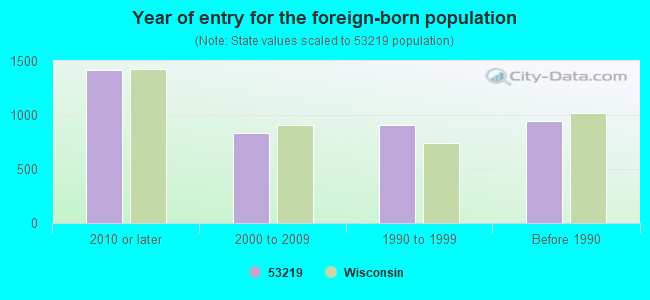
Foreign born population: 3,238 (9.2%) (36.6% of them are naturalized citizens)
Major facilities with environmental interests located in this zip code:
CHROMETECH OF WISCONSIN (4430 WEST BURNHAM STREET in MILWAUKEE, WI)
AIR MAJOR (AIRS/AFS) (Resource Conservation and Recovery Act (tracking hazardous waste)) TRI REPORTER (Tracking of toxic chemicals releasing facilities) STATE MASTER (Wisconsin database) - TRIS-53219CHRMT4430W, TRI REPORTER Business SIC classification: ELECTROPLATING, PLATING, POLISHING, ANODIZING, AND COLORING Organizations: CHROMETECH OF WI INC, HENRY ALAN D (CONTACT/OWNER)
Alternative names: CHROME TECH OF WISCONSIN
ALLIS AUTOMOTIVE (6205 W LINCOLN AVE in WEST ALLIS, WI)
(Resource Conservation and Recovery Act (tracking hazardous waste)) STATE MASTER (Wisconsin database) - RCRAINFO-WI0000127324, CESQG Organizations: BOERNER NED (CONTACT/OWNER)
BELOIT ROAD VALET CLEANERS INC (6854 W BELOIT RD in WEST ALLIS, WI)
Small Quantity Generators, between 100 kg and 1000 kg of hazardous waste/month (Resource Conservation and Recovery Act (tracking hazardous waste)) - notification STATE MASTER (Wisconsin database) - RCRAINFO-WID076145564, SQG Business SIC classification: COIN-OPERATED LAUNDRIES AND DRYCLEANING Organizations: BELOIT RD VALET CLEANERS INC (CONTACT/OWNER)
ALLIS AUTO PARTS (682 S 76TH ST in MILWAUKEE, WI)
Small Quantity Generators, between 100 kg and 1000 kg of hazardous waste/month (Resource Conservation and Recovery Act (tracking hazardous waste)) - notification STATE MASTER (Wisconsin database) - RCRAINFO-WID988629671, CESQG Business SIC classification: MOTOR VEHICLE PARTS, USED Organizations: ACE AUTO SALVAGE, SUTTNER MICHAEL AND KATHLEEN (CONTACT/OWNER)
Alternative names: SUTTNER INDUSTRIES ALLIS AUTO
ALLIS SUPPLY (6705 W BELOIT in WEST ALLIS, WI)
Small Quantity Generators, between 100 kg and 1000 kg of hazardous waste/month (Resource Conservation and Recovery Act (tracking hazardous waste)) - notification STATE MASTER (Wisconsin database) - RCRAINFO-WI0000066068, SQG Business SIC classification: PAINTS, VARNISHES, LACQUERS, ENAMELS, AND ALLIED PRODUCTS Business NAICS classification: PAINT AND COATING MANUFACTURING. Organizations: BOOTH JOE (CONTACT/OWNER)
BAYCHAR AUTO SERVICE (6733 W OKLAHOMA AVE in MILWAUKEE, WI)
Conditionally Exempt Small Quantity Generators, less than 100 kg/month of hazardous waste (Resource Conservation and Recovery Act (tracking hazardous waste)) - notification STATE MASTER (Wisconsin database) - RCRAINFO-WID988581294, CESQG Business SIC classification: GENERAL AUTOMOTIVE REPAIR SHOPS Organizations: QUARTULLO AL (CONTACT/OWNER)
BURG, ADOLF& IRENE B ESTATE (1927 S 70TH ST in WEST ALLIS, WI)
Small Quantity Generators, between 100 kg and 1000 kg of hazardous waste/month (Resource Conservation and Recovery Act (tracking hazardous waste)) - notification STATE MASTER (Wisconsin database) - RCRAINFO-WIR000045708, HAZARDOUS WASTE PROGRAM Organizations: BURG ESTATE C/O SCHWARZ/KAHLER (CONTACT/OWNER)
Alternative names: BURG ESTATE ADOLF & IRENE
CLARK OIL (3100 S 60TH ST in MILWAUKEE, WI)
Conditionally Exempt Small Quantity Generators, less than 100 kg/month of hazardous waste (Resource Conservation and Recovery Act (tracking hazardous waste)) - notification STATE MASTER (Wisconsin database) - RCRAINFO-WID988608667, CESQG Organizations: CLARK OIL STATION #2849900, CLARK OIL AND REFINING (CONTACT/OWNER)
Alternative names: CLARK OIL AND REFINING
BOBS GLASS SERVICE (6800 W BEECHER ST in WEST ALLIS, WI)
Conditionally Exempt Small Quantity Generators, less than 100 kg/month of hazardous waste (Resource Conservation and Recovery Act (tracking hazardous waste)) STATE MASTER (Wisconsin database) - RCRAINFO-WID988588265, CESQG
A C TRUCKING CO INC (FORMER) (5519 W HAYES AVENUE in MILWAUKEE, WI)
(Resource Conservation and Recovery Act (tracking hazardous waste)) Organizations: GORDON DE ROSSO (CONTACT/OWNER)
CENTER POINT PROPERTIES TRUST (2025 THRU 2207 S 114TH ST in WEST ALLIS, WI)
(Resource Conservation and Recovery Act (tracking hazardous waste)) Organizations: AMOCO OIL CO (CONTACT/OWNER)
Housing units lacking complete plumbing facilities: 0.3% Housing units lacking complete kitchen facilities: 0.9%
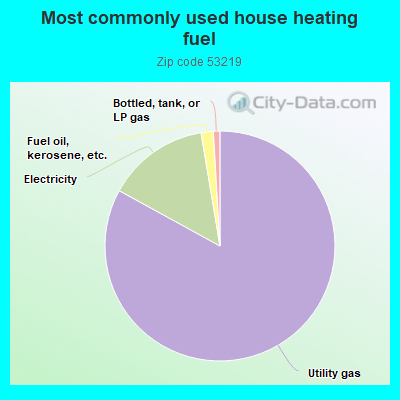
82.0%Utility gas
14.2%Electricity
1.7%Fuel oil, kerosene, etc.
0.9%Bottled, tank, or LP gas
Population in 1990: 35,271.
Place of birth for U.S.-born residents:
This state: 26,273
Northeast: 414
Midwest: 2,286
South: 1,208
West: 921
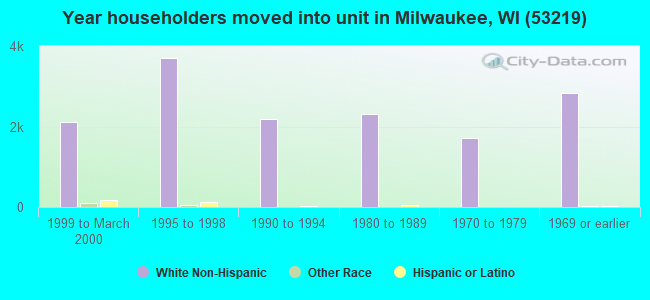
62% of the 53219 zip code residents lived in the same house 5 years ago. Out of people who lived in different houses, 78% lived in this county. Out of people who lived in different counties, 50% lived in Wisconsin.
90% of the 53219 zip code residents lived in the same house 1 year ago. Out of people who lived in different houses, 66% moved from this county. Out of people who lived in different houses, 17% moved from different county within same state. Out of people who lived in different houses, 8% moved from different state. Out of people who lived in different houses, 7% moved from abroad.
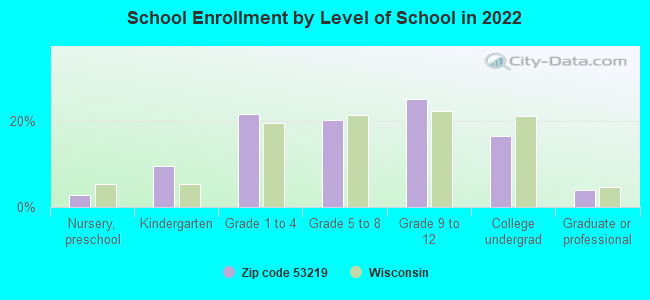
Private vs. public school enrollment:
Students in private schools in grades 1 to 8 (elementary and middle school): 706
Here:
23.7%
Wisconsin:
16.7%
Students in private schools in grades 9 to 12 (high school): 277
Here:
15.5%
Wisconsin:
12.5%
Students in private undergraduate colleges: 410
Here:
34.8%
Wisconsin:
17.5%
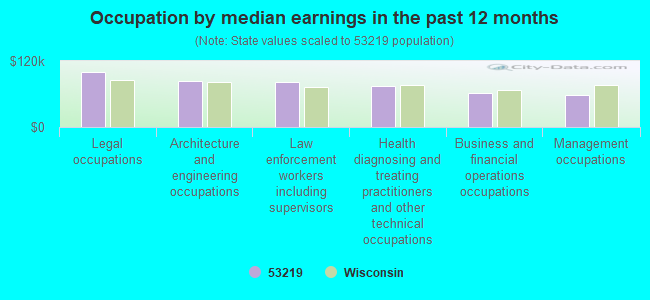
Occupation by median earnings in the past 12 months ($)
99,250Legal occupations
83,202Architecture and engineering occupations
81,105Law enforcement workers including supervisors
74,827Health diagnosing and treating practitioners and other technical occupations
62,141Business and financial operations occupations
58,522Management occupations
Companies with federal contracts located in this zip code:
THE OILGEAR COMPANY (2300 S 51ST ST in MILWAUKEE, WI) : $9,760,827 in 44 contractsfrom 2000 to 2006
Contracts for Lubrication and Fuel Dispensing Equipment, Hydraulic and Pneumatic Presses, Power Driven, Liquid and Gas Flow, Liquid Level, and Mechanical Motion Measuring Instruments, Maintenance, Repair and Rebuilding of Equipment -- Pumps and Compressors, and moreby Defense Logistics Agency, Navy, U.S. Army Corps of Engineers - civil program financing only, Army, and others Signed by year:2000: $105,958; 2001: $215,942; 2002: $344,361; 2003: $4,200; 2004: $3,840,447; 2005: $2,783,422; 2006: $2,466,497.
Biggest contracts:
$1,389,522 with Defense Logistics Agency for Lubrication and Fuel Dispensing Equipment. Signed on 2004-03-29. Completion date: 2005-01-24.
$910,200, same as above.Signed on 2004-09-03. Completion date: 2005-03-01.
$790,210, same as above.Signed on 2004-09-03. Completion date: 2005-03-01.
$745,452 with Defense Logistics Agency for Hydraulic and Pneumatic Presses, Power Driven. Signed on 2006-06-12. Completion date: 2006-11-15.
STATE PAINTING COMPANY (2141 S 55TH STREET in WEST ALLIS, WI; small business)
$5,490 with Air Force for Maintenance, Repair or Alteration of Real Property -- Miscellaneous Buildings. Signed on 2004-07-29. Completion date: 2004-09-10.
HEISER TRAILER SALES INC (4415 W BURNHAM ST in MILWAUKEE, WI; small business) : $4,389 in 2 contractsin 2005
$5,000 with Army for Maintenance, Repair and Rebuilding of Equipment -- Vehicular Equipment Components. Signed on 2005-01-11. Completion date: 2005-01-28.
-$611, same as above.Signed on 2005-01-18. Completion date: 2005-01-28.
Top industries in this zip code by the number of employees in 2005:
Wholesale Trade: Medical, Dental, and Hospital Equipment and Supplies Merchant Wholesalers (500-999 employees: 1 establishment, 5-9 employees: 1 establishment)
2002 - 2018 National Fire Incident Reporting System (NFIRS) incidents
According to the data from the years 2002 - 2018 the average number of fire incidents per year is 42. The highest number of fire incidents - 68 took place in 2015, and the least - 1 in 2006. The data has an increasing trend.
When looking into fire subcategories, the most incidents belonged to: Structure Fires (53.7%), and Outside Fires (27.7%).
Fire incident types reported to NFIRS in Zip Code 53219
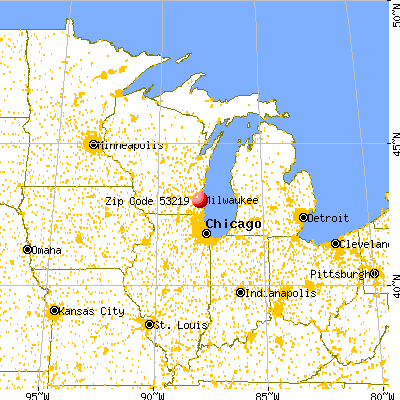


 Nearest zip codes: 53220, 53214, 53295, 53227, 53215, 53213.
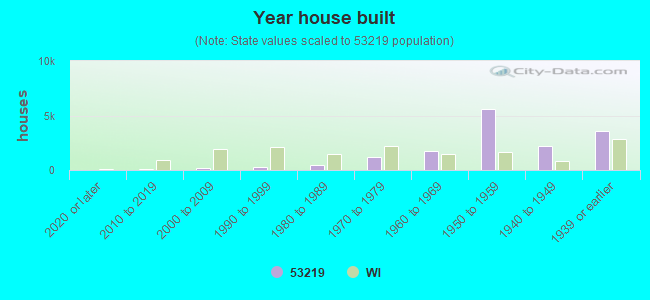


 According to the data from the years 2002 - 2018 the average number of fire incidents per year is 42. The highest number of fire incidents - 68 took place in 2015, and the least - 1 in 2006. The data has an increasing trend.
 When looking into fire subcategories, the most incidents belonged to: Structure Fires (53.7%), and Outside Fires (27.7%).