Estimated zip code population in 2022: 38,011 Zip code population in 2010: 27,958 Zip code population in 2000: 26,715
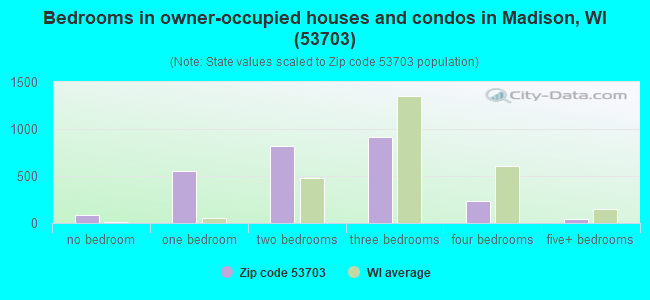
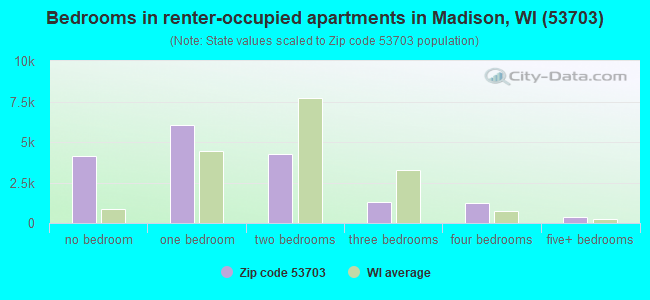
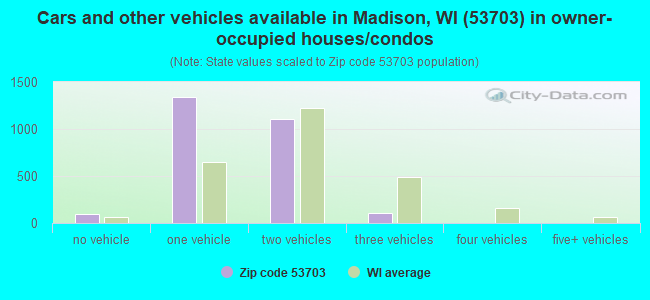
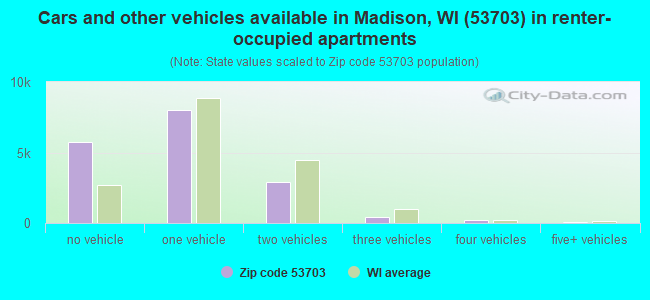
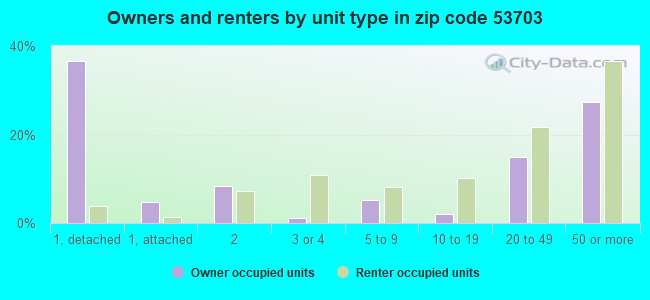
Houses and condos: 20,886 Renter-occupied apartments: 17,189
% of renters here:
87%
State:
32%
March 2022 cost of living index in zip code 53703: 104.1 (near average, U.S. average is 100)
Land area: 1.8 sq. mi. Water area: 0.0 sq. mi.
Population density: 20,886 people per square mile
(very high).
OSM Map
General Map
Google Map
MSN Map
OSM Map
General Map
Google Map
MSN Map
OSM Map
General Map
Google Map
MSN Map
OSM Map
General Map
Google Map
MSN Map
Please wait while loading the map...
Real estate property taxes paid for housing units in 2022:
This zip code:
1.7% ($8,724)
Wisconsin:
1.4% ($3,497)
Median real estate property taxes paid for housing units with mortgages in 2022: $8,136 (1.7%) Median real estate property taxes paid for housing units with no mortgage in 2022: $9,601 (1.5%)
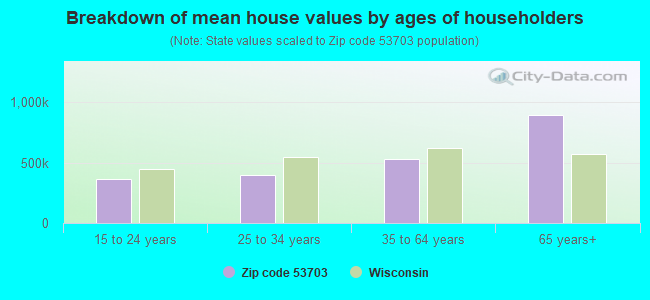
Estimated median house/condo value in 2022: $504,289
53703:
$504,289
Wisconsin:
$252,800
According to our research of Wisconsin and other state lists, there were 67 registered sex offenders living in 53703 zip code as of April 27, 2024. The ratio of all residents to sex offenders in zip code 53703 is 457 to 1. The ratio of registered sex offenders to all residents in this zip code is lower than the state average.
Median resident age:
This zip code:
24.9 years
Wisconsin median age:
40.4 years
Average household size:
This zip code:
1.8 people
Wisconsin:
2.3 people
Averages for the 2020 tax year for zip code 53703, filed in 2021:
Average Adjusted Gross Income (AGI) in 2020: $72,045 (Individual Income Tax Returns)
Here:
$72,045
State:
$72,319
Salary/wage: $54,843 (reported on 91.3% of returns)
Here:
$54,843
State:
$59,242
(% of AGI for various income ranges: 1329.1% for AGIs below $25k, 3954.5% for AGIs $25k-50k, 7504.8% for AGIs $50k-75k, 12016.3% for AGIs $75k-100k, 20748.9% for AGIs $100k-200k, 85918.4% for AGIs over 200k)
Taxable interest for individuals: $1,780 (reported on 30.9% of returns)
This zip code:
$1,780
Wisconsin:
$1,431
(% of AGI for various income ranges: 8.0% for AGIs below $25k, 11.9% for AGIs $25k-50k, 27.2% for AGIs $50k-75k, 53.3% for AGIs $75k-100k, 181.7% for AGIs $100k-200k, 2539.5% for AGIs over 200k)
Ordinary dividends: $7,547 (reported on 27.8% of returns)
Here:
$7,547
State:
$6,481
(% of AGI for various income ranges: 23.0% for AGIs below $25k, 33.7% for AGIs $25k-50k, 83.4% for AGIs $50k-75k, 247.5% for AGIs $75k-100k, 828.9% for AGIs $100k-200k, 9493.7% for AGIs over 200k)
Net capital gain/loss in AGI: +$24,073 (reported on 26.1% of returns)
Here:
+$24,073
State:
+$18,329
(% of AGI for various income ranges: 18.9% for AGIs below $25k, 42.5% for AGIs $25k-50k, 101.1% for AGIs $50k-75k, 327.3% for AGIs $75k-100k, 1256.9% for AGIs $100k-200k, 37990.0% for AGIs over 200k)
Profit/loss from business: +$13,202 (reported on 10.3% of returns)
Here:
+$13,202
State:
+$14,562
(% of AGI for various income ranges: 60.4% for AGIs below $25k, 72.2% for AGIs $25k-50k, 125.4% for AGIs $50k-75k, 265.2% for AGIs $75k-100k, 456.0% for AGIs $100k-200k, 3794.7% for AGIs over 200k)
Taxable individual retirement arrangement distribution: $28,932 (reported on 4.9% of returns)
53703:
$28,932
Wisconsin:
$19,348
(% of AGI for various income ranges: 7.5% for AGIs below $25k, 25.8% for AGIs $25k-50k, 62.6% for AGIs $50k-75k, 263.6% for AGIs $75k-100k, 960.7% for AGIs $100k-200k, 4608.9% for AGIs over 200k)
Self-employed (Keogh) retirement plans: $21,362 (reported on 0.6% of returns)
53703:
$21,362
Wisconsin:
$21,322
(% of AGI for various income ranges: 62.9% for AGIs $75k-100k, 657.9% for AGIs over 200k)
Total itemized deductions: $45,047 (reported on 7.4% of returns)
Here:
$45,047
State:
$33,000
(% of AGI for various income ranges: 19.9% for AGIs below $25k, 43.1% for AGIs $25k-50k, 164.1% for AGIs $50k-75k, 463.8% for AGIs $75k-100k, 1256.0% for AGIs $100k-200k, 15211.6% for AGIs over 200k)
Charity contributions: $20,462 (reported on 5.9% of returns)
Here:
$20,462
State:
$12,044
(% of AGI for various income ranges: 5.0% for AGIs $25k-50k, 17.9% for AGIs $50k-75k, 80.4% for AGIs $75k-100k, 289.5% for AGIs $100k-200k, 7146.8% for AGIs over 200k)
Taxes paid: $9,098 (reported on 7.3% of returns)
53703:
$9,098
State:
$8,228
(% of AGI for various income ranges: 4.5% for AGIs below $25k, 11.9% for AGIs $25k-50k, 67.8% for AGIs $50k-75k, 184.8% for AGIs $75k-100k, 442.3% for AGIs $100k-200k, 1577.4% for AGIs over 200k)
Earned income credit: $1,016 (reported on 6.5% of returns)
Here:
$1,016
State:
$2,155
(% of AGI for various income ranges: 19.8% for AGIs below $25k, 6.7% for AGIs $25k-50k)
Percentage of individuals using paid preparers for their 2020 taxes: 94.1%
Here:
94%
State:
94%
(% for various income ranges: 92.9% for AGIs below $25k, 94.8% for AGIs $25k-50k, 94.4% for AGIs $50k-75k, 94.2% for AGIs $75k-100k, 94.2% for AGIs $100k-200k, 95.8% for AGIs over 200k)
Averages for the 2012 tax year for zip code 53703, filed in 2013:
Average Adjusted Gross Income (AGI) in 2012: $51,121 (Individual Income Tax Returns)
Here:
$51,121
State:
$57,939
Salary/wage: $39,552 (reported on 92.5% of returns)
Here:
$39,552
State:
$48,248
(% of AGI for various income ranges: 94.4% for AGIs below $25k, 91.8% for AGIs $25k-50k, 87.1% for AGIs $50k-75k, 82.3% for AGIs $75k-100k, 72.1% for AGIs $100k-200k, 38.7% for AGIs over 200k)
Taxable interest for individuals: $1,601 (reported on 31.1% of returns)
This zip code:
$1,601
Wisconsin:
$1,224
(% of AGI for various income ranges: 0.5% for AGIs below $25k, 0.3% for AGIs $25k-50k, 0.5% for AGIs $50k-75k, 0.7% for AGIs $75k-100k, 1.2% for AGIs $100k-200k, 1.8% for AGIs over 200k)
Ordinary dividends: $5,969 (reported on 23.1% of returns)
Here:
$5,969
State:
$5,137
(% of AGI for various income ranges: 1.1% for AGIs below $25k, 1.0% for AGIs $25k-50k, 1.7% for AGIs $50k-75k, 2.0% for AGIs $75k-100k, 3.3% for AGIs $100k-200k, 4.8% for AGIs over 200k)
Net capital gain/loss in AGI: +$11,180 (reported on 17.4% of returns)
Here:
+$11,180
State:
+$11,137
(% of AGI for various income ranges: 0.5% for AGIs $25k-50k, 0.8% for AGIs $50k-75k, 1.4% for AGIs $75k-100k, 3.2% for AGIs $100k-200k, 10.0% for AGIs over 200k)
Profit/loss from business: +$13,391 (reported on 10.7% of returns)
Here:
+$13,391
State:
+$11,943
(% of AGI for various income ranges: 3.3% for AGIs below $25k, 2.2% for AGIs $25k-50k, 2.1% for AGIs $50k-75k, 2.4% for AGIs $75k-100k, 4.3% for AGIs $100k-200k, 2.5% for AGIs over 200k)
Taxable individual retirement arrangement distribution: $21,344 (reported on 5.2% of returns)
53703:
$21,344
Wisconsin:
$14,087
(% of AGI for various income ranges: 0.6% for AGIs below $25k, 0.7% for AGIs $25k-50k, 1.6% for AGIs $50k-75k, 1.7% for AGIs $75k-100k, 3.0% for AGIs $100k-200k, 3.7% for AGIs over 200k)
Self-employment retirement plans: $20,886 (reported on 0.6% of returns)
53703:
$20,886
Wisconsin:
$17,048
(% of AGI for various income ranges: 0.3% for AGIs below $25k, 0.6% for AGIs $100k-200k, 0.3% for AGIs over 200k)
Total itemized deductions: $28,225 (19% of AGI, reported on 19.5% of returns)
Here:
$28,225
State:
$22,257
Here:
18.8% of AGI
State:
20.1% of AGI
(% of AGI for various income ranges: 2.8% for AGIs below $25k, 4.1% for AGIs $25k-50k, 8.5% for AGIs $50k-75k, 12.0% for AGIs $75k-100k, 16.3% for AGIs $100k-200k, 15.1% for AGIs over 200k)
Charity contributions: $5,734 (reported on 15.1% of returns)
Here:
$5,734
State:
$3,370
(% of AGI for various income ranges: 0.2% for AGIs below $25k, 0.3% for AGIs $25k-50k, 0.7% for AGIs $50k-75k, 1.2% for AGIs $75k-100k, 1.9% for AGIs $100k-200k, 3.6% for AGIs over 200k)
Taxes paid: $14,879 (reported on 19.5% of returns)
53703:
$14,879
State:
$10,731
(% of AGI for various income ranges: 0.9% for AGIs below $25k, 1.6% for AGIs $25k-50k, 3.9% for AGIs $50k-75k, 5.9% for AGIs $75k-100k, 9.2% for AGIs $100k-200k, 8.6% for AGIs over 200k)
Earned income credit: $732 (reported on 9.9% of returns)
Here:
$732
State:
$2,094
(% of AGI for various income ranges: 1.1% for AGIs below $25k)
Percentage of individuals using paid preparers for their 2012 taxes: 27.7%
Here:
28%
State:
54%
(% for various income ranges: 20.7% for AGIs below $25k, 24.9% for AGIs $25k-50k, 32.8% for AGIs $50k-75k, 37.3% for AGIs $75k-100k, 50.0% for AGIs $100k-200k, 75.8% for AGIs over 200k)
Averages for the 2004 tax year for zip code 53703, filed in 2005:
Average Adjusted Gross Income (AGI) in 2004: $35,515 (Individual Income Tax Returns)
Here:
$35,515
State:
$47,735
Salary/wage: $28,041 (reported on 91.3% of returns)
Here:
$28,041
State:
$41,540
(% of AGI for various income ranges: 123.7% for AGIs below $10k, 92.1% for AGIs $10k-25k, 90.3% for AGIs $25k-50k, 81.0% for AGIs $50k-75k, 73.4% for AGIs $75k-100k, 45.2% for AGIs over 100k)
Taxable interest for individuals: $1,898 (reported on 39.5% of returns)
This zip code:
$1,898
Wisconsin:
$1,420
(% of AGI for various income ranges: 2.2% for AGIs below $10k, 0.9% for AGIs $10k-25k, 0.8% for AGIs $25k-50k, 1.7% for AGIs $50k-75k, 1.7% for AGIs $75k-100k, 3.5% for AGIs over 100k)
Taxable dividends: $4,788 (reported on 22.9% of returns)
Here:
$4,788
State:
$2,869
(% of AGI for various income ranges: 2.9% for AGIs below $10k, 1.0% for AGIs $10k-25k, 1.3% for AGIs $25k-50k, 2.2% for AGIs $50k-75k, 2.0% for AGIs $75k-100k, 5.5% for AGIs over 100k)
Net capital gain/loss: +$10,244 (reported on 17.5% of returns)
Here:
+$10,244
State:
+$9,569
(% of AGI for various income ranges: -0.3% for AGIs below $10k, 0.4% for AGIs $10k-25k, 0.8% for AGIs $25k-50k, 1.8% for AGIs $50k-75k, 3.1% for AGIs $75k-100k, 11.5% for AGIs over 100k)
Profit/loss from business: +$11,933 (reported on 9.6% of returns)
Here:
+$11,933
State:
+$10,417
(% of AGI for various income ranges: 3.6% for AGIs below $10k, 2.6% for AGIs $10k-25k, 2.5% for AGIs $25k-50k, 1.5% for AGIs $50k-75k, 5.6% for AGIs $75k-100k, 3.9% for AGIs over 100k)
IRA payment deduction: $2,450 (reported on 1.7% of returns)
53703:
$2,450
Wisconsin:
$2,900
(% of AGI for various income ranges: 0.2% for AGIs $10k-25k, 0.2% for AGIs $25k-50k, 0.3% for AGIs $50k-75k, 0.0% for AGIs over 100k)
Self-employed pension: $11,517 (reported on 0.9% of returns)
Here:
$11,517
Wisconsin:
$11,934
Total itemized deductions: $21,181 (20% of AGI, reported on 19.1% of returns)
Here:
$21,181
State:
$18,160
Here:
20.5% of AGI
State:
21.1% of AGI
(% of AGI for various income ranges: 5.6% for AGIs below $10k, 3.6% for AGIs $10k-25k, 6.5% for AGIs $25k-50k, 14.4% for AGIs $50k-75k, 18.4% for AGIs $75k-100k, 15.6% for AGIs over 100k)
Charity contributions deductions: $4,309 (4% of AGI, reported on 15.3% of returns)
Here:
$4,309
State:
$2,711
Here:
3.6% of AGI
State:
3.0% of AGI
(% of AGI for various income ranges: 0.3% for AGIs below $10k, 0.2% for AGIs $10k-25k, 0.7% for AGIs $25k-50k, 1.4% for AGIs $50k-75k, 2.0% for AGIs $75k-100k, 3.5% for AGIs over 100k)
Total tax: $6,186 (reported on 77.5% of returns)
53703:
$6,186
State:
$7,114
(% of AGI for various income ranges: 2.2% for AGIs below $10k, 5.6% for AGIs $10k-25k, 9.7% for AGIs $25k-50k, 11.7% for AGIs $50k-75k, 12.5% for AGIs $75k-100k, 20.9% for AGIs over 100k)
Earned income credit: $592 (reported on 8.4% of returns)
Here:
$592
State:
$1,544
Percentage of individuals using paid preparers for their 2004 taxes: 30.5%
Here:
30%
State:
57%
(% for various income ranges: 25.9% for AGIs below $10k, 26.2% for AGIs $10k-25k, 28.6% for AGIs $25k-50k, 40.5% for AGIs $50k-75k, 45.3% for AGIs $75k-100k, 64.9% for AGIs over 100k)
Likely homosexual households (counted as self-reported same-sex unmarried-partner households)
Lesbian couples: 0.3% of all households
Gay men: 0.2% of all households
Household received Food Stamps/SNAP in the past 12 months: 1,519 Household did not receive Food Stamps/SNAP in the past 12 months: 18,394
Women who had a birth in the past 12 months: 132 (70 now married, 61 unmarried) Women who did not have a birth in the past 12 months: 15,398 (1,296 now married, 14,103 unmarried)
Housing units in zip code 53703 with a mortgage: 1,593 (320 second mortgage, 318 both second mortgage and home equity loan) Houses without a mortgage: 1
Median monthly owner costs for units with a mortgage: $2,312 Median monthly owner costs for units without a mortgage: $1,447
Residents with income below the poverty level in 2022:
This zip code:
41.3%
Whole state:
10.7%
Residents with income below 50% of the poverty level in 2022:
This zip code:
12.8%
Whole state:
5.7%
Median number of rooms in houses and condos:
Here:
5.4
State:
6.5
Median number of rooms in apartments:
Here:
2.9
State:
4.1
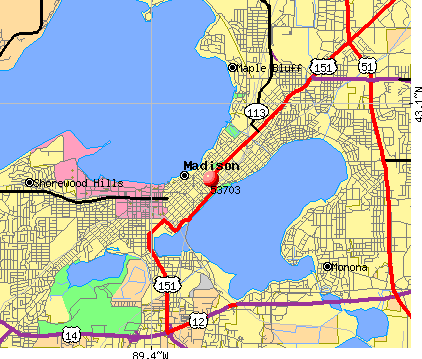
Notable locations in this zip code not listed on our city pages
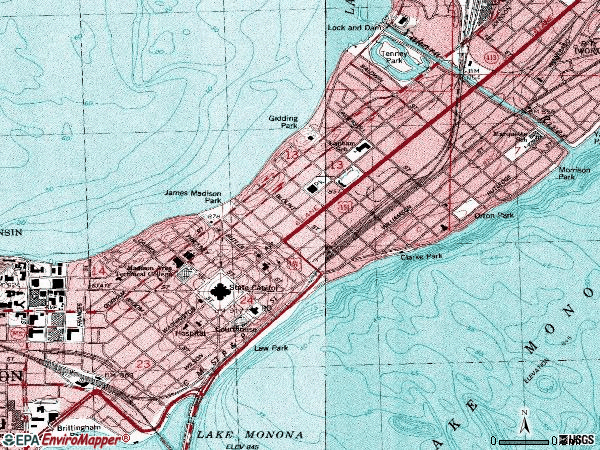
Notable locations in zip code 53703: Wisconsin State Capitol (A), Wisconsin Veterans Museum (B), Suhr Building (C), Nichols Station (D), Madison Public Library (E), Lowell Hall (F), Knapp Memorial Graduate Center (G), Dane County Jail (H), Tenney Plaza (I), Churchill Building (J), Hovde Building (K), Dane County Emergency Medical Services (L), Madison Fire Department Station 3 (M), Madison Fire Department Station 1 (N), Blount Generating Station (O), Madison Municipal Building (P). Display/hide their locations on the map
Churches in zip code 53703 include: Bethel Lutheran Church (A), Gates of Heaven Synagogue (B), Grace Episcopal Church (C), Holy Redeemer Church (D), Saint Johns Lutheran Church (E), Saint Patricks Church (F), Saint Pauls African Methodist Episcopal Church (G), Saint Raphael Cathedral (H), Wisconsin Lutheran Chapel (I). Display/hide their locations on the map
Parks in zip code 53703 include: Law Park (1), Orton Park (2), Tenney Park (3), Breese Stevens Field (4), Capitol Square (5), Elizabeth Link Peace Park (6), Gidding Park (7), James Madison Park (8), Period Garden Park (9). Display/hide their locations on the map
Tourist attractions (not listed on the city page) : Convention & Visitors Bureau Inc-Greater Madison - Tourist Information (615 East Washington Avenue), Association of Wisconsin Tourism Attraction (Tours & Charters; 44 East Mifflin Street Suite 900).
702 married couples with children.
174 single-parent households (31 men, 143 women).
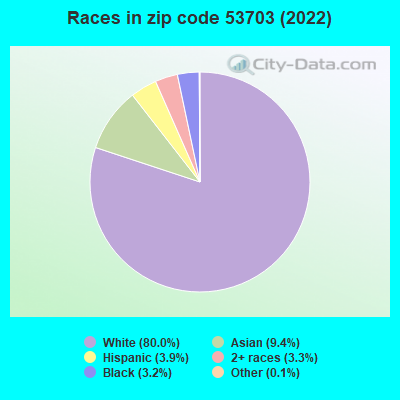
87.4% of residents of 53703 zip code speak English at home.
2.2% of residents speak Spanish at home (81% very well, 12% well, 6% not well).
4.6% of residents speak other Indo-European language at home (94% very well, 5% well, 1% not well).
4.3% of residents speak Asian or Pacific Island language at home (76% very well, 16% well, 7% not well).
0.9% of residents speak other language at home (95% very well, 5% well).
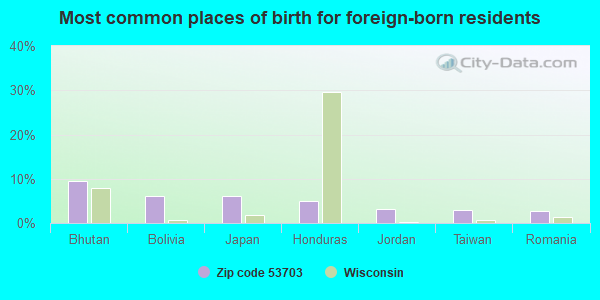
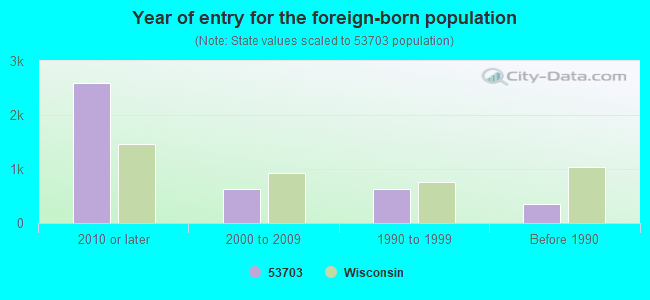
Foreign born population: 3,565 (9.4%) (30.9% of them are naturalized citizens)
Facilities with environmental interests located in this zip code:
BOCK CORPORATION (110 S DICKINSON ST in MADISON, WI)
AIR MINOR (AIRS/AFS) CRITERIA AND HAZARDOUS AIR POLLUTANT INVENTORY (Inventory of air pollution sources) Conditionally Exempt Small Quantity Generators, less than 100 kg/month of hazardous waste (Resource Conservation and Recovery Act (tracking hazardous waste)) - notification STATE MASTER (Wisconsin database) - NEI-WI113100570, AIR PROGRAM, RCRAINFO-WID006070916, CESQG Business SIC classification: HEATING EQUIPMENT, EXCEPT ELECTRIC AND WARM AIR FURNACES; HOUSEHOLD APPLIANCES Business NAICS classification: OTHER MAJOR HOUSEHOLD APPLIANCE MANUFACTURING. Organizations: BOCK WATER HEATERS (CONTACT/OWNER)
Alternative names: BOCK WATER HEATERS INC
ANDRAE AUTOMOTIVE (945 E WASHINGTON AVE in MADISON, WI)
(Resource Conservation and Recovery Act (tracking hazardous waste)) STATE MASTER (Wisconsin database) - RCRAINFO-WID023313471, CESQG Business SIC classification: MOTOR VEHICLE SUPPLIES AND NEW PARTS
ACCELERATED LEARNING ACAD MID (15 S BREARLY ST in MADISON, WI)
AIR MONITORING SITE (Airborne pollution emission tracking) (National Center for Education Statistics) - STATE ID-0340 Organizations: MADISON METROPOLITAN SCH DIST (SCHOOL DISTRICT)
Alternative names: ACCELERATED LEARNING ACAD HI, SAPAR PROGRAM HI, WORK & LEARNING HI
BIO RESOURCES INC (212 N BASSETT ST in MADISON, WI)
(Resource Conservation and Recovery Act (tracking hazardous waste))
ALL LAMP RECYCLING LLC (633 E WASHINGTON AVE in MADISON, WI)
Conditionally Exempt Small Quantity Generators, less than 100 kg/month of hazardous waste (Resource Conservation and Recovery Act (tracking hazardous waste)) - notification
Housing units lacking complete plumbing facilities: 0.6% Housing units lacking complete kitchen facilities: 1.0%
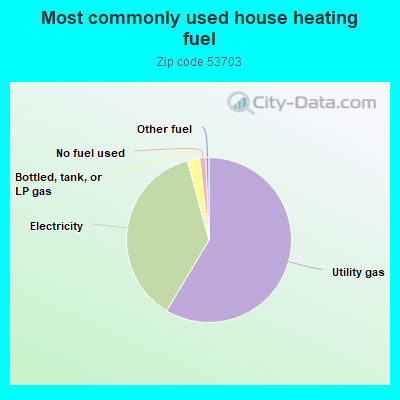
58.3%Utility gas
37.0%Electricity
2.4%Bottled, tank, or LP gas
1.2%No fuel used
0.6%Other fuel
Population in 1990: 25,721. Population change in the 1990s: +994 (+3.9%).
Place of birth for U.S.-born residents:
This state: 16,686
Northeast: 3,507
Midwest: 8,587
South: 2,578
West: 2,930
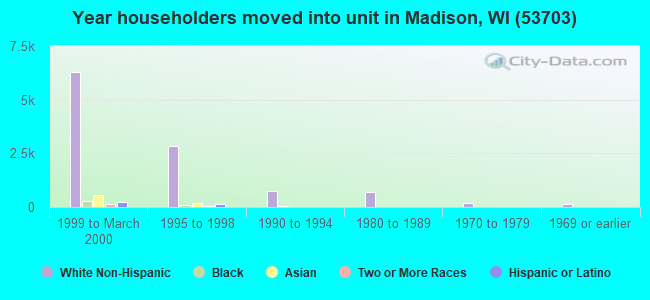
15% of the 53703 zip code residents lived in the same house 5 years ago. Out of people who lived in different houses, 30% lived in this county. Out of people who lived in different counties, 50% lived in Wisconsin.
67% of the 53703 zip code residents lived in the same house 1 year ago. Out of people who lived in different houses, 57% moved from this county. Out of people who lived in different houses, 14% moved from different county within same state. Out of people who lived in different houses, 23% moved from different state. Out of people who lived in different houses, 4% moved from abroad.
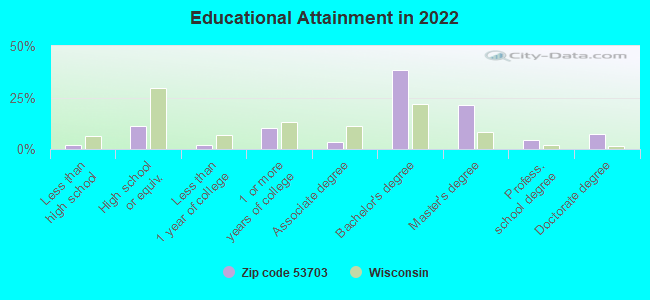
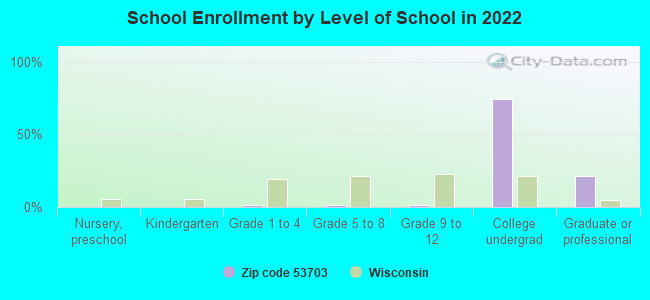
Private vs. public school enrollment:
Students in private schools in grades 1 to 8 (elementary and middle school): 117
Here:
29.9%
Wisconsin:
16.7%
Students in private schools in grades 9 to 12 (high school): 59
Here:
19.9%
Wisconsin:
12.5%
Students in private undergraduate colleges: 380
Here:
2.9%
Wisconsin:
17.5%
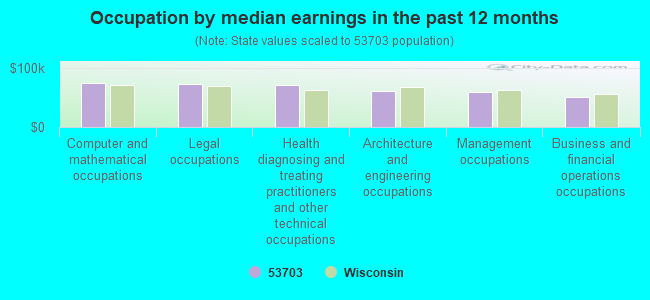
Occupation by median earnings in the past 12 months ($)
74,968Computer and mathematical occupations
72,922Legal occupations
71,396Health diagnosing and treating practitioners and other technical occupations
61,114Architecture and engineering occupations
60,452Management occupations
50,919Business and financial operations occupations
Companies with biggest federal contracts located in this zip code:
MERIDIAN RESOURCE CORPORATION (2 E MIFFLIN ST STE 403 in MADISON, WI) : $781,994 in 5 contractsfrom 2003 to 2004
Contracts for Other Professional Services, Other Medical Services by Department of Defense Signed by year:2000: $0; 2001: $0; 2002: $0; 2003: $829,628; 2004: -$47,634; 2005: $0; 2006: $0.
Biggest contracts:
$829,642 with Department of Defense for Other Professional Services. Signed on 2003-05-05. Completion date: 2004-04-04.
$0, same as above.Signed on 2004-11-12. Completion date: 1999-04-30.
$0 with Department of Defense for Other Medical Services. Signed on 2003-09-09. Completion date: 2004-04-04.
-$14, same as above.Signed on 2003-09-09. Completion date: 2004-04-04.
michael c. fiore (1107 Rutledge St. in Madison, WI; small business)
$123,000 with Offices, Boards and Divisions (includes Attorney General, Deputy Attorney General, etc.) for Expert Witness. Signed on 2005-03-17. Completion date: 2005-12-31.
STATE OF WISCONSIN (115 E STATE CAPITAL in MADISON, WI) 35522 employees, $0 revenue: $105,000 in 5 contractsfrom 2000 to 2001
Contracts for Maintenance, Repair and Rebuilding of Equipment -- Communication, Detection, and Coherent Radiation Equipment by National Oceanic and Atmospheric Administration/Under Secretary for Oceans and Atmosphere Signed by year:2000: $57,000; 2001: $48,000; 2002: $0; 2003: $0; 2004: $0; 2005: $0; 2006: $0.
Biggest contracts:
$48,000 with National Oceanic and Atmospheric Administration/Under Secretary for Oceans and Atmosphere for Maintenance, Repair and Rebuilding of Equipment -- Communication, Detection, and Coherent Radiation Equipment. Signed on 2001-01-15. Completion date: 2001-09-15.
$27,000, same as above.Signed on 2000-02-15. Completion date: 2004-09-15.
$19,000, same as above.Signed on 2000-02-15. Completion date: 2000-02-15.
$11,000, same as above.Signed on 2000-02-15. Completion date: 2000-02-15.
RESOURCE STRATEGIES INC (22 N CARROLL ST STE 300 in MADISON, WI; small business) : $75,000 in 3 contractsfrom 2003 to 2005
$25,000 with Air Force for ADP Data Conversion Services. Signed on 2005-09-14. Completion date: 2006-09-15.
$25,000 with Air Force for Automated Information System Design and Integration Services. Signed on 2004-09-22. Completion date: 2005-09-27.
$25,000, same as above.Signed on 2003-09-16. Completion date: 2004-09-14.
ARCHITECTURAL ARTS LTD (931 E MAIN ST in MADISON, WI; small business)
$34,000 with U.S. Army Corps of Engineers - civil program financing only for Other Professional Services. Signed on 2000-11-29. Completion date: 2001-03-15.
INTERWORKS LLC (116 N FEW STREET in MADISON, WI; small business) : $28,296 in 2 contractsin 2001
$28,296 with Department of Defense for Educational Services. Taking place in NC. Signed on 2001-11-19. Completion date: 2002-09-30.
$0, same as above.Signed on 2001-11-19. Completion date: 2002-09-30.
BEST WESTERN INC (22 S CARROLL ST in MADISON, WI; small business)
$10,680 with Army for Lodging - Hotel/Motel. Signed on 2002-06-10. Completion date: 2002-06-18.
MEDICAL TELEPHONE ANSWERING IN (44 E MIFFLIN ST STE 500 in MADISON, WI; small business)
$4,500 with Air Force for Telephone and/or Communications Services (includes Telegraph, Telex, and Cablevision Services). Signed on 2005-02-07. Completion date: 2005-09-30.
WISCONSIN COUNCIL OF SAFETY (501 E WASHINGTON AVE in MADISON, WI; small business)
$4,161 with Air Force for Vocational/Technical. Signed on 2005-09-29. Completion date: 2005-09-29.
MATRIX TEK, LLC (302 EAST WILSON ST, STE ON in MADISON, WI; small business)
$3,388 with Navy for ADP Software, Equipment, and Telecommunications Training. Signed on 2003-07-18. Completion date: 2003-07-25.
Top industries in this zip code by the number of employees in 2005:
Utilities: Other Electric Power Generation (500-999: 1)
Administrative and Support and Waste Management and Remediation Services: Temporary Help Services (250-499: 1, 100-249: 1, 50-99: 1, 20-49: 1, 5-9: 1, 1-4: 1)
2005 - 2018 National Fire Incident Reporting System (NFIRS) incidents
Based on the data from the years 2005 - 2018 the average number of fires per year is 43. The highest number of reported fire incidents - 103 took place in 2005, and the least - 0 in 2007. The data has a dropping trend.
When looking into fire subcategories, the most reports belonged to: Outside Fires (46.2%), and Structure Fires (36.4%).
Fire incident types reported to NFIRS in Zip Code 53703

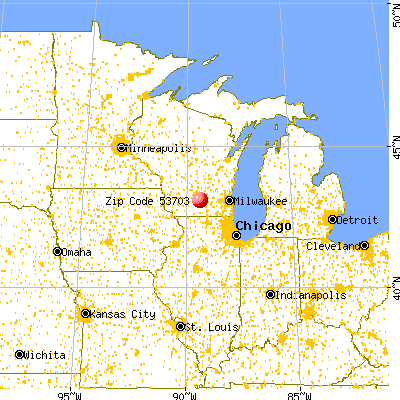


 Nearest zip codes: 53715, 53706, 53713, 53726, 53792, 53704.
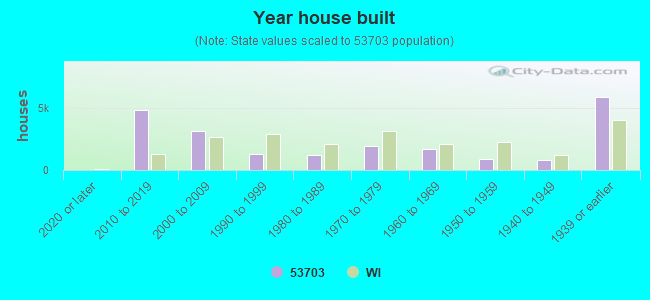


 Based on the data from the years 2005 - 2018 the average number of fires per year is 43. The highest number of reported fire incidents - 103 took place in 2005, and the least - 0 in 2007. The data has a dropping trend.
 When looking into fire subcategories, the most reports belonged to: Outside Fires (46.2%), and Structure Fires (36.4%).