Estimated zip code population in 2022: 6,794 Zip code population in 2010: 6,926 Zip code population in 2000: 6,480
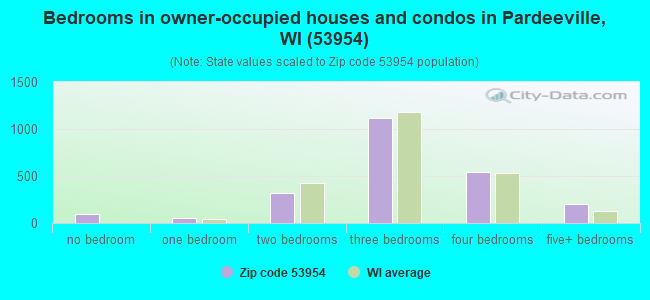
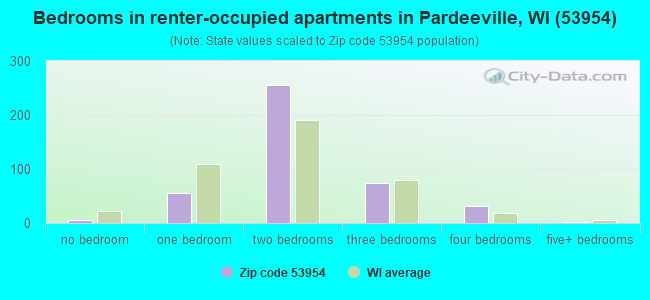
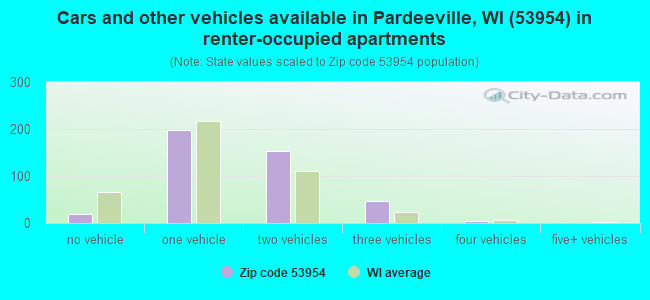
Houses and condos: 2,948 Renter-occupied apartments: 427
% of renters here:
16%
State:
32%
March 2022 cost of living index in zip code 53954: 87.1 (less than average, U.S. average is 100)
Land area: 79.3 sq. mi. Water area: 2.7 sq. mi.
Population density: 86 people per square mile
(very low).
OSM Map
General Map
Google Map
MSN Map
OSM Map
General Map
Google Map
MSN Map
OSM Map
General Map
Google Map
MSN Map
OSM Map
General Map
Google Map
MSN Map
Please wait while loading the map...
Real estate property taxes paid for housing units in 2022:
This zip code:
1.1% ($2,696)
Wisconsin:
1.4% ($3,497)
Median real estate property taxes paid for housing units with mortgages in 2022: $2,791 (1.1%) Median real estate property taxes paid for housing units with no mortgage in 2022: $2,463 (1.0%)
Business Search- 14 Million verified businesses
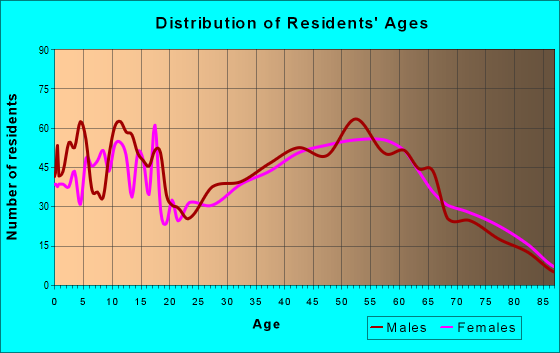
Males: 3,508
(51.6%)
Females: 3,285
(48.4%)
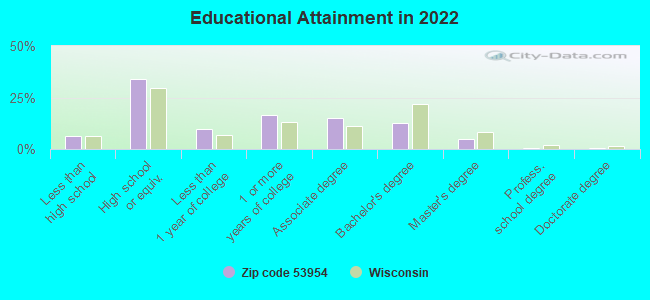
For population 25 years and over in 53954:
High school or higher: 92.4%
Bachelor's degree or higher: 18.3%
Graduate or professional degree: 6.0%
Unemployed: 1.6%
Mean travel time to work (commute): 28.9 minutes
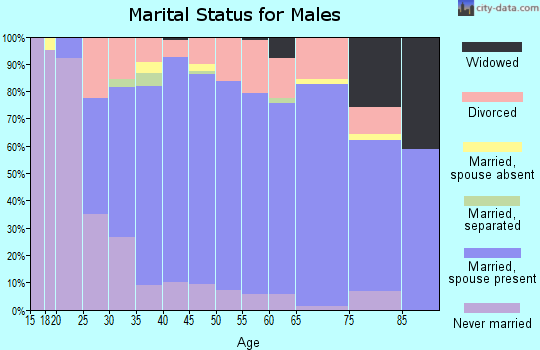
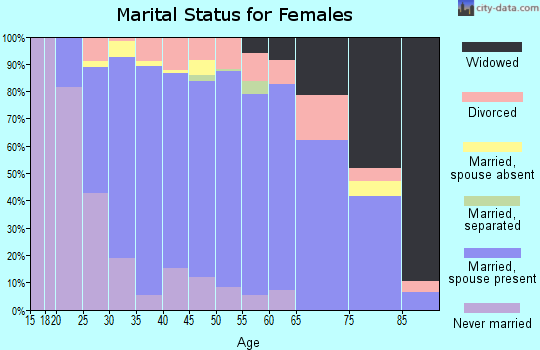
For population 15 years and over in 53954:
Never married: 24.0%
Now married: 58.4%
Separated: 0.7%
Widowed: 5.6%
Divorced: 11.2%
Zip code 53954 compared to state average:
Unemployed percentage below state average.
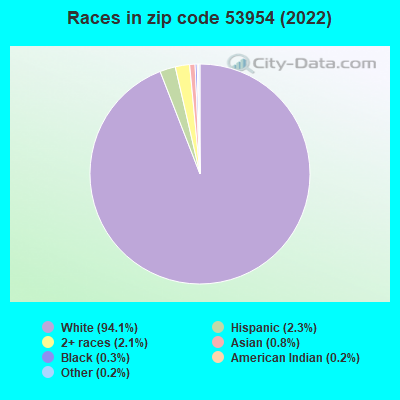
Black race population percentage significantly below state average.
Hispanic race population percentage significantly below state average.
Foreign-born population percentage below state average.
Renting percentage below state average.
Length of stay since moving in above state average.
Percentage of population with a bachelor's degree or higher below state average.
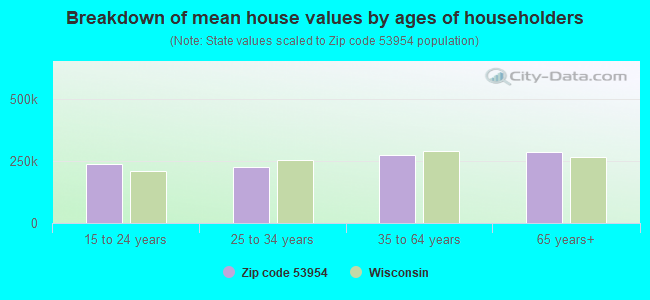
Estimated median house/condo value in 2022: $256,187
53954:
$256,187
Wisconsin:
$252,800
According to our research of Wisconsin and other state lists, there were 9 registered sex offenders living in 53954 zip code as of April 26, 2024. The ratio of all residents to sex offenders in zip code 53954 is 761 to 1. The ratio of registered sex offenders to all residents in this zip code is lower than the state average.
Median resident age:
This zip code:
43.9 years
Wisconsin median age:
40.4 years
Average household size:
This zip code:
2.5 people
Wisconsin:
2.3 people
Averages for the 2020 tax year for zip code 53954, filed in 2021:
Average Adjusted Gross Income (AGI) in 2020: $64,346 (Individual Income Tax Returns)
Here:
$64,346
State:
$72,319
Salary/wage: $57,171 (reported on 79.6% of returns)
Here:
$57,171
State:
$59,242
(% of AGI for various income ranges: 1172.5% for AGIs below $25k, 3784.7% for AGIs $25k-50k, 6515.2% for AGIs $50k-75k, 9269.4% for AGIs $75k-100k, 17118.6% for AGIs $100k-200k, 45532.5% for AGIs over 200k)
Taxable interest for individuals: $746 (reported on 43.0% of returns)
This zip code:
$746
Wisconsin:
$1,431
(% of AGI for various income ranges: 22.1% for AGIs below $25k, 27.5% for AGIs $25k-50k, 32.5% for AGIs $50k-75k, 70.3% for AGIs $75k-100k, 113.7% for AGIs $100k-200k, 250.0% for AGIs over 200k)
Ordinary dividends: $4,072 (reported on 20.9% of returns)
Here:
$4,072
State:
$6,481
(% of AGI for various income ranges: 35.2% for AGIs below $25k, 54.2% for AGIs $25k-50k, 85.2% for AGIs $50k-75k, 146.9% for AGIs $75k-100k, 297.1% for AGIs $100k-200k, 1705.0% for AGIs over 200k)
Net capital gain/loss in AGI: +$7,335 (reported on 18.7% of returns)
Here:
+$7,335
State:
+$18,329
(% of AGI for various income ranges: 28.7% for AGIs below $25k, 51.7% for AGIs $25k-50k, 82.0% for AGIs $50k-75k, 260.6% for AGIs $75k-100k, 553.4% for AGIs $100k-200k, 3457.5% for AGIs over 200k)
Profit/loss from business: +$12,140 (reported on 12.9% of returns)
Here:
+$12,140
State:
+$14,562
(% of AGI for various income ranges: 115.9% for AGIs below $25k, 233.0% for AGIs $25k-50k, 279.5% for AGIs $50k-75k, 157.5% for AGIs $75k-100k, 433.4% for AGIs $100k-200k, 922.5% for AGIs over 200k)
Taxable individual retirement arrangement distribution: $15,194 (reported on 12.9% of returns)
53954:
$15,194
Wisconsin:
$19,348
(% of AGI for various income ranges: 126.1% for AGIs below $25k, 184.2% for AGIs $25k-50k, 253.0% for AGIs $50k-75k, 529.4% for AGIs $75k-100k, 710.6% for AGIs $100k-200k)
Total itemized deductions: $25,791 (reported on 6.1% of returns)
Here:
$25,791
State:
$33,000
(% of AGI for various income ranges: 180.0% for AGIs $25k-50k, 327.8% for AGIs $50k-75k, 261.9% for AGIs $75k-100k, 489.7% for AGIs $100k-200k, 1647.5% for AGIs over 200k)
Charity contributions: $6,523 (reported on 3.6% of returns)
Here:
$6,523
State:
$12,044
(% of AGI for various income ranges: 13.3% for AGIs below $25k, 26.5% for AGIs $50k-75k, 27.8% for AGIs $75k-100k, 163.4% for AGIs $100k-200k)
Taxes paid: $7,324 (reported on 5.8% of returns)
53954:
$7,324
State:
$8,228
(% of AGI for various income ranges: 30.3% for AGIs $25k-50k, 86.8% for AGIs $50k-75k, 79.7% for AGIs $75k-100k, 151.7% for AGIs $100k-200k, 527.5% for AGIs over 200k)
Earned income credit: $1,850 (reported on 9.4% of returns)
Here:
$1,850
State:
$2,155
(% of AGI for various income ranges: 64.6% for AGIs below $25k, 36.7% for AGIs $25k-50k)
Percentage of individuals using paid preparers for their 2020 taxes: 93.1%
Here:
93%
State:
94%
(% for various income ranges: 91.6% for AGIs below $25k, 91.1% for AGIs $25k-50k, 95.0% for AGIs $50k-75k, 95.8% for AGIs $75k-100k, 95.0% for AGIs $100k-200k, 90.0% for AGIs over 200k)
Averages for the 2012 tax year for zip code 53954, filed in 2013:
Average Adjusted Gross Income (AGI) in 2012: $51,777 (Individual Income Tax Returns)
Here:
$51,777
State:
$57,939
Salary/wage: $45,665 (reported on 83.0% of returns)
Here:
$45,665
State:
$48,248
(% of AGI for various income ranges: 67.3% for AGIs below $25k, 77.2% for AGIs $25k-50k, 75.2% for AGIs $50k-75k, 77.5% for AGIs $75k-100k, 77.7% for AGIs $100k-200k, 42.3% for AGIs over 200k)
Taxable interest for individuals: $857 (reported on 39.6% of returns)
This zip code:
$857
Wisconsin:
$1,224
(% of AGI for various income ranges: 2.1% for AGIs below $25k, 0.7% for AGIs $25k-50k, 0.6% for AGIs $50k-75k, 0.5% for AGIs $75k-100k, 0.4% for AGIs $100k-200k, 0.4% for AGIs over 200k)
Ordinary dividends: $2,566 (reported on 22.0% of returns)
Here:
$2,566
State:
$5,137
(% of AGI for various income ranges: 1.7% for AGIs below $25k, 0.8% for AGIs $25k-50k, 0.6% for AGIs $50k-75k, 0.8% for AGIs $75k-100k, 1.7% for AGIs $100k-200k, 1.1% for AGIs over 200k)
Net capital gain/loss in AGI: +$4,465 (reported on 16.4% of returns)
Here:
+$4,465
State:
+$11,137
(% of AGI for various income ranges: 0.8% for AGIs below $25k, 0.2% for AGIs $25k-50k, 0.5% for AGIs $50k-75k, 0.2% for AGIs $75k-100k, 2.6% for AGIs $100k-200k, 5.9% for AGIs over 200k)
Profit/loss from business: +$6,314 (reported on 13.1% of returns)
Here:
+$6,314
State:
+$11,943
(% of AGI for various income ranges: 4.7% for AGIs below $25k, 2.7% for AGIs $25k-50k, 0.9% for AGIs $50k-75k, 0.9% for AGIs $75k-100k, 1.6% for AGIs $100k-200k)
Taxable individual retirement arrangement distribution: $11,509 (reported on 13.1% of returns)
53954:
$11,509
Wisconsin:
$14,087
(% of AGI for various income ranges: 6.1% for AGIs below $25k, 3.0% for AGIs $25k-50k, 2.4% for AGIs $50k-75k, 2.9% for AGIs $75k-100k, 3.3% for AGIs $100k-200k)
Total itemized deductions: $18,780 (22% of AGI, reported on 39.3% of returns)
Here:
$18,780
State:
$22,257
Here:
22.2% of AGI
State:
20.1% of AGI
(% of AGI for various income ranges: 12.6% for AGIs below $25k, 11.7% for AGIs $25k-50k, 14.0% for AGIs $50k-75k, 15.4% for AGIs $75k-100k, 16.1% for AGIs $100k-200k, 13.4% for AGIs over 200k)
Charity contributions: $2,404 (reported on 29.2% of returns)
Here:
$2,404
State:
$3,370
(% of AGI for various income ranges: 0.7% for AGIs below $25k, 0.9% for AGIs $25k-50k, 1.4% for AGIs $50k-75k, 1.6% for AGIs $75k-100k, 1.8% for AGIs $100k-200k, 1.0% for AGIs over 200k)
Taxes paid: $7,806 (reported on 39.3% of returns)
53954:
$7,806
State:
$10,731
(% of AGI for various income ranges: 2.8% for AGIs below $25k, 4.0% for AGIs $25k-50k, 5.5% for AGIs $50k-75k, 6.8% for AGIs $75k-100k, 7.7% for AGIs $100k-200k, 6.6% for AGIs over 200k)
Earned income credit: $1,856 (reported on 12.2% of returns)
Here:
$1,856
State:
$2,094
(% of AGI for various income ranges: 4.2% for AGIs below $25k, 0.7% for AGIs $25k-50k)
Percentage of individuals using paid preparers for their 2012 taxes: 60.1%
Here:
60%
State:
54%
(% for various income ranges: 54.8% for AGIs below $25k, 60.2% for AGIs $25k-50k, 63.3% for AGIs $50k-75k, 64.1% for AGIs $75k-100k, 65.7% for AGIs $100k-200k, 75.0% for AGIs over 200k)
Averages for the 2004 tax year for zip code 53954, filed in 2005:
Average Adjusted Gross Income (AGI) in 2004: $42,658 (Individual Income Tax Returns)
Here:
$42,658
State:
$47,735
Salary/wage: $39,244 (reported on 85.8% of returns)
Here:
$39,244
State:
$41,540
(% of AGI for various income ranges: 124.0% for AGIs below $10k, 69.3% for AGIs $10k-25k, 81.3% for AGIs $25k-50k, 84.3% for AGIs $50k-75k, 84.5% for AGIs $75k-100k, 61.2% for AGIs over 100k)
Taxable interest for individuals: $1,102 (reported on 51.5% of returns)
This zip code:
$1,102
Wisconsin:
$1,420
(% of AGI for various income ranges: 8.2% for AGIs below $10k, 2.6% for AGIs $10k-25k, 1.4% for AGIs $25k-50k, 0.8% for AGIs $50k-75k, 0.9% for AGIs $75k-100k, 1.5% for AGIs over 100k)
Taxable dividends: $1,460 (reported on 24.9% of returns)
Here:
$1,460
State:
$2,869
(% of AGI for various income ranges: 3.2% for AGIs below $10k, 1.2% for AGIs $10k-25k, 0.7% for AGIs $25k-50k, 0.7% for AGIs $50k-75k, 0.6% for AGIs $75k-100k, 1.3% for AGIs over 100k)
Net capital gain/loss: +$6,010 (reported on 18.4% of returns)
Here:
+$6,010
State:
+$9,569
(% of AGI for various income ranges: 0.3% for AGIs below $10k, 1.0% for AGIs $10k-25k, 0.9% for AGIs $25k-50k, 1.0% for AGIs $50k-75k, 1.0% for AGIs $75k-100k, 10.0% for AGIs over 100k)
Profit/loss from business: +$6,392 (reported on 15.2% of returns)
Here:
+$6,392
State:
+$10,417
(% of AGI for various income ranges: -2.6% for AGIs below $10k, 4.3% for AGIs $10k-25k, 2.7% for AGIs $25k-50k, 2.1% for AGIs $50k-75k, 1.0% for AGIs $75k-100k, 3.2% for AGIs over 100k)
IRA payment deduction: $2,971 (reported on 3.2% of returns)
53954:
$2,971
Wisconsin:
$2,900
(% of AGI for various income ranges: 0.3% for AGIs $10k-25k, 0.5% for AGIs $25k-50k, 0.2% for AGIs $50k-75k, 0.1% for AGIs $75k-100k)
Self-employed pension: $3,727 (reported on 0.3% of returns)
Here:
$3,727
Wisconsin:
$11,934
Total itemized deductions: $15,953 (24% of AGI, reported on 42.9% of returns)
Here:
$15,953
State:
$18,160
Here:
24.2% of AGI
State:
21.1% of AGI
(% of AGI for various income ranges: 12.0% for AGIs below $10k, 11.8% for AGIs $10k-25k, 14.9% for AGIs $25k-50k, 16.7% for AGIs $50k-75k, 17.5% for AGIs $75k-100k, 16.8% for AGIs over 100k)
Charity contributions deductions: $1,924 (3% of AGI, reported on 35.8% of returns)
Here:
$1,924
State:
$2,711
Here:
2.8% of AGI
State:
3.0% of AGI
(% of AGI for various income ranges: 0.8% for AGIs below $10k, 0.8% for AGIs $10k-25k, 1.6% for AGIs $25k-50k, 1.4% for AGIs $50k-75k, 1.8% for AGIs $75k-100k, 2.3% for AGIs over 100k)
Total tax: $4,721 (reported on 80.1% of returns)
53954:
$4,721
State:
$7,114
(% of AGI for various income ranges: 3.4% for AGIs below $10k, 4.1% for AGIs $10k-25k, 6.8% for AGIs $25k-50k, 7.9% for AGIs $50k-75k, 9.6% for AGIs $75k-100k, 14.5% for AGIs over 100k)
Earned income credit: $1,356 (reported on 8.9% of returns)
Here:
$1,356
State:
$1,544
Percentage of individuals using paid preparers for their 2004 taxes: 60.2%
Here:
60%
State:
57%
(% for various income ranges: 48.3% for AGIs below $10k, 58.3% for AGIs $10k-25k, 62.7% for AGIs $25k-50k, 66.3% for AGIs $50k-75k, 59.6% for AGIs $75k-100k, 74.9% for AGIs over 100k)
Household received Food Stamps/SNAP in the past 12 months: 270 Household did not receive Food Stamps/SNAP in the past 12 months: 2,448
Women who had a birth in the past 12 months: 56 (41 now married, 14 unmarried) Women who did not have a birth in the past 12 months: 1,365 (603 now married, 762 unmarried)
Housing units in zip code 53954 with a mortgage: 1,546 (267 second mortgage, 247 both second mortgage and home equity loan) Houses without a mortgage: 30
Median monthly owner costs for units with a mortgage: $1,406 Median monthly owner costs for units without a mortgage: $486
Residents with income below the poverty level in 2022:
This zip code:
4.7%
Whole state:
10.7%
Residents with income below 50% of the poverty level in 2022:
This zip code:
2.2%
Whole state:
5.7%
Median number of rooms in houses and condos:
Here:
6.7
State:
6.5
Median number of rooms in apartments:
Here:
4.4
State:
4.1
Notable locations in this zip code not listed on our city pages
Notable locations in zip code 53954: Williams Camp (A), Pardeeville Wastewater Treatment Facility (B), Wyocena Wastewater Treatment Facility (C), Valley View Farm (D), Angie Williams Cox Public Library (E), Pardeeville District Ambulance Service (F), Pardeeville Fire Department (G). Display/hide their locations on the map
Churches in zip code 53954 include: First Presbyterian Church (A), North Scott Church (B), Saint Johns Evangelical Lutheran Church (C), Saint Johns Lutheran Church (D), Saint Marys Roman Catholic Church (E), Wesleyan Bible Church (F), Saint Andrews Church (G). Display/hide their locations on the map
Lakes and reservoirs: Park Lake (A), Spring Lake (B), Becker Lake (C), Swan Lake (D), Breneman Lake (E), Crystal Lake (F), Cuff Lake (G), West Lake (H). Display/hide their locations on the map
Parks in zip code 53954 include: Rocky Run Oak Savanna State Natural Area (1), Swan Lake State Wildlife Area (2), Wyona County Park (3). Display/hide their locations on the map
893 married couples with children.
490 single-parent households (255 men, 235 women).
95.1% of residents of 53954 zip code speak English at home.
0.9% of residents speak Spanish at home (76% very well, 3% well, 20% not well).
3.6% of residents speak other Indo-European language at home (73% very well, 17% well, 11% not well).
0.1% of residents speak Asian or Pacific Island language at home (50% very well, 50% well).
0.1% of residents speak other language at home (100% very well).
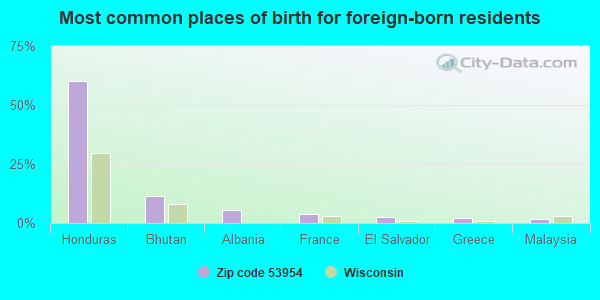
Foreign born population: 183 (2.7%) (36.5% of them are naturalized citizens)
This zip code:
2.7%
Whole state:
5.0%
60%Honduras
11%Bhutan
5%Albania
4%France
3%El Salvador
2%Greece
2%Malaysia
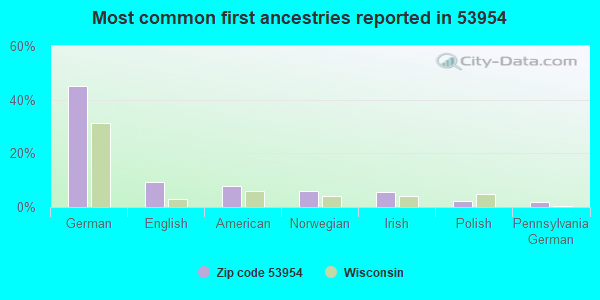
45%German
10%English
8%American
6%Norwegian
5%Irish
2%Polish
2%Pennsylvania German
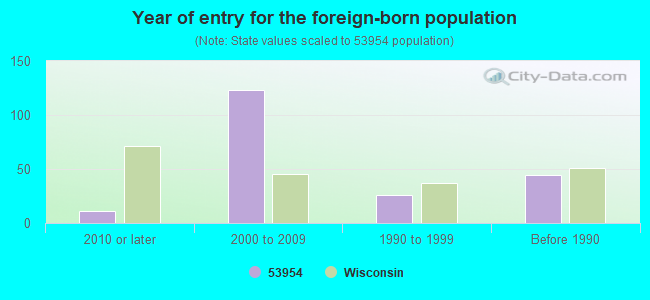
Year of entry for the foreign-born population
112010 or later
1232000 to 2009
261990 to 1999
44Before 1990
Facilities with environmental interests located in this zip code:
BALLIET EARLY CHILDHOOD (110 S ELM ST in PARDEEVILLE, WI)
(National Center for Education Statistics) - STATE ID-0020 Organizations: PARDEEVILLE AREA SCH DIST (SCHOOL DISTRICT)
CONVERTER CONCEPTS (511 S MAIN ST in PARDEEVILLE, WI)
HAZARDOUS WASTE BIENNIAL REPORTER (Resource Conservation and Recovery Act (tracking hazardous waste)) (Resource Conservation and Recovery Act (tracking hazardous waste))
CONVERTER CONCEPTS INC (100 INDUSTRIAL PKWY in PARDEEVILLE, WI)
(Resource Conservation and Recovery Act (tracking hazardous waste))
CORNER VIDEO (101 MAIN ST in PARDEEVILLE, WI)
(Resource Conservation and Recovery Act (tracking hazardous waste)) Organizations: DENNIS STILSON (CONTACT/OWNER)
COLUMBIA CTY SOLID WASTE DEPT (W7465 HWY 16 in PARDEEVILLE, WI)
(Resource Conservation and Recovery Act (tracking hazardous waste))
Housing units lacking complete plumbing facilities: 3.9% Housing units lacking complete kitchen facilities: 6.2%
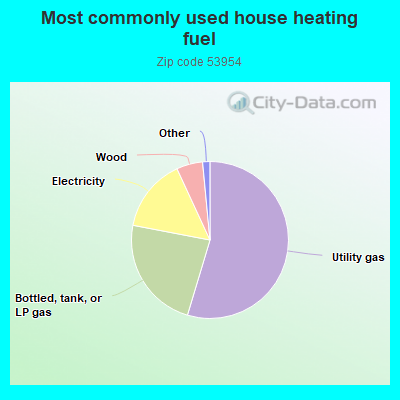
54.7%Utility gas
23.4%Bottled, tank, or LP gas
15.1%Electricity
5.4%Wood
0.9%Fuel oil, kerosene, etc.
0.5%Other fuel
Population in 1990: 6,321. Population change in the 1990s: +159 (+2.5%).
Place of birth for U.S.-born residents:
This state: 5,291
Northeast: 134
Midwest: 864
South: 140
West: 129
59% of the 53954 zip code residents lived in the same house 5 years ago. Out of people who lived in different houses, 51% lived in this county. Out of people who lived in different counties, 50% lived in Wisconsin.
96% of the 53954 zip code residents lived in the same house 1 year ago. Out of people who lived in different houses, 38% moved from this county. Out of people who lived in different houses, 50% moved from different county within same state. Out of people who lived in different houses, 13% moved from different state. Out of people who lived in different houses, 5% moved from abroad.
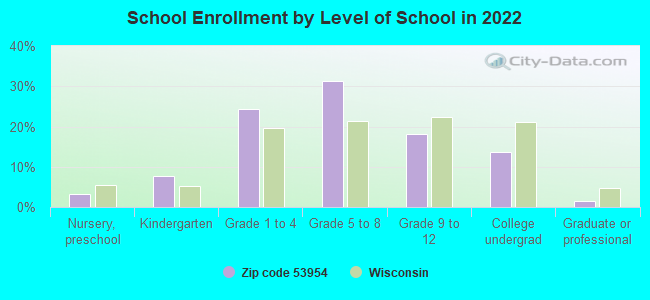
Private vs. public school enrollment:
Students in private schools in grades 1 to 8 (elementary and middle school): 91
Here:
11.0%
Wisconsin:
16.7%
Students in private schools in grades 9 to 12 (high school): 6
Here:
2.2%
Wisconsin:
12.5%
Students in private undergraduate colleges: 44
Here:
21.9%
Wisconsin:
17.5%
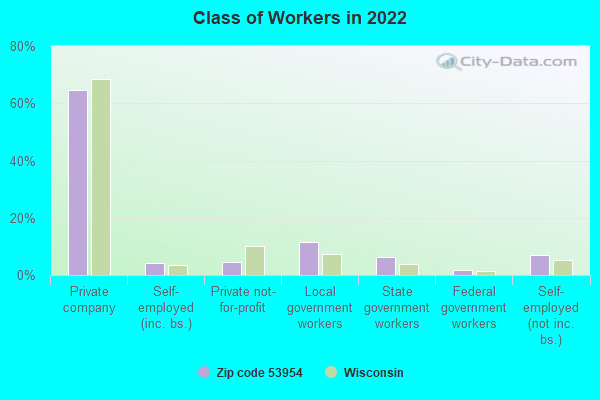
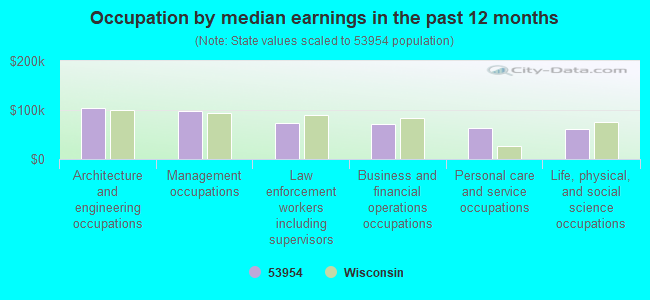
Occupation by median earnings in the past 12 months ($)
103,849Architecture and engineering occupations
97,957Management occupations
73,520Law enforcement workers including supervisors
71,213Business and financial operations occupations
63,333Personal care and service occupations
60,951Life, physical, and social science occupations
Top industries in this zip code by the number of employees in 2005:
Utilities: Electric Power Distribution (100-249 employees: 1 establishment, 20-49 employees: 1 establishment, 10-19 employees: 1 establishment)
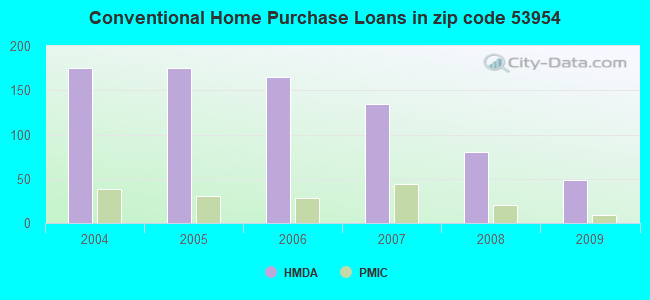
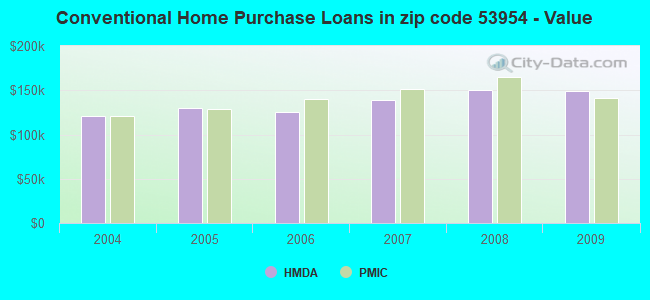
Detailed PMIC statistics for the following Tracts:9702.00
, 9706.00
2002 - 2018 National Fire Incident Reporting System (NFIRS) incidents
Based on the data from the years 2002 - 2018 the average number of fires per year is 7. The highest number of fire incidents - 25 took place in 2014, and the least - 0 in 2007. The data has a growing trend.
When looking into fire subcategories, the most reports belonged to: Structure Fires (48.7%), and Outside Fires (37.8%).
Fire incident types reported to NFIRS in Zip Code 53954
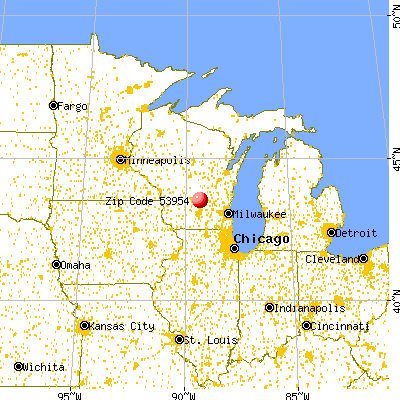


 Nearest zip codes: 53969, 53926, 53960, 53901, 53923, 53955.


 Based on the data from the years 2002 - 2018 the average number of fires per year is 7. The highest number of fire incidents - 25 took place in 2014, and the least - 0 in 2007. The data has a growing trend.
 When looking into fire subcategories, the most reports belonged to: Structure Fires (48.7%), and Outside Fires (37.8%).