Estimated zip code population in 2022: 3,406 Zip code population in 2010: 3,477 Zip code population in 2000: 3,537
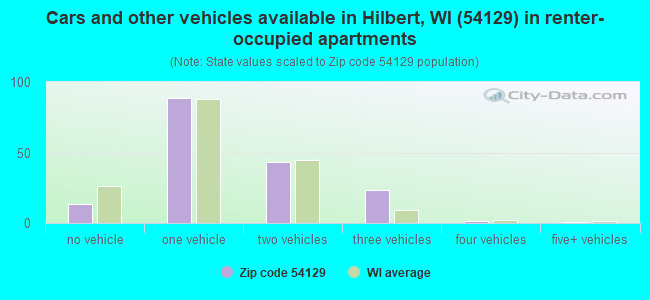
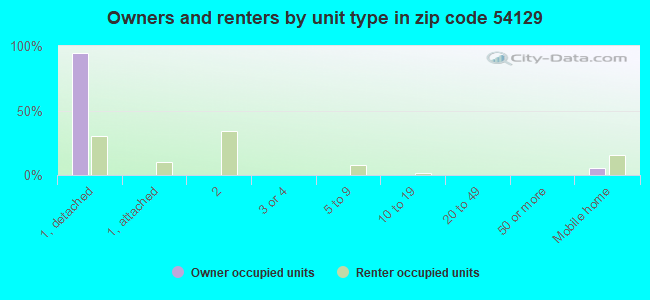
Houses and condos: 1,610 Renter-occupied apartments: 172
% of renters here:
11%
State:
32%
March 2022 cost of living index in zip code 54129: 87.5 (less than average, U.S. average is 100)
Land area: 72.4 sq. mi. Water area: 0.3 sq. mi.
Population density: 47 people per square mile
(very low).
OSM Map
General Map
Google Map
MSN Map
OSM Map
General Map
Google Map
MSN Map
OSM Map
General Map
Google Map
MSN Map
OSM Map
General Map
Google Map
MSN Map
Please wait while loading the map...
Real estate property taxes paid for housing units in 2022:
This zip code:
1.5% ($3,833)
Wisconsin:
1.4% ($3,497)
Median real estate property taxes paid for housing units with mortgages in 2022: $4,133 (1.6%) Median real estate property taxes paid for housing units with no mortgage in 2022: $3,616 (1.5%)
Business Search- 14 Million verified businesses
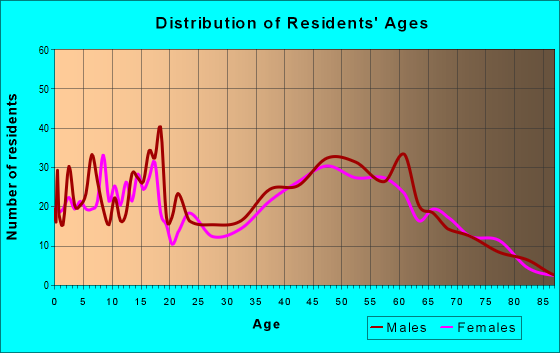
Males: 1,720
(50.5%)
Females: 1,685
(49.5%)
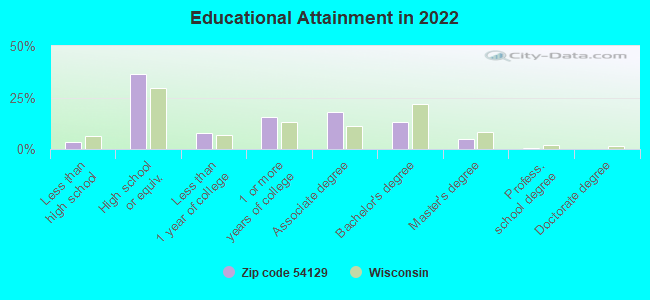
For population 25 years and over in 54129:
High school or higher: 95.9%
Bachelor's degree or higher: 18.6%
Graduate or professional degree: 5.7%
Unemployed: 1.4%
Mean travel time to work (commute): 27.8 minutes
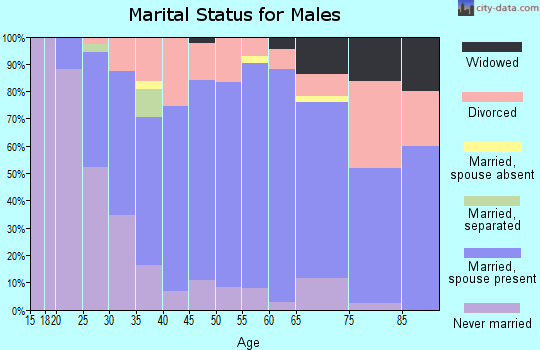
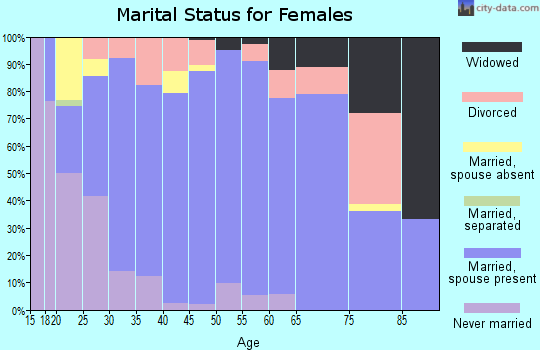
For population 15 years and over in 54129:
Never married: 17.2%
Now married: 64.5%
Separated: 0.5%
Widowed: 9.1%
Divorced: 8.7%
Zip code 54129 compared to state average:
Unemployed percentage below state average.
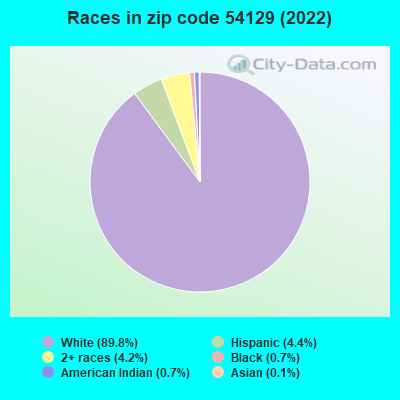
Black race population percentage significantly below state average.
Median age significantly above state average.
Foreign-born population percentage below state average.
Renting percentage significantly below state average.
Length of stay since moving in significantly above state average.
Number of college students below state average.
Percentage of population with a bachelor's degree or higher below state average.
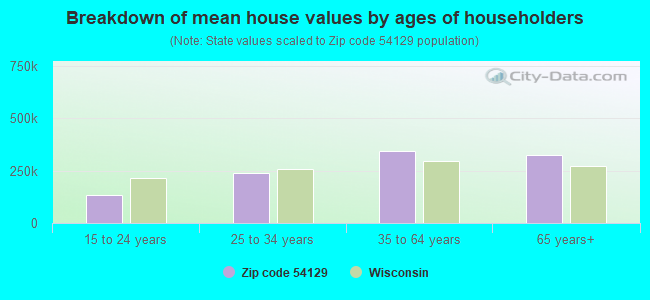
Estimated median house/condo value in 2022: $248,867
54129:
$248,867
Wisconsin:
$252,800
According to our research of Wisconsin and other state lists, there were 6 registered sex offenders living in 54129 zip code as of April 27, 2024. The ratio of all residents to sex offenders in zip code 54129 is 537 to 1. The ratio of registered sex offenders to all residents in this zip code is lower than the state average.
Median resident age:
This zip code:
52.3 years
Wisconsin median age:
40.4 years
Average household size:
This zip code:
2.3 people
Wisconsin:
2.3 people
Averages for the 2020 tax year for zip code 54129, filed in 2021:
Average Adjusted Gross Income (AGI) in 2020: $74,018 (Individual Income Tax Returns)
Here:
$74,018
State:
$72,319
Salary/wage: $61,872 (reported on 81.7% of returns)
Here:
$61,872
State:
$59,242
(% of AGI for various income ranges: 1673.5% for AGIs below $25k, 4285.0% for AGIs $25k-50k, 6849.5% for AGIs $50k-75k, 10537.7% for AGIs $75k-100k, 17539.4% for AGIs $100k-200k)
Taxable interest for individuals: $1,624 (reported on 52.1% of returns)
This zip code:
$1,624
Wisconsin:
$1,431
(% of AGI for various income ranges: 73.0% for AGIs below $25k, 26.2% for AGIs $25k-50k, 69.5% for AGIs $50k-75k, 200.8% for AGIs $75k-100k, 153.3% for AGIs $100k-200k)
Ordinary dividends: $3,628 (reported on 27.8% of returns)
Here:
$3,628
State:
$6,481
(% of AGI for various income ranges: 61.5% for AGIs below $25k, 62.1% for AGIs $25k-50k, 136.5% for AGIs $50k-75k, 235.4% for AGIs $75k-100k, 356.1% for AGIs $100k-200k)
Net capital gain/loss in AGI: +$11,524 (reported on 26.6% of returns)
Here:
+$11,524
State:
+$18,329
(% of AGI for various income ranges: 68.0% for AGIs below $25k, 120.8% for AGIs $25k-50k, 137.5% for AGIs $50k-75k, 316.2% for AGIs $75k-100k, 939.4% for AGIs $100k-200k)
Profit/loss from business: +$13,071 (reported on 10.1% of returns)
Here:
+$13,071
State:
+$14,562
(% of AGI for various income ranges: 116.0% for AGIs below $25k, 142.5% for AGIs $25k-50k, 201.5% for AGIs $50k-75k, 189.2% for AGIs $75k-100k, 555.0% for AGIs $100k-200k)
Taxable individual retirement arrangement distribution: $18,338 (reported on 15.4% of returns)
54129:
$18,338
Wisconsin:
$19,348
(% of AGI for various income ranges: 229.5% for AGIs below $25k, 284.6% for AGIs $25k-50k, 401.0% for AGIs $50k-75k, 691.5% for AGIs $75k-100k, 1069.4% for AGIs $100k-200k)
Total itemized deductions: $29,683 (reported on 3.6% of returns)
Here:
$29,683
State:
$33,000
(% of AGI for various income ranges: 473.0% for AGIs $50k-75k, 463.9% for AGIs $100k-200k)
Charity contributions: $9,825 (reported on 2.4% of returns)
Here:
$9,825
State:
$12,044
(% of AGI for various income ranges: 302.3% for AGIs $75k-100k)
Taxes paid: $7,500 (reported on 3.6% of returns)
54129:
$7,500
State:
$8,228
(% of AGI for various income ranges: 113.5% for AGIs $50k-75k, 123.9% for AGIs $100k-200k)
Earned income credit: $1,791 (reported on 6.5% of returns)
Here:
$1,791
State:
$2,155
(% of AGI for various income ranges: 49.0% for AGIs below $25k, 41.2% for AGIs $25k-50k)
Percentage of individuals using paid preparers for their 2020 taxes: 94.7%
Here:
95%
State:
94%
(% for various income ranges: 90.2% for AGIs below $25k, 94.6% for AGIs $25k-50k, 96.7% for AGIs $50k-75k, 95.5% for AGIs $75k-100k, 96.9% for AGIs $100k-200k, 100.0% for AGIs over 200k)
Averages for the 2012 tax year for zip code 54129, filed in 2013:
Average Adjusted Gross Income (AGI) in 2012: $56,804 (Individual Income Tax Returns)
Here:
$56,804
State:
$57,939
Salary/wage: $48,056 (reported on 85.1% of returns)
Here:
$48,056
State:
$48,248
(% of AGI for various income ranges: 68.4% for AGIs below $25k, 80.9% for AGIs $25k-50k, 76.7% for AGIs $50k-75k, 81.0% for AGIs $75k-100k, 75.6% for AGIs $100k-200k, 38.9% for AGIs over 200k)
Taxable interest for individuals: $978 (reported on 53.6% of returns)
This zip code:
$978
Wisconsin:
$1,224
(% of AGI for various income ranges: 2.6% for AGIs below $25k, 1.0% for AGIs $25k-50k, 0.8% for AGIs $50k-75k, 0.9% for AGIs $75k-100k, 0.7% for AGIs $100k-200k, 0.5% for AGIs over 200k)
Ordinary dividends: $3,157 (reported on 27.4% of returns)
Here:
$3,157
State:
$5,137
(% of AGI for various income ranges: 2.2% for AGIs below $25k, 1.0% for AGIs $25k-50k, 1.1% for AGIs $50k-75k, 0.5% for AGIs $75k-100k, 1.9% for AGIs $100k-200k, 2.9% for AGIs over 200k)
Net capital gain/loss in AGI: +$11,986 (reported on 22.0% of returns)
Here:
+$11,986
State:
+$11,137
(% of AGI for various income ranges: 0.3% for AGIs below $25k, 1.8% for AGIs $25k-50k, 1.9% for AGIs $50k-75k, 1.2% for AGIs $75k-100k, 3.6% for AGIs $100k-200k, 20.2% for AGIs over 200k)
Profit/loss from business: +$6,865 (reported on 11.9% of returns)
Here:
+$6,865
State:
+$11,943
(% of AGI for various income ranges: 3.1% for AGIs below $25k, 1.7% for AGIs $25k-50k, 2.4% for AGIs $50k-75k, 1.4% for AGIs $75k-100k, 1.1% for AGIs $100k-200k)
Taxable individual retirement arrangement distribution: $11,292 (reported on 14.3% of returns)
54129:
$11,292
Wisconsin:
$14,087
(% of AGI for various income ranges: 7.8% for AGIs below $25k, 2.9% for AGIs $25k-50k, 2.8% for AGIs $50k-75k, 2.3% for AGIs $75k-100k, 3.4% for AGIs $100k-200k)
Total itemized deductions: $18,071 (18% of AGI, reported on 35.1% of returns)
Here:
$18,071
State:
$22,257
Here:
18.3% of AGI
State:
20.1% of AGI
(% of AGI for various income ranges: 8.6% for AGIs below $25k, 8.8% for AGIs $25k-50k, 11.1% for AGIs $50k-75k, 13.0% for AGIs $75k-100k, 13.3% for AGIs $100k-200k, 8.4% for AGIs over 200k)
Charity contributions: $2,346 (reported on 28.6% of returns)
Here:
$2,346
State:
$3,370
(% of AGI for various income ranges: 0.9% for AGIs below $25k, 0.8% for AGIs $25k-50k, 0.8% for AGIs $50k-75k, 1.3% for AGIs $75k-100k, 1.3% for AGIs $100k-200k, 1.8% for AGIs over 200k)
Taxes paid: $8,734 (reported on 35.1% of returns)
54129:
$8,734
State:
$10,731
(% of AGI for various income ranges: 2.6% for AGIs below $25k, 3.5% for AGIs $25k-50k, 4.5% for AGIs $50k-75k, 6.1% for AGIs $75k-100k, 7.6% for AGIs $100k-200k, 4.6% for AGIs over 200k)
Earned income credit: $1,721 (reported on 8.3% of returns)
Here:
$1,721
State:
$2,094
(% of AGI for various income ranges: 2.6% for AGIs below $25k, 0.5% for AGIs $25k-50k)
Percentage of individuals using paid preparers for their 2012 taxes: 66.7%
Here:
67%
State:
54%
(% for various income ranges: 61.4% for AGIs below $25k, 62.2% for AGIs $25k-50k, 72.4% for AGIs $50k-75k, 71.4% for AGIs $75k-100k, 76.2% for AGIs $100k-200k, 66.7% for AGIs over 200k)
Averages for the 2004 tax year for zip code 54129, filed in 2005:
Average Adjusted Gross Income (AGI) in 2004: $44,340 (Individual Income Tax Returns)
Here:
$44,340
State:
$47,735
Salary/wage: $39,575 (reported on 88.2% of returns)
Here:
$39,575
State:
$41,540
(% of AGI for various income ranges: 111.6% for AGIs below $10k, 73.7% for AGIs $10k-25k, 80.1% for AGIs $25k-50k, 84.8% for AGIs $50k-75k, 87.1% for AGIs $75k-100k, 61.2% for AGIs over 100k)
Taxable interest for individuals: $948 (reported on 66.0% of returns)
This zip code:
$948
Wisconsin:
$1,420
(% of AGI for various income ranges: 6.0% for AGIs below $10k, 3.6% for AGIs $10k-25k, 1.6% for AGIs $25k-50k, 0.8% for AGIs $50k-75k, 0.9% for AGIs $75k-100k, 1.4% for AGIs over 100k)
Taxable dividends: $1,852 (reported on 30.9% of returns)
Here:
$1,852
State:
$2,869
(% of AGI for various income ranges: 1.7% for AGIs below $10k, 1.3% for AGIs $10k-25k, 1.2% for AGIs $25k-50k, 0.9% for AGIs $50k-75k, 0.9% for AGIs $75k-100k, 2.2% for AGIs over 100k)
Net capital gain/loss: +$4,065 (reported on 26.9% of returns)
Here:
+$4,065
State:
+$9,569
(% of AGI for various income ranges: -2.2% for AGIs below $10k, 3.7% for AGIs $10k-25k, 2.1% for AGIs $25k-50k, 1.1% for AGIs $50k-75k, 3.0% for AGIs $75k-100k, 4.0% for AGIs over 100k)
Profit/loss from business: +$9,358 (reported on 12.1% of returns)
Here:
+$9,358
State:
+$10,417
(% of AGI for various income ranges: 3.5% for AGIs below $10k, 2.0% for AGIs $10k-25k, 2.1% for AGIs $25k-50k, 2.8% for AGIs $50k-75k, 2.0% for AGIs $75k-100k, 3.2% for AGIs over 100k)
IRA payment deduction: $3,547 (reported on 3.2% of returns)
54129:
$3,547
Wisconsin:
$2,900
Self-employed pension: $12,562 (reported on 1.0% of returns)
Here:
$12,562
Wisconsin:
$11,934
Total itemized deductions: $15,738 (21% of AGI, reported on 38.2% of returns)
Here:
$15,738
State:
$18,160
Here:
21.3% of AGI
State:
21.1% of AGI
(% of AGI for various income ranges: 13.8% for AGIs below $10k, 10.0% for AGIs $10k-25k, 11.1% for AGIs $25k-50k, 13.7% for AGIs $50k-75k, 15.6% for AGIs $75k-100k, 14.8% for AGIs over 100k)
Charity contributions deductions: $1,677 (2% of AGI, reported on 33.5% of returns)
Here:
$1,677
State:
$2,711
Here:
2.2% of AGI
State:
3.0% of AGI
(% of AGI for various income ranges: 1.2% for AGIs below $10k, 1.0% for AGIs $10k-25k, 0.9% for AGIs $25k-50k, 1.3% for AGIs $50k-75k, 1.5% for AGIs $75k-100k, 1.4% for AGIs over 100k)
Total tax: $5,642 (reported on 78.4% of returns)
54129:
$5,642
State:
$7,114
(% of AGI for various income ranges: 2.4% for AGIs below $10k, 4.7% for AGIs $10k-25k, 6.8% for AGIs $25k-50k, 8.0% for AGIs $50k-75k, 9.6% for AGIs $75k-100k, 17.7% for AGIs over 100k)
Earned income credit: $1,318 (reported on 6.6% of returns)
Here:
$1,318
State:
$1,544
Percentage of individuals using paid preparers for their 2004 taxes: 66.3%
Here:
66%
State:
57%
(% for various income ranges: 52.8% for AGIs below $10k, 64.6% for AGIs $10k-25k, 72.8% for AGIs $25k-50k, 70.2% for AGIs $50k-75k, 69.1% for AGIs $75k-100k, 74.3% for AGIs over 100k)
Household received Food Stamps/SNAP in the past 12 months: 85 Household did not receive Food Stamps/SNAP in the past 12 months: 1,418
Women who had a birth in the past 12 months: 11 (11 now married, 0 unmarried) Women who did not have a birth in the past 12 months: 563 (314 now married, 248 unmarried)
Housing units in zip code 54129 with a mortgage: 810 (51 second mortgage, 3 home equity loan, 37 both second mortgage and home equity loan) Houses without a mortgage: 66
Median monthly owner costs for units with a mortgage: $1,533 Median monthly owner costs for units without a mortgage: $662
Residents with income below the poverty level in 2022:
This zip code:
7.2%
Whole state:
10.7%
Residents with income below 50% of the poverty level in 2022:
This zip code:
3.9%
Whole state:
5.7%
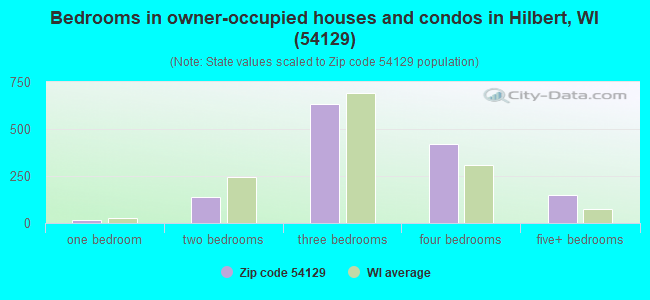
Median number of rooms in houses and condos:
Here:
7.0
State:
6.5
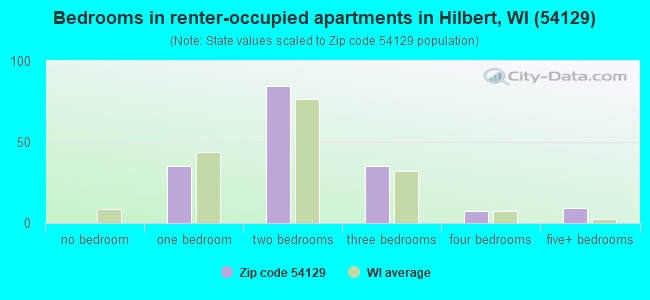
Median number of rooms in apartments:
Here:
3.8
State:
4.1
Notable locations in this zip code not listed on our city pages
Notable locations in zip code 54129: Hilbert Wastewater Treatment Plant (A), Gebhart Farm (B), Woelfel Farms (C), Foxden Dairy Farms (D), Hilbert Village Volunteer Fire Department (E). Display/hide their locations on the map
Churches in zip code 54129 include: Saint Marys Catholic Church (A), Saint Peter Lutheran Church (B), Saint Lukes Church (C). Display/hide their locations on the map
Cemeteries: Saint Johns Catholic Cemetery (1), Trinity Lutheran Cemetery (2), Dorn Cemetery (3), Indian Cemetery (4), Saint Marys Cemetery (5), Saint Peters Cemetery (6). Display/hide their locations on the map
Size of family households: 594 2-persons, 182 3-persons, 143 4-persons, 49 5-persons, 26 6-persons, 15 7-or-more-persons
Size of nonfamily households: 274 1-person, 234 2-persons, 2 3-persons
487 married couples with children.
143 single-parent households (40 men, 103 women).
96.6% of residents of 54129 zip code speak English at home.
3.5% of residents speak Spanish at home (25% very well, 24% well, 4% not well, 47% not at all).
0.3% of residents speak other Indo-European language at home (100% very well).
0.2% of residents speak Asian or Pacific Island language at home (67% very well, 33% not well).
0.2% of residents speak other language at home (100% very well).
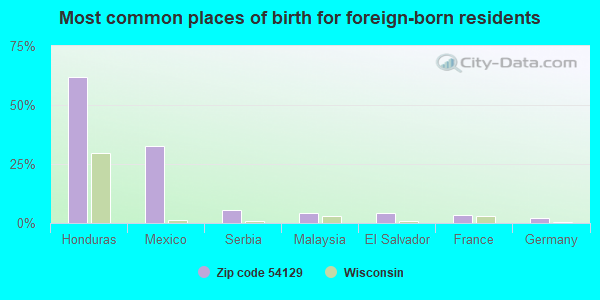
Foreign born population: 92 (2.7%) (20.5% of them are naturalized citizens)
This zip code:
2.7%
Whole state:
5.0%
62%Honduras
33%Mexico
5%Serbia
4%Malaysia
4%El Salvador
3%France
2%Germany
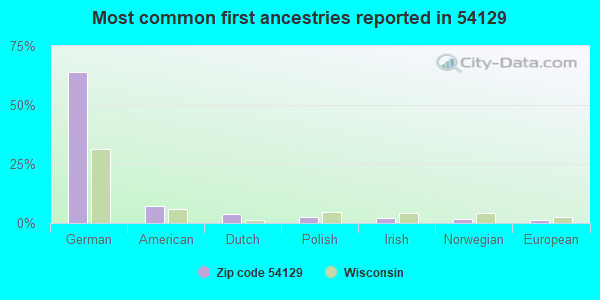
64%German
7%American
4%Dutch
3%Polish
2%Irish
2%Norwegian
1%European
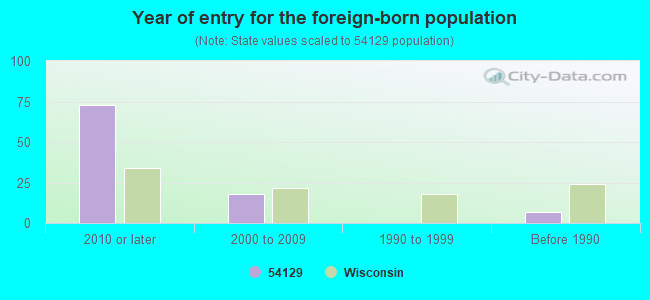
Year of entry for the foreign-born population
732010 or later
182000 to 2009
01990 to 1999
7Before 1990
Facilities with environmental interests located in this zip code:
DIV OF SCHOMBURG ENT (627 W MAIN ST in HILBERT, WI)
COMPLIANCE ACTIVITY (Tracking inspections of insecticide, fungicide, and rodenticide, and toxic substances)
Housing units lacking complete plumbing facilities: 2.2% Housing units lacking complete kitchen facilities: 1.9%
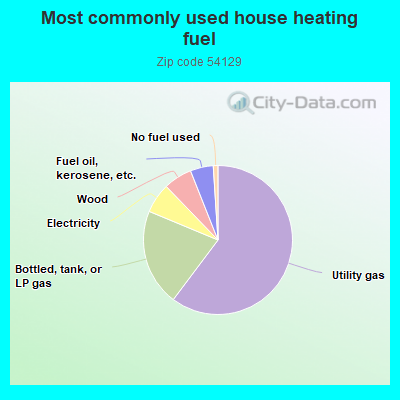
60.2%Utility gas
21.0%Bottled, tank, or LP gas
6.5%Electricity
6.2%Wood
5.0%Fuel oil, kerosene, etc.
1.0%No fuel used
Population in 1990: 3,938.
Place of birth for U.S.-born residents:
This state: 2,943
Northeast: 51
Midwest: 166
South: 57
West: 81
72% of the 54129 zip code residents lived in the same house 5 years ago. Out of people who lived in different houses, 61% lived in this county. Out of people who lived in different counties, 50% lived in Wisconsin.
96% of the 54129 zip code residents lived in the same house 1 year ago. Out of people who lived in different houses, 44% moved from this county. Out of people who lived in different houses, 27% moved from different county within same state. Out of people who lived in different houses, 8% moved from different state. Out of people who lived in different houses, 29% moved from abroad.
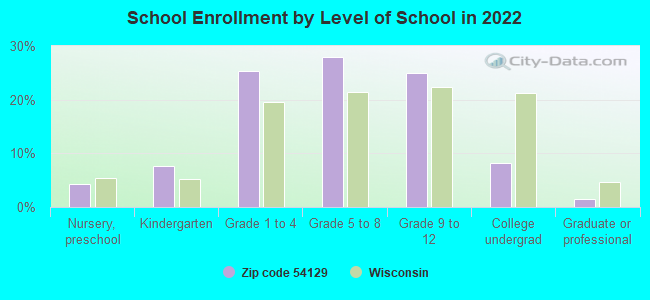
Private vs. public school enrollment:
Students in private schools in grades 1 to 8 (elementary and middle school): 79
Here:
23.3%
Wisconsin:
16.7%
Students in private schools in grades 9 to 12 (high school): 14
Here:
9.1%
Wisconsin:
12.5%
Students in private undergraduate colleges:
Here:
0.0%
Wisconsin:
17.5%
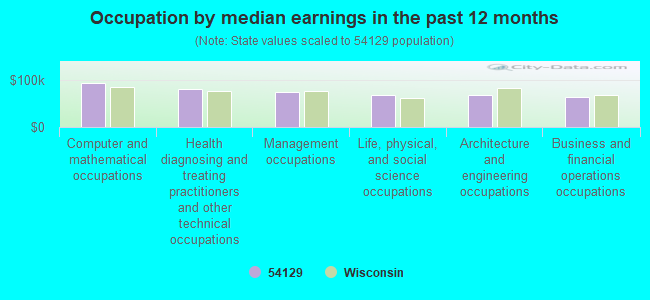
Occupation by median earnings in the past 12 months ($)
92,934Computer and mathematical occupations
81,085Health diagnosing and treating practitioners and other technical occupations
74,088Management occupations
68,398Life, physical, and social science occupations
68,186Architecture and engineering occupations
63,971Business and financial operations occupations
Top industries in this zip code by the number of employees in 2005:
Other Services (except Public Administration): Labor Unions and Similar Labor Organizations (20-49 employees: 1 establishment)
Accommodation and Food Services: Full-Service Restaurants (10-19: 1, 5-9: 1)
Construction: New Single-Family Housing Construction (except Operative Builders) (5-9: 2, 1-4: 2)
Real Estate and Rental and Leasing: Lessors of Nonresidential Buildings (except Miniwarehouses) (10-19: 1)
Health Care and Social Assistance: All Other Outpatient Care Centers (10-19: 1)
People in group quarters in 2000:
3 people in religious group quarters
Fatal accident statistics in 2014:
Fatal accident count: 2
Vehicles involved in fatal accidents: 4
Fatal accidents caused by drunken drivers: 1
Fatalities: 2
Persons involved in fatal accidents: 7
Pedestrians involved in fatal accidents: 0
Fatal accident statistics in 2012:
Fatal accident count: 1
Vehicles involved in fatal accidents: 2
Fatal accidents caused by drunken drivers: 0
Fatalities: 1
Persons involved in fatal accidents: 2
Pedestrians involved in fatal accidents: 0
Home Mortgage Disclosure Act Aggregated Statistics For Year 2009 (Based on 6 partial tracts)
A) FHA, FSA/RHS & VA Home Purchase Loans
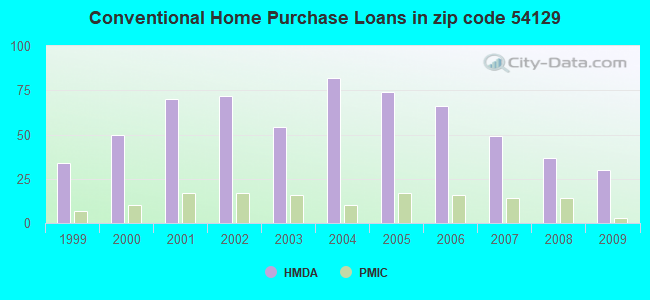
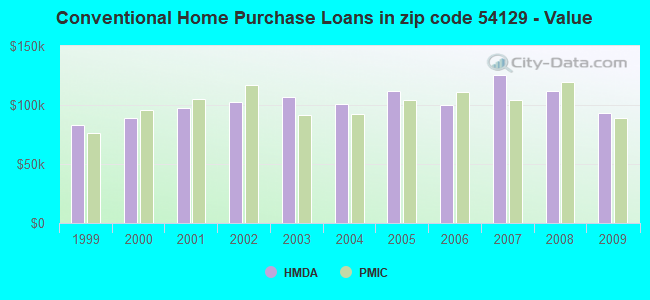
B) Conventional Home Purchase Loans
C) Refinancings
D) Home Improvement Loans
E) Loans on Dwellings For 5+ Families
F) Non-occupant Loans on < 5 Family Dwellings (A B C & D)
G) Loans On Manufactured Home Dwelling (A B C & D)
Number
Average Value
Number
Average Value
Number
Average Value
Number
Average Value
Number
Average Value
Number
Average Value
Number
Average Value
LOANS ORIGINATED
13
$107,175
30
$93,408
236
$133,565
18
$66,751
1
$408,140
14
$110,263
6
$22,365
APPLICATIONS APPROVED, NOT ACCEPTED
0
$0
2
$71,610
15
$137,187
2
$9,410
0
$0
0
$0
1
$8,640
APPLICATIONS DENIED
2
$117,275
3
$190,767
43
$126,849
4
$83,730
0
$0
0
$0
0
$0
APPLICATIONS WITHDRAWN
3
$99,853
0
$0
40
$151,351
1
$73,810
0
$0
2
$218,335
0
$0
FILES CLOSED FOR INCOMPLETENESS
0
$0
0
$0
9
$155,344
0
$0
0
$0
0
$0
0
$0
Aggregated Statistics For Year 2008 (Based on 6 partial tracts)
A) FHA, FSA/RHS & VA Home Purchase Loans
B) Conventional Home Purchase Loans
C) Refinancings
D) Home Improvement Loans
E) Loans on Dwellings For 5+ Families
F) Non-occupant Loans on < 5 Family Dwellings (A B C & D)
G) Loans On Manufactured Home Dwelling (A B C & D)
Number
Average Value
Number
Average Value
Number
Average Value
Number
Average Value
Number
Average Value
Number
Average Value
Number
Average Value
LOANS ORIGINATED
9
$107,897
37
$111,501
146
$119,433
28
$57,827
3
$802,933
15
$129,585
4
$68,542
APPLICATIONS APPROVED, NOT ACCEPTED
0
$0
0
$0
9
$95,664
2
$17,730
0
$0
0
$0
0
$0
APPLICATIONS DENIED
5
$122,392
9
$81,071
33
$140,453
12
$54,325
0
$0
1
$15,740
3
$55,820
APPLICATIONS WITHDRAWN
0
$0
4
$112,128
20
$150,879
1
$55,730
0
$0
0
$0
0
$0
FILES CLOSED FOR INCOMPLETENESS
0
$0
0
$0
4
$116,052
0
$0
0
$0
0
$0
0
$0
Aggregated Statistics For Year 2007 (Based on 6 partial tracts)
A) FHA, FSA/RHS & VA Home Purchase Loans
B) Conventional Home Purchase Loans
C) Refinancings
D) Home Improvement Loans
F) Non-occupant Loans on < 5 Family Dwellings (A B C & D)
G) Loans On Manufactured Home Dwelling (A B C & D)
Number
Average Value
Number
Average Value
Number
Average Value
Number
Average Value
Number
Average Value
Number
Average Value
LOANS ORIGINATED
7
$124,509
49
$125,308
133
$101,636
38
$40,529
15
$108,984
3
$57,077
APPLICATIONS APPROVED, NOT ACCEPTED
0
$0
3
$84,167
17
$128,885
2
$120,795
1
$163,770
0
$0
APPLICATIONS DENIED
0
$0
8
$164,795
59
$118,524
7
$56,563
5
$148,116
2
$45,655
APPLICATIONS WITHDRAWN
0
$0
4
$308,088
20
$113,851
7
$63,327
1
$320,950
1
$99,800
FILES CLOSED FOR INCOMPLETENESS
0
$0
0
$0
9
$124,977
0
$0
0
$0
0
$0
Aggregated Statistics For Year 2006 (Based on 6 partial tracts)
A) FHA, FSA/RHS & VA Home Purchase Loans
B) Conventional Home Purchase Loans
C) Refinancings
D) Home Improvement Loans
E) Loans on Dwellings For 5+ Families
F) Non-occupant Loans on < 5 Family Dwellings (A B C & D)
G) Loans On Manufactured Home Dwelling (A B C & D)
Number
Average Value
Number
Average Value
Number
Average Value
Number
Average Value
Number
Average Value
Number
Average Value
Number
Average Value
LOANS ORIGINATED
7
$103,297
66
$100,012
126
$95,656
40
$36,785
2
$621,525
13
$95,480
5
$26,316
APPLICATIONS APPROVED, NOT ACCEPTED
1
$80,150
7
$97,056
16
$104,015
4
$29,275
0
$0
2
$114,040
2
$23,255
APPLICATIONS DENIED
1
$93,880
15
$73,269
61
$114,916
11
$62,604
0
$0
3
$61,337
6
$46,458
APPLICATIONS WITHDRAWN
0
$0
10
$92,097
32
$103,263
1
$116,960
0
$0
2
$46,750
2
$25,650
FILES CLOSED FOR INCOMPLETENESS
0
$0
4
$63,032
10
$127,499
0
$0
0
$0
0
$0
1
$47,150
Aggregated Statistics For Year 2005 (Based on 6 partial tracts)
A) FHA, FSA/RHS & VA Home Purchase Loans
B) Conventional Home Purchase Loans
C) Refinancings
D) Home Improvement Loans
F) Non-occupant Loans on < 5 Family Dwellings (A B C & D)
G) Loans On Manufactured Home Dwelling (A B C & D)
Number
Average Value
Number
Average Value
Number
Average Value
Number
Average Value
Number
Average Value
Number
Average Value
LOANS ORIGINATED
8
$96,105
74
$111,928
195
$133,804
30
$46,877
18
$207,565
4
$47,152
APPLICATIONS APPROVED, NOT ACCEPTED
0
$0
7
$90,957
14
$72,916
3
$55,973
1
$72,130
2
$51,875
APPLICATIONS DENIED
2
$69,105
14
$89,119
75
$116,417
14
$33,543
3
$116,507
4
$57,572
APPLICATIONS WITHDRAWN
0
$0
12
$100,168
41
$116,481
2
$113,855
1
$83,480
0
$0
FILES CLOSED FOR INCOMPLETENESS
0
$0
3
$77,747
22
$137,800
0
$0
0
$0
1
$120,230
Aggregated Statistics For Year 2004 (Based on 6 partial tracts)
A) FHA, FSA/RHS & VA Home Purchase Loans
B) Conventional Home Purchase Loans
C) Refinancings
D) Home Improvement Loans
F) Non-occupant Loans on < 5 Family Dwellings (A B C & D)
G) Loans On Manufactured Home Dwelling (A B C & D)
Number
Average Value
Number
Average Value
Number
Average Value
Number
Average Value
Number
Average Value
Number
Average Value
LOANS ORIGINATED
11
$94,853
82
$101,225
215
$103,992
21
$54,957
18
$92,499
7
$33,276
APPLICATIONS APPROVED, NOT ACCEPTED
0
$0
7
$133,429
25
$92,334
2
$47,830
3
$134,857
1
$64,680
APPLICATIONS DENIED
0
$0
16
$87,458
71
$89,510
8
$59,088
4
$73,432
5
$71,400
APPLICATIONS WITHDRAWN
0
$0
6
$101,840
38
$113,365
2
$69,065
1
$214,940
1
$70,890
FILES CLOSED FOR INCOMPLETENESS
0
$0
1
$84,370
19
$119,601
2
$39,505
0
$0
1
$91,940
Aggregated Statistics For Year 2003 (Based on 6 partial tracts)
A) FHA, FSA/RHS & VA Home Purchase Loans
B) Conventional Home Purchase Loans
C) Refinancings
D) Home Improvement Loans
F) Non-occupant Loans on < 5 Family Dwellings (A B C & D)
Number
Average Value
Number
Average Value
Number
Average Value
Number
Average Value
Number
Average Value
LOANS ORIGINATED
7
$85,513
54
$106,647
366
$97,495
16
$21,164
12
$80,289
APPLICATIONS APPROVED, NOT ACCEPTED
0
$0
5
$99,846
15
$112,592
0
$0
1
$97,440
APPLICATIONS DENIED
1
$120,590
13
$83,368
68
$90,336
5
$30,284
4
$65,095
APPLICATIONS WITHDRAWN
0
$0
4
$80,212
38
$112,297
1
$18,070
2
$129,505
FILES CLOSED FOR INCOMPLETENESS
0
$0
1
$33,150
4
$95,780
0
$0
1
$64,440
Aggregated Statistics For Year 2002 (Based on 6 partial tracts)
A) FHA, FSA/RHS & VA Home Purchase Loans
B) Conventional Home Purchase Loans
C) Refinancings
D) Home Improvement Loans
E) Loans on Dwellings For 5+ Families
F) Non-occupant Loans on < 5 Family Dwellings (A B C & D)
Number
Average Value
Number
Average Value
Number
Average Value
Number
Average Value
Number
Average Value
Number
Average Value
LOANS ORIGINATED
5
$70,286
72
$102,267
347
$90,716
22
$33,797
1
$1,256,900
14
$99,716
APPLICATIONS APPROVED, NOT ACCEPTED
0
$0
4
$109,300
19
$115,624
2
$10,420
0
$0
2
$148,110
APPLICATIONS DENIED
0
$0
4
$60,755
46
$85,400
6
$19,620
0
$0
0
$0
APPLICATIONS WITHDRAWN
0
$0
7
$123,007
32
$93,834
2
$32,965
0
$0
1
$77,880
FILES CLOSED FOR INCOMPLETENESS
0
$0
1
$92,450
5
$106,554
0
$0
0
$0
0
$0
Aggregated Statistics For Year 2001 (Based on 6 partial tracts)
A) FHA, FSA/RHS & VA Home Purchase Loans
B) Conventional Home Purchase Loans
C) Refinancings
D) Home Improvement Loans
F) Non-occupant Loans on < 5 Family Dwellings (A B C & D)
Number
Average Value
Number
Average Value
Number
Average Value
Number
Average Value
Number
Average Value
LOANS ORIGINATED
3
$74,750
70
$97,391
233
$80,744
24
$19,758
13
$65,279
APPLICATIONS APPROVED, NOT ACCEPTED
0
$0
5
$67,814
15
$107,945
5
$24,698
0
$0
APPLICATIONS DENIED
1
$77,920
7
$77,839
59
$75,491
4
$19,768
2
$54,730
APPLICATIONS WITHDRAWN
0
$0
4
$101,220
28
$104,000
2
$33,275
1
$86,050
FILES CLOSED FOR INCOMPLETENESS
0
$0
1
$90,440
4
$92,820
0
$0
0
$0
Aggregated Statistics For Year 2000 (Based on 6 partial tracts)
A) FHA, FSA/RHS & VA Home Purchase Loans
B) Conventional Home Purchase Loans
C) Refinancings
D) Home Improvement Loans
E) Loans on Dwellings For 5+ Families
F) Non-occupant Loans on < 5 Family Dwellings (A B C & D)
Number
Average Value
Number
Average Value
Number
Average Value
Number
Average Value
Number
Average Value
Number
Average Value
LOANS ORIGINATED
6
$79,445
50
$88,962
77
$56,575
35
$17,243
1
$208,640
4
$67,285
APPLICATIONS APPROVED, NOT ACCEPTED
0
$0
5
$71,060
8
$83,885
2
$20,640
0
$0
0
$0
APPLICATIONS DENIED
0
$0
13
$53,361
20
$53,784
6
$20,772
0
$0
0
$0
APPLICATIONS WITHDRAWN
0
$0
2
$96,000
10
$51,744
3
$21,300
0
$0
0
$0
FILES CLOSED FOR INCOMPLETENESS
0
$0
0
$0
2
$68,100
0
$0
0
$0
0
$0
Aggregated Statistics For Year 1999 (Based on 3 partial tracts)
A) FHA, FSA/RHS & VA Home Purchase Loans
B) Conventional Home Purchase Loans
C) Refinancings
D) Home Improvement Loans
E) Loans on Dwellings For 5+ Families
F) Non-occupant Loans on < 5 Family Dwellings (A B C & D)
2004 - 2018 National Fire Incident Reporting System (NFIRS) incidents
Based on the data from the years 2004 - 2018 the average number of fires per year is 11. The highest number of reported fire incidents - 29 took place in 2015, and the least - 2 in 2005. The data has a rising trend.
When looking into fire subcategories, the most incidents belonged to: Structure Fires (66.7%), and Outside Fires (23.6%).
Fire incident types reported to NFIRS in Zip Code 54129
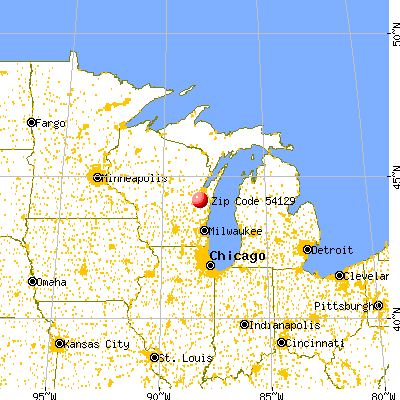


 Nearest zip codes: 54160, 54123, 54169, 53014, 53088, 54110.


 Based on the data from the years 2004 - 2018 the average number of fires per year is 11. The highest number of reported fire incidents - 29 took place in 2015, and the least - 2 in 2005. The data has a rising trend.
 When looking into fire subcategories, the most incidents belonged to: Structure Fires (66.7%), and Outside Fires (23.6%).