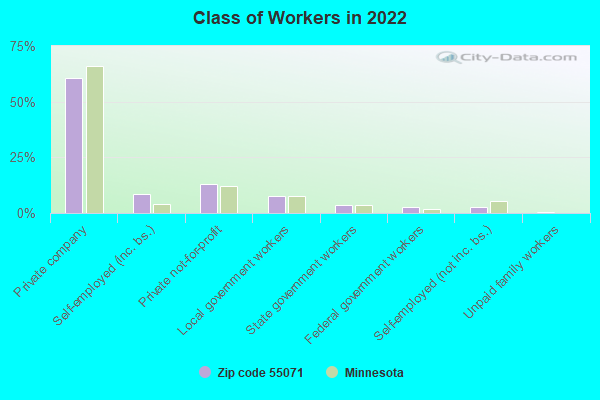
Estimated zip code population in 2022: 5,917 Zip code population in 2010: 5,569 Zip code population in 2000: 5,185
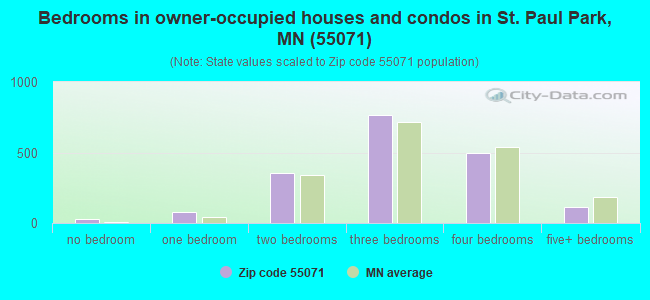
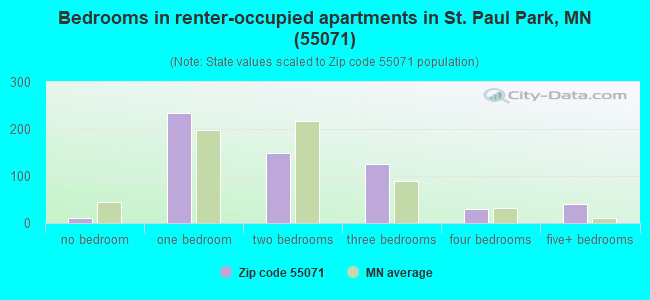
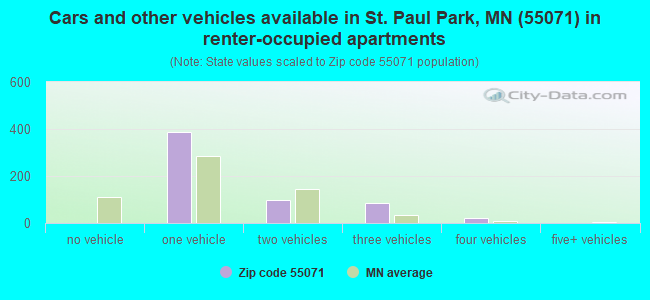
Houses and condos: 2,521 Renter-occupied apartments: 591
% of renters here:
24%
State:
28%
March 2022 cost of living index in zip code 55071: 114.3 (more than average, U.S. average is 100)
Land area: 5.1 sq. mi. Water area: 1.2 sq. mi.
Population density: 1,150 people per square mile
(low).
OSM Map
General Map
Google Map
MSN Map
OSM Map
General Map
Google Map
MSN Map
OSM Map
General Map
Google Map
MSN Map
OSM Map
General Map
Google Map
MSN Map
Please wait while loading the map...
Real estate property taxes paid for housing units in 2022:
This zip code:
1.0% ($2,839)
Minnesota:
1.0% ($3,087)
Median real estate property taxes paid for housing units with mortgages in 2022: $2,784 (0.9%) Median real estate property taxes paid for housing units with no mortgage in 2022: $2,923 (1.3%)
Business Search- 14 Million verified businesses
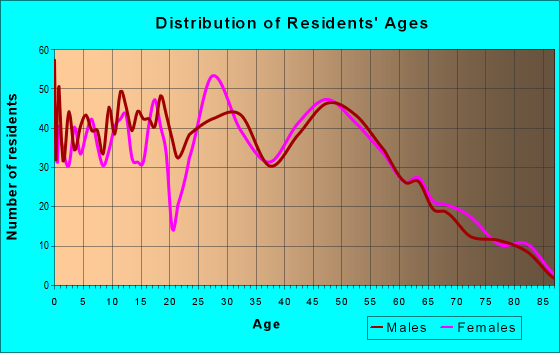
Males: 3,242
(54.8%)
Females: 2,675
(45.2%)
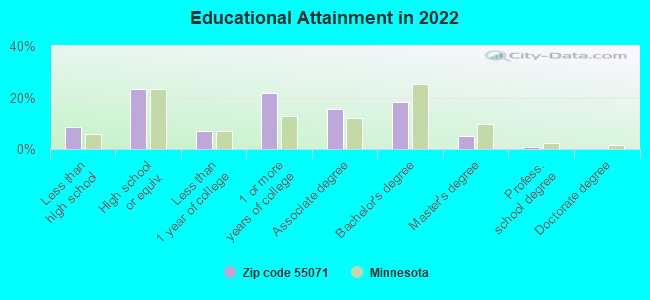
For population 25 years and over in 55071:
High school or higher: 90.4%
Bachelor's degree or higher: 23.9%
Graduate or professional degree: 5.8%
Unemployed: 0.7%
Mean travel time to work (commute): 26.5 minutes
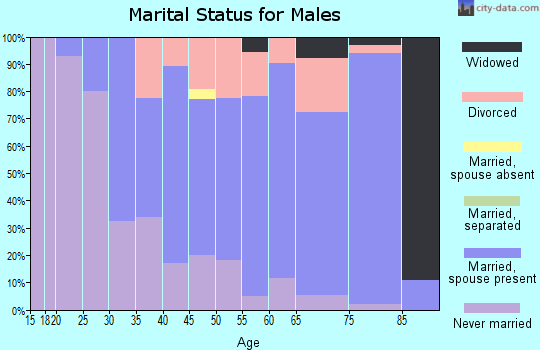
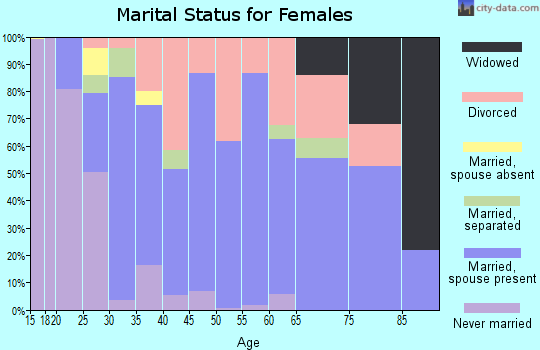
For population 15 years and over in 55071:
Never married: 40.9%
Now married: 45.2%
Separated: 3.0%
Widowed: 3.5%
Divorced: 7.5%
Zip code 55071 compared to state average:
Unemployed percentage significantly below state average.
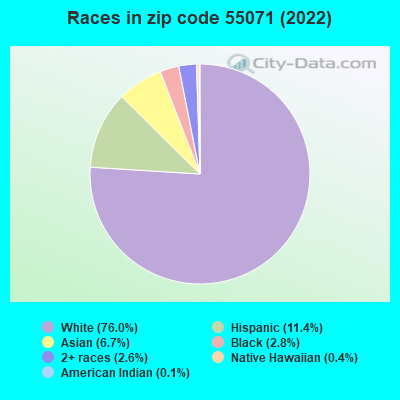
Black race population percentage below state average.
Hispanic race population percentage above state average.
Percentage of population with a bachelor's degree or higher below state average.
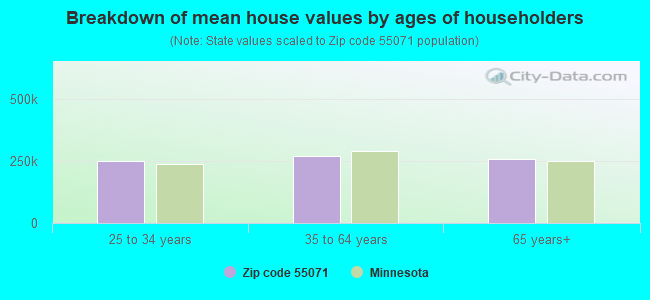
Estimated median house/condo value in 2022: $277,524
55071:
$277,524
Minnesota:
$314,600
Median resident age:
This zip code:
39.7 years
Minnesota median age:
39.0 years
Average household size:
This zip code:
2.4 people
Minnesota:
2.4 people
Averages for the 2020 tax year for zip code 55071, filed in 2021:
Average Adjusted Gross Income (AGI) in 2020: $57,187 (Individual Income Tax Returns)
Here:
$57,187
State:
$82,178
Salary/wage: $52,680 (reported on 86.3% of returns)
Here:
$52,680
State:
$67,438
(% of AGI for various income ranges: 1119.1% for AGIs below $25k, 3715.1% for AGIs $25k-50k, 7061.8% for AGIs $50k-75k, 9582.0% for AGIs $75k-100k, 16835.7% for AGIs $100k-200k)
Taxable interest for individuals: $678 (reported on 22.4% of returns)
This zip code:
$678
Minnesota:
$1,814
(% of AGI for various income ranges: 8.7% for AGIs below $25k, 12.0% for AGIs $25k-50k, 12.8% for AGIs $50k-75k, 37.2% for AGIs $75k-100k, 64.3% for AGIs $100k-200k)
Ordinary dividends: $2,466 (reported on 13.7% of returns)
Here:
$2,466
State:
$6,928
(% of AGI for various income ranges: 23.1% for AGIs below $25k, 14.4% for AGIs $25k-50k, 52.1% for AGIs $50k-75k, 68.0% for AGIs $75k-100k, 147.1% for AGIs $100k-200k)
Net capital gain/loss in AGI: +$4,597 (reported on 10.7% of returns)
Here:
+$4,597
State:
+$20,591
(% of AGI for various income ranges: 2.4% for AGIs below $25k, 13.0% for AGIs $25k-50k, 38.2% for AGIs $50k-75k, 120.8% for AGIs $75k-100k, 327.1% for AGIs $100k-200k)
Profit/loss from business: +$9,452 (reported on 11.0% of returns)
Here:
+$9,452
State:
+$14,342
(% of AGI for various income ranges: 95.0% for AGIs below $25k, 77.7% for AGIs $25k-50k, 212.3% for AGIs $50k-75k, 139.2% for AGIs $75k-100k, 316.4% for AGIs $100k-200k)
Taxable individual retirement arrangement distribution: $13,595 (reported on 7.4% of returns)
55071:
$13,595
Minnesota:
$20,675
(% of AGI for various income ranges: 49.6% for AGIs below $25k, 67.3% for AGIs $25k-50k, 141.3% for AGIs $50k-75k, 324.8% for AGIs $75k-100k, 317.5% for AGIs $100k-200k)
Total itemized deductions: $22,136 (reported on 8.4% of returns)
Here:
$22,136
State:
$33,311
(% of AGI for various income ranges: 162.6% for AGIs $25k-50k, 356.4% for AGIs $50k-75k, 492.8% for AGIs $75k-100k, 633.6% for AGIs $100k-200k)
Charity contributions: $4,247 (reported on 5.7% of returns)
Here:
$4,247
State:
$11,879
(% of AGI for various income ranges: 15.3% for AGIs $25k-50k, 27.9% for AGIs $50k-75k, 59.2% for AGIs $75k-100k, 127.9% for AGIs $100k-200k)
Taxes paid: $7,064 (reported on 8.4% of returns)
55071:
$7,064
State:
$8,252
(% of AGI for various income ranges: 30.7% for AGIs $25k-50k, 115.4% for AGIs $50k-75k, 183.2% for AGIs $75k-100k, 229.6% for AGIs $100k-200k)
Earned income credit: $2,016 (reported on 12.4% of returns)
Here:
$2,016
State:
$2,055
(% of AGI for various income ranges: 72.4% for AGIs below $25k, 50.7% for AGIs $25k-50k)
Percentage of individuals using paid preparers for their 2020 taxes: 93.0%
Here:
93%
State:
94%
(% for various income ranges: 90.5% for AGIs below $25k, 94.3% for AGIs $25k-50k, 94.5% for AGIs $50k-75k, 94.4% for AGIs $75k-100k, 93.2% for AGIs $100k-200k, 66.7% for AGIs over 200k)
Averages for the 2012 tax year for zip code 55071, filed in 2013:
Average Adjusted Gross Income (AGI) in 2012: $46,902 (Individual Income Tax Returns)
Here:
$46,902
State:
$67,192
Salary/wage: $43,337 (reported on 87.5% of returns)
Here:
$43,337
State:
$55,182
(% of AGI for various income ranges: 75.5% for AGIs below $25k, 82.4% for AGIs $25k-50k, 80.6% for AGIs $50k-75k, 83.6% for AGIs $75k-100k, 79.5% for AGIs $100k-200k)
Taxable interest for individuals: $616 (reported on 27.4% of returns)
This zip code:
$616
Minnesota:
$1,664
(% of AGI for various income ranges: 0.8% for AGIs below $25k, 0.5% for AGIs $25k-50k, 0.5% for AGIs $50k-75k, 0.2% for AGIs $75k-100k, 0.1% for AGIs $100k-200k)
Ordinary dividends: $1,398 (reported on 14.6% of returns)
Here:
$1,398
State:
$5,665
(% of AGI for various income ranges: 1.1% for AGIs below $25k, 0.6% for AGIs $25k-50k, 0.3% for AGIs $50k-75k, 0.3% for AGIs $75k-100k, 0.3% for AGIs $100k-200k)
Net capital gain/loss in AGI: +$2,875 (reported on 9.7% of returns)
Here:
+$2,875
State:
+$16,131
(% of AGI for various income ranges: 0.2% for AGIs $25k-50k, 0.3% for AGIs $50k-75k, 0.6% for AGIs $75k-100k, 1.5% for AGIs $100k-200k)
Profit/loss from business: +$7,000 (reported on 10.1% of returns)
Here:
+$7,000
State:
+$12,430
(% of AGI for various income ranges: 3.9% for AGIs below $25k, 2.5% for AGIs $25k-50k, 1.0% for AGIs $50k-75k, 1.2% for AGIs $75k-100k, 0.4% for AGIs $100k-200k)
Taxable individual retirement arrangement distribution: $11,144 (reported on 8.7% of returns)
55071:
$11,144
Minnesota:
$15,212
(% of AGI for various income ranges: 2.7% for AGIs below $25k, 1.8% for AGIs $25k-50k, 2.7% for AGIs $50k-75k, 1.9% for AGIs $75k-100k, 1.6% for AGIs $100k-200k)
Total itemized deductions: $17,543 (23% of AGI, reported on 36.5% of returns)
Here:
$17,543
State:
$24,665
Here:
23.3% of AGI
State:
19.6% of AGI
(% of AGI for various income ranges: 8.1% for AGIs below $25k, 11.7% for AGIs $25k-50k, 13.5% for AGIs $50k-75k, 14.0% for AGIs $75k-100k, 17.0% for AGIs $100k-200k)
Charity contributions: $1,995 (reported on 28.5% of returns)
Here:
$1,995
State:
$3,948
(% of AGI for various income ranges: 0.6% for AGIs below $25k, 0.9% for AGIs $25k-50k, 1.1% for AGIs $50k-75k, 1.2% for AGIs $75k-100k, 1.8% for AGIs $100k-200k)
Taxes paid: $6,173 (reported on 36.1% of returns)
55071:
$6,173
State:
$10,589
(% of AGI for various income ranges: 1.7% for AGIs below $25k, 3.3% for AGIs $25k-50k, 4.5% for AGIs $50k-75k, 5.4% for AGIs $75k-100k, 6.7% for AGIs $100k-200k)
Earned income credit: $2,043 (reported on 15.3% of returns)
Here:
$2,043
State:
$2,037
(% of AGI for various income ranges: 5.2% for AGIs below $25k, 0.9% for AGIs $25k-50k)
Percentage of individuals using paid preparers for their 2012 taxes: 48.6%
Here:
49%
State:
55%
(% for various income ranges: 44.4% for AGIs below $25k, 50.0% for AGIs $25k-50k, 52.9% for AGIs $50k-75k, 50.0% for AGIs $75k-100k, 50.0% for AGIs $100k-200k)
Averages for the 2004 tax year for zip code 55071, filed in 2005:
Average Adjusted Gross Income (AGI) in 2004: $42,531 (Individual Income Tax Returns)
Here:
$42,531
State:
$53,560
Salary/wage: $39,741 (reported on 88.9% of returns)
Here:
$39,741
State:
$46,177
(% of AGI for various income ranges: 90.3% for AGIs below $10k, 75.7% for AGIs $10k-25k, 82.0% for AGIs $25k-50k, 87.1% for AGIs $50k-75k, 89.4% for AGIs $75k-100k, 74.6% for AGIs over 100k)
Taxable interest for individuals: $579 (reported on 39.9% of returns)
This zip code:
$579
Minnesota:
$1,796
(% of AGI for various income ranges: 2.0% for AGIs below $10k, 1.2% for AGIs $10k-25k, 0.9% for AGIs $25k-50k, 0.3% for AGIs $50k-75k, 0.2% for AGIs $75k-100k, 0.2% for AGIs over 100k)
Taxable dividends: $927 (reported on 20.4% of returns)
Here:
$927
State:
$3,096
(% of AGI for various income ranges: 1.9% for AGIs below $10k, 0.6% for AGIs $10k-25k, 0.4% for AGIs $25k-50k, 0.5% for AGIs $50k-75k, 0.2% for AGIs $75k-100k, 0.4% for AGIs over 100k)
Net capital gain/loss: +$2,415 (reported on 13.0% of returns)
Here:
+$2,415
State:
+$10,864
(% of AGI for various income ranges: -0.9% for AGIs below $10k, -0.3% for AGIs $10k-25k, -0.0% for AGIs $25k-50k, 0.3% for AGIs $50k-75k, 0.3% for AGIs $75k-100k, 3.6% for AGIs over 100k)
Profit/loss from business: +$6,990 (reported on 11.9% of returns)
Here:
+$6,990
State:
+$10,442
(% of AGI for various income ranges: 7.0% for AGIs below $10k, 4.3% for AGIs $10k-25k, 1.6% for AGIs $25k-50k, 2.0% for AGIs $50k-75k, 1.5% for AGIs $75k-100k, 1.3% for AGIs over 100k)
IRA payment deduction: $2,522 (reported on 1.8% of returns)
55071:
$2,522
Minnesota:
$2,955
Total itemized deductions: $15,772 (25% of AGI, reported on 45.3% of returns)
Here:
$15,772
State:
$20,035
Here:
24.5% of AGI
State:
21.3% of AGI
(% of AGI for various income ranges: 7.3% for AGIs below $10k, 11.6% for AGIs $10k-25k, 14.9% for AGIs $25k-50k, 17.9% for AGIs $50k-75k, 17.9% for AGIs $75k-100k, 20.0% for AGIs over 100k)
Charity contributions deductions: $2,006 (3% of AGI, reported on 38.2% of returns)
Here:
$2,006
State:
$3,333
Here:
3.0% of AGI
State:
3.4% of AGI
(% of AGI for various income ranges: 0.5% for AGIs below $10k, 0.9% for AGIs $10k-25k, 1.3% for AGIs $25k-50k, 1.7% for AGIs $50k-75k, 1.9% for AGIs $75k-100k, 3.1% for AGIs over 100k)
Total tax: $4,684 (reported on 80.3% of returns)
55071:
$4,684
State:
$8,485
(% of AGI for various income ranges: 2.1% for AGIs below $10k, 4.6% for AGIs $10k-25k, 7.3% for AGIs $25k-50k, 8.4% for AGIs $50k-75k, 9.4% for AGIs $75k-100k, 13.8% for AGIs over 100k)
Earned income credit: $1,575 (reported on 10.4% of returns)
Here:
$1,575
State:
$1,523
Percentage of individuals using paid preparers for their 2004 taxes: 51.7%
Here:
52%
State:
59%
(% for various income ranges: 39.4% for AGIs below $10k, 50.5% for AGIs $10k-25k, 55.4% for AGIs $25k-50k, 54.9% for AGIs $50k-75k, 52.5% for AGIs $75k-100k, 58.3% for AGIs over 100k)
Household received Food Stamps/SNAP in the past 12 months: 151 Household did not receive Food Stamps/SNAP in the past 12 months: 2,275
Women who had a birth in the past 12 months: 69 (42 now married, 25 unmarried) Women who did not have a birth in the past 12 months: 1,199 (479 now married, 720 unmarried)
Housing units in zip code 55071 with a mortgage: 1,142 (122 second mortgage, 77 both second mortgage and home equity loan) Median monthly owner costs for units with a mortgage: $1,927 Median monthly owner costs for units without a mortgage: $636
Residents with income below the poverty level in 2022:
This zip code:
5.6%
Whole state:
9.6%
Residents with income below 50% of the poverty level in 2022:
This zip code:
3.4%
Whole state:
5.2%
Median number of rooms in houses and condos:
Here:
7.2
State:
7.1
Median number of rooms in apartments:
Here:
3.8
State:
3.8
Notable locations in this zip code not listed on our city pages
Parks in zip code 55071 include: Abdelia Park (1), Lincoln Park (2), Heritage Park (3), Lions Park (4), Riverside Park (5). Display/hide their locations on the map
In group quarters: 15 (-1 institutionalized population)
Size of family households: 580 2-persons, 361 3-persons, 214 4-persons, 144 5-persons, 56 6-persons, 86 7-or-more-persons
Size of nonfamily households: 768 1-person, 210 2-persons, 3 3-persons
701 married couples with children.
418 single-parent households (241 men, 177 women).
87.3% of residents of 55071 zip code speak English at home.
6.5% of residents speak Spanish at home (64% very well, 19% well, 17% not well).
1.3% of residents speak other Indo-European language at home (59% very well, 41% not well).
4.1% of residents speak Asian or Pacific Island language at home (47% very well, 35% well, 18% not well).
0.2% of residents speak other language at home (25% very well, 75% well).
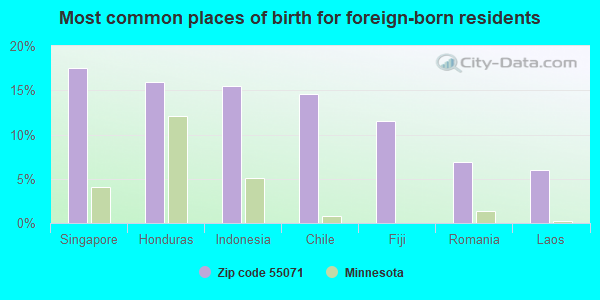
Foreign born population: 435 (7.4%) (65.0% of them are naturalized citizens)
This zip code:
7.4%
Whole state:
8.7%
18%Singapore
16%Honduras
15%Indonesia
15%Chile
12%Fiji
7%Romania
6%Laos
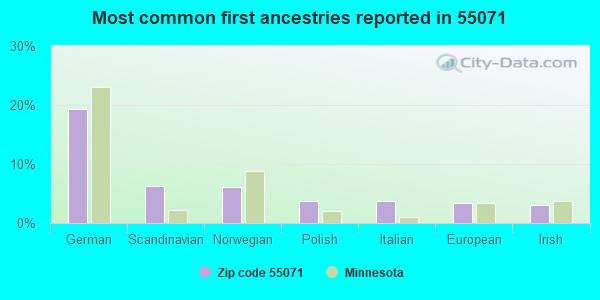
19%German
6%Scandinavian
6%Norwegian
4%Polish
4%Italian
3%European
3%Irish
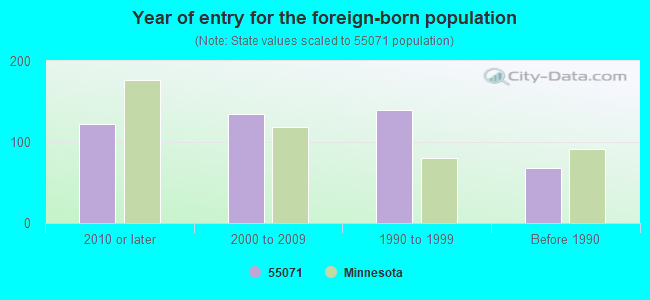
Year of entry for the foreign-born population
1222010 or later
1352000 to 2009
1401990 to 1999
68Before 1990
Major facilities with environmental interests located in this zip code:
AGGREGATE INDUSTRIES INCORPORATED LARSON (10120 GREY CLOUD ISLAND DRIVE SOUTH in ST PAUL PARK, MN)
AIR MINOR (AIRS/AFS) STATE MASTER (Minnesota Pollution Control Agency permits and compilance tracking) - AIRS-2716300007, AIR PROGRAM, RCRAINFO-MND066524133, CESQG, PCS-MN0030473, NPDES NON-MAJOR, PCS-066524133, GENERAL PERMIT STORM WATER IND, AFS-2716300007, AIR SYNTHETIC MINOR, RCRIS-MND066524133, SQG CRITERIA AND HAZARDOUS AIR POLLUTANT INVENTORY (Inventory of air pollution sources) National Pollutant Discharge Elimination System NON-MAJOR (Tracking pollutant discharge elimination systems) - permit (Resource Conservation and Recovery Act (tracking hazardous waste)) Business SIC and NAICS classification: CRUSHED AND BROKEN LIMESTONE Alternative names: AGGREGATE INDUSTRIES-LARSON, AGGREGATE INDUSTRIES LARSON PLT, CAMAS LARSON PLANT, SHIELY COMPANY
GARELICK MFG CO (644 2ND ST in ST PAUL PARK, MN)
STATE MASTER (Minnesota Pollution Control Agency permits and compilance tracking) - RCRAINFO-MND006185607, HAZARDOUS WASTE PROGRAM, RCRIS-MND006185607, (Resource Conservation and Recovery Act (tracking hazardous waste)) Business SIC classification: HARDWARE Business NAICS classification: ALL OTHER MISCELLANEOUS FABRICATED METAL PRODUCT MANUFACTURING. Organizations: GARELICK MANUFACTURING CO (CONTACT/OWNER)
GE BETZ/MARATHON ASHLAND (459 3RD ST in ST. PAUL PARK, MN)
STATE MASTER (Minnesota Pollution Control Agency permits and compilance tracking) - RCRIS-MNS000102087, HAZARDOUS WASTE PROGRAM (Resource Conservation and Recovery Act (tracking hazardous waste)) Organizations: MARATHON ASHLAND PETROLEUM LLC (CONTACT/OWNER)
, MARATHON PETROLEUM CO LLC (CONTACT/OWNER)
BROADWAY AUTOMOTIVE (228 BROADWAY in ST PAUL PARK, MN)
STATE MASTER (Minnesota Pollution Control Agency permits and compilance tracking) - RCRAINFO-MND023065063, CESQG, RCRIS-MND023065063, Small Quantity Generators, between 100 kg and 1000 kg of hazardous waste/month (Resource Conservation and Recovery Act (tracking hazardous waste)) - notification Business SIC classification: TOP, BODY, AND UPHOLSTERY REPAIR SHOPS AND PAINT SHOPS Business NAICS classification: AUTOMOTIVE BODY, PAINT, AND INTERIOR REPAIR AND MAINTENANCE. Organizations: DUFF JOHN (CONTACT/OWNER)
EASTSIDE SALES AND LEASING INC (805 MAIN ST in ST PAUL PARK, MN)
STATE MASTER (Minnesota Pollution Control Agency permits and compilance tracking) - RCRAINFO-MND102252517, CESQG, PCS-A00001971, GENERAL PERMIT STORM WATER IND, NPDES STORMWATER PERMIT, RCRIS-MND102252517, CESQG Small Quantity Generators, between 100 kg and 1000 kg of hazardous waste/month (Resource Conservation and Recovery Act (tracking hazardous waste)) - notification Business SIC classification: SCRAP AND WASTE MATERIALS Organizations: HANSMEYEN JOE (CONTACT/OWNER)
, EAST SIDE SALES & LEASING INC (CONTACT/OWNER)
Alternative names: EAST SIDE SALES& LEASING INC
FROSTLAND SUPPLY INC (200 HASTINGS AVE in ST PAUL PARK, MN)
STATE MASTER (Minnesota Pollution Control Agency permits and compilance tracking) - RCRAINFO-MND064598618, TRANSPORTER, RCRIS-MND064598618, TRANSPORTER (Resource Conservation and Recovery Act (tracking hazardous waste)) Business SIC classification: TRUCKING, EXCEPT LOCAL
ASHLAND INC (601 FACTORY ST in ST PAUL PARK, MN)
STATE MASTER (Minnesota Pollution Control Agency permits and compilance tracking) - RCRAINFO-MNR000077511, SQG, RCRIS-MNR000077511, Small Quantity Generators, between 100 kg and 1000 kg of hazardous waste/month (Resource Conservation and Recovery Act (tracking hazardous waste)) - notification Organizations: ASHLAND CHEMICAL CO (CONTACT/OWNER)
NIGHTHAWK TRANSPORT INC (356 9TH AVE in ST PAUL PARK, MN)
STATE MASTER (Minnesota Pollution Control Agency permits and compilance tracking) - RCRAINFO-MNR000022947, TRANSPORTER, RCRIS-MNR000022947, TRANSPORTER (Resource Conservation and Recovery Act (tracking hazardous waste)) Organizations: KEYES DAVID AND CROSS TERRANCE (CONTACT/OWNER)
FREDDIES AUTO (1353 SEVENTH ST in ST PAUL PARK, MN)
STATE MASTER (Minnesota Pollution Control Agency permits and compilance tracking) - RCRAINFO-MND985703040, CESQG, RCRIS-MND985703040, Conditionally Exempt Small Quantity Generators, less than 100 kg/month of hazardous waste (Resource Conservation and Recovery Act (tracking hazardous waste)) - notification Organizations: KIRKUP GRAIG (CONTACT/OWNER)
OLTMAN JR. (1020 3RD ST. in ST. PAUL PARK, MN)
(National Center for Education Statistics) - STATE ID-010833022 Organizations: SOUTH WASHINGTON COUNTY (SCHOOL DISTRICT)
ASHLAND PETROLEUM CO (401 E BROADWAY in ST PAUL PARK, MN)
(Resource Conservation and Recovery Act (tracking hazardous waste))
NORTHERN STATES PWR-CHEMOLITE GEN PLT (RTE 1 BOX 108 in ST PAUL PARK, MN)
(Resource Conservation and Recovery Act (tracking hazardous waste))
BOW CHEMICAL CO (100 E BROADWAY in SAINT PAUL PARK, MN)
Small Quantity Generators, between 100 kg and 1000 kg of hazardous waste/month (Resource Conservation and Recovery Act (tracking hazardous waste)) - notification
Housing units lacking complete plumbing facilities: 0.2% Housing units lacking complete kitchen facilities: 2.1%
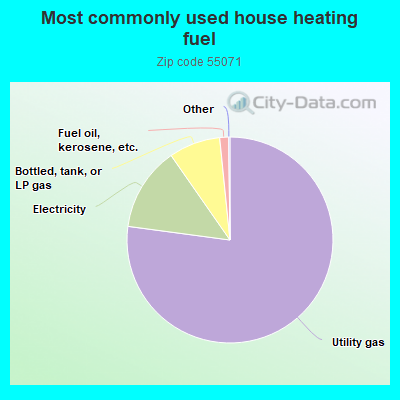
77.2%Utility gas
13.2%Electricity
8.1%Bottled, tank, or LP gas
1.4%Fuel oil, kerosene, etc.
Population in 1990: 5,517.
Place of birth for U.S.-born residents:
This state: 4,267
Northeast: 229
Midwest: 511
South: 106
West: 318
66% of the 55071 zip code residents lived in the same house 5 years ago. Out of people who lived in different houses, 47% lived in this county. Out of people who lived in different counties, 50% lived in Minnesota.
92% of the 55071 zip code residents lived in the same house 1 year ago. Out of people who lived in different houses, 45% moved from this county. Out of people who lived in different houses, 33% moved from different county within same state. Out of people who lived in different houses, 24% moved from different state.
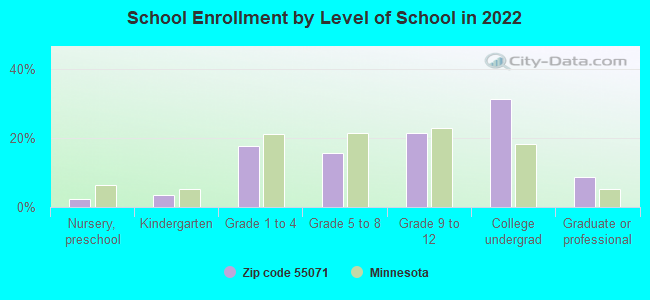
Private vs. public school enrollment:
Students in private schools in grades 1 to 8 (elementary and middle school): 46
Here:
9.2%
Minnesota:
12.9%
Students in private schools in grades 9 to 12 (high school): 15
Here:
4.8%
Minnesota:
8.6%
Students in private undergraduate colleges: 150
Here:
31.5%
Minnesota:
26.2%
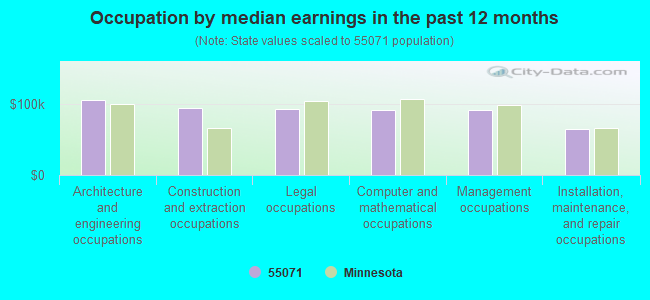
Occupation by median earnings in the past 12 months ($)
106,015Architecture and engineering occupations
94,878Construction and extraction occupations
94,044Legal occupations
92,352Computer and mathematical occupations
91,883Management occupations
65,666Installation, maintenance, and repair occupations
Top industries in this zip code by the number of employees in 2005:
Wholesale Trade: Other Grocery and Related Products Merchant Wholesalers (250-499 employees: 1 establishment)
Accommodation and Food Services: Full-Service Restaurants (20-49: 2, 10-19: 1)
Other Services (except Public Administration): Religious Organizations (20-49: 1, 5-9: 2, 1-4: 2)
Construction: Plumbing, Heating, and Air-Conditioning Contractors (20-49: 1, 5-9: 2)
Health Care and Social Assistance: Offices of Dentists (20-49: 1)
Wholesale Trade: Petroleum Bulk Stations and Terminals (20-49: 1)
Administrative and Support and Waste Management and Remediation Services: Materials Recovery Facilities (20-49: 1)
Arts, Entertainment, and Recreation: Bowling Centers (20-49: 1)
People in group quarters in 2010:
27 people in other noninstitutional facilities
6 people in group homes intended for adults
People in group quarters in 2000:
61 people in other noninstitutional group quarters
Home Mortgage Disclosure Act Aggregated Statistics For Year 2009 (Based on 8 partial tracts)
A) FHA, FSA/RHS & VA Home Purchase Loans
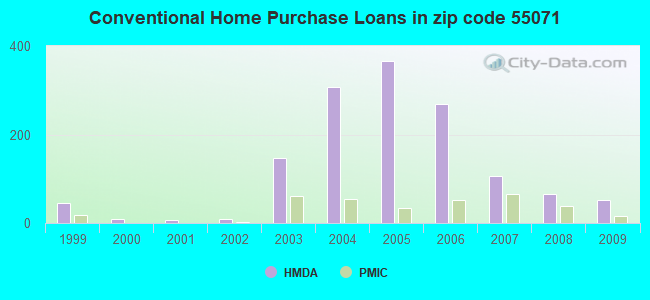
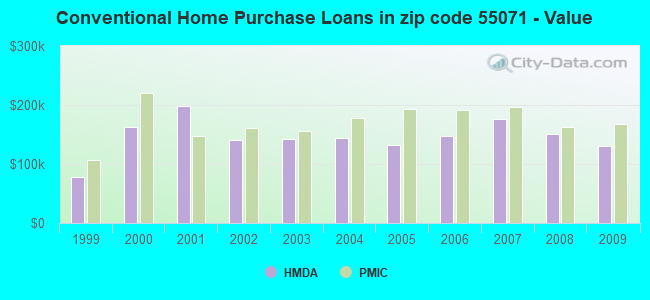
B) Conventional Home Purchase Loans
C) Refinancings
D) Home Improvement Loans
F) Non-occupant Loans on < 5 Family Dwellings (A B C & D)
G) Loans On Manufactured Home Dwelling (A B C & D)
Number
Average Value
Number
Average Value
Number
Average Value
Number
Average Value
Number
Average Value
Number
Average Value
LOANS ORIGINATED
103
$140,941
53
$130,579
187
$148,901
2
$231,695
12
$142,308
5
$37,316
APPLICATIONS APPROVED, NOT ACCEPTED
4
$125,278
2
$116,395
23
$162,454
2
$3,555
0
$0
0
$0
APPLICATIONS DENIED
14
$149,141
34
$66,436
90
$157,109
20
$50,911
4
$133,712
22
$27,189
APPLICATIONS WITHDRAWN
4
$151,780
9
$88,258
50
$172,994
7
$85,550
5
$129,722
4
$42,205
FILES CLOSED FOR INCOMPLETENESS
0
$0
0
$0
22
$142,102
0
$0
0
$0
0
$0
Aggregated Statistics For Year 2008 (Based on 8 partial tracts)
A) FHA, FSA/RHS & VA Home Purchase Loans
B) Conventional Home Purchase Loans
C) Refinancings
D) Home Improvement Loans
E) Loans on Dwellings For 5+ Families
F) Non-occupant Loans on < 5 Family Dwellings (A B C & D)
G) Loans On Manufactured Home Dwelling (A B C & D)
Number
Average Value
Number
Average Value
Number
Average Value
Number
Average Value
Number
Average Value
Number
Average Value
Number
Average Value
LOANS ORIGINATED
64
$165,261
66
$150,458
145
$151,013
24
$49,097
2
$426,480
25
$148,387
5
$36,250
APPLICATIONS APPROVED, NOT ACCEPTED
9
$148,873
11
$92,243
35
$148,025
0
$0
0
$0
5
$133,986
5
$46,558
APPLICATIONS DENIED
0
$0
16
$75,129
136
$182,365
17
$22,432
0
$0
9
$155,981
14
$30,463
APPLICATIONS WITHDRAWN
2
$109,155
4
$97,422
40
$179,104
4
$104,842
0
$0
0
$0
2
$17,770
FILES CLOSED FOR INCOMPLETENESS
2
$79,075
2
$206,130
15
$116,038
2
$8,885
0
$0
0
$0
2
$8,885
Aggregated Statistics For Year 2007 (Based on 8 partial tracts)
A) FHA, FSA/RHS & VA Home Purchase Loans
B) Conventional Home Purchase Loans
C) Refinancings
D) Home Improvement Loans
F) Non-occupant Loans on < 5 Family Dwellings (A B C & D)
G) Loans On Manufactured Home Dwelling (A B C & D)
Number
Average Value
Number
Average Value
Number
Average Value
Number
Average Value
Number
Average Value
Number
Average Value
LOANS ORIGINATED
5
$231,366
106
$176,254
206
$135,900
46
$50,014
18
$146,405
5
$58,286
APPLICATIONS APPROVED, NOT ACCEPTED
2
$135,940
20
$143,422
60
$141,854
15
$70,969
0
$0
4
$36,872
APPLICATIONS DENIED
2
$169,705
42
$166,997
176
$173,160
36
$67,262
4
$190,318
11
$44,102
APPLICATIONS WITHDRAWN
0
$0
14
$191,653
93
$177,042
7
$83,011
2
$123,500
0
$0
FILES CLOSED FOR INCOMPLETENESS
0
$0
7
$138,860
31
$185,315
4
$248,335
4
$248,335
0
$0
Aggregated Statistics For Year 2006 (Based on 8 partial tracts)
A) FHA, FSA/RHS & VA Home Purchase Loans
B) Conventional Home Purchase Loans
C) Refinancings
D) Home Improvement Loans
E) Loans on Dwellings For 5+ Families
F) Non-occupant Loans on < 5 Family Dwellings (A B C & D)
G) Loans On Manufactured Home Dwelling (A B C & D)
Number
Average Value
Number
Average Value
Number
Average Value
Number
Average Value
Number
Average Value
Number
Average Value
Number
Average Value
LOANS ORIGINATED
15
$199,101
270
$147,896
258
$138,012
49
$64,718
2
$319,860
52
$171,008
5
$31,630
APPLICATIONS APPROVED, NOT ACCEPTED
0
$0
38
$133,250
66
$153,720
6
$82,157
0
$0
7
$187,347
4
$38,650
APPLICATIONS DENIED
4
$196,358
59
$161,613
184
$161,961
22
$101,390
2
$8,885
19
$186,182
9
$29,419
APPLICATIONS WITHDRAWN
1
$156,440
39
$152,026
112
$156,188
11
$92,889
2
$302,090
15
$118,887
0
$0
FILES CLOSED FOR INCOMPLETENESS
0
$0
18
$155,709
35
$184,617
2
$16,880
0
$0
2
$275,425
0
$0
Aggregated Statistics For Year 2005 (Based on 8 partial tracts)
A) FHA, FSA/RHS & VA Home Purchase Loans
B) Conventional Home Purchase Loans
C) Refinancings
D) Home Improvement Loans
F) Non-occupant Loans on < 5 Family Dwellings (A B C & D)
G) Loans On Manufactured Home Dwelling (A B C & D)
Number
Average Value
Number
Average Value
Number
Average Value
Number
Average Value
Number
Average Value
Number
Average Value
LOANS ORIGINATED
47
$185,447
367
$132,266
392
$138,620
44
$21,277
49
$141,708
16
$106,021
APPLICATIONS APPROVED, NOT ACCEPTED
0
$0
51
$115,314
74
$129,961
0
$0
5
$112,662
4
$46,202
APPLICATIONS DENIED
7
$176,177
63
$115,895
167
$158,249
36
$64,169
15
$143,233
18
$40,673
APPLICATIONS WITHDRAWN
7
$192,677
31
$150,503
150
$166,057
15
$115,921
14
$114,363
2
$37,315
FILES CLOSED FOR INCOMPLETENESS
2
$204,355
13
$162,347
40
$157,538
4
$55,532
4
$215,460
0
$0
Aggregated Statistics For Year 2004 (Based on 8 partial tracts)
A) FHA, FSA/RHS & VA Home Purchase Loans
B) Conventional Home Purchase Loans
C) Refinancings
D) Home Improvement Loans
E) Loans on Dwellings For 5+ Families
F) Non-occupant Loans on < 5 Family Dwellings (A B C & D)
G) Loans On Manufactured Home Dwelling (A B C & D)
Number
Average Value
Number
Average Value
Number
Average Value
Number
Average Value
Number
Average Value
Number
Average Value
Number
Average Value
LOANS ORIGINATED
41
$176,550
307
$143,314
392
$136,717
48
$60,077
7
$89,357
37
$149,554
12
$33,022
APPLICATIONS APPROVED, NOT ACCEPTED
0
$0
51
$125,498
53
$114,958
9
$75,061
0
$0
8
$122,394
12
$39,242
APPLICATIONS DENIED
2
$204,355
79
$117,225
177
$143,897
20
$86,579
0
$0
17
$190,700
20
$37,761
APPLICATIONS WITHDRAWN
9
$187,141
48
$149,725
113
$154,601
14
$37,411
0
$0
11
$108,074
0
$0
FILES CLOSED FOR INCOMPLETENESS
2
$135,050
5
$205,196
45
$152,771
5
$40,516
0
$0
0
$0
0
$0
Aggregated Statistics For Year 2003 (Based on 8 partial tracts)
A) FHA, FSA/RHS & VA Home Purchase Loans
B) Conventional Home Purchase Loans
C) Refinancings
D) Home Improvement Loans
E) Loans on Dwellings For 5+ Families
F) Non-occupant Loans on < 5 Family Dwellings (A B C & D)
Number
Average Value
Number
Average Value
Number
Average Value
Number
Average Value
Number
Average Value
Number
Average Value
LOANS ORIGINATED
40
$172,221
146
$142,001
716
$120,536
57
$39,276
2
$266,550
27
$114,386
APPLICATIONS APPROVED, NOT ACCEPTED
0
$0
26
$76,253
80
$124,231
4
$7,998
0
$0
12
$77,003
APPLICATIONS DENIED
0
$0
47
$85,349
168
$123,581
23
$26,833
0
$0
8
$113,374
APPLICATIONS WITHDRAWN
2
$124,390
17
$123,932
152
$122,900
5
$117,992
0
$0
2
$95,960
FILES CLOSED FOR INCOMPLETENESS
0
$0
8
$130,523
24
$149,686
2
$17,770
0
$0
2
$95,960
Aggregated Statistics For Year 2002 (Based on 6 partial tracts)
A) FHA, FSA/RHS & VA Home Purchase Loans
B) Conventional Home Purchase Loans
C) Refinancings
D) Home Improvement Loans
F) Non-occupant Loans on < 5 Family Dwellings (A B C & D)
Number
Average Value
Number
Average Value
Number
Average Value
Number
Average Value
Number
Average Value
LOANS ORIGINATED
2
$154,550
8
$140,132
44
$175,967
2
$72,555
2
$123,935
APPLICATIONS APPROVED, NOT ACCEPTED
0
$0
0
$0
1
$128,760
1
$9,230
0
$0
APPLICATIONS DENIED
0
$0
0
$0
6
$153,710
0
$0
1
$102,750
APPLICATIONS WITHDRAWN
0
$0
1
$165,240
5
$110,302
0
$0
0
$0
FILES CLOSED FOR INCOMPLETENESS
0
$0
0
$0
3
$138,960
0
$0
0
$0
Aggregated Statistics For Year 2001 (Based on 6 partial tracts)
B) Conventional Home Purchase Loans
C) Refinancings
D) Home Improvement Loans
Number
Average Value
Number
Average Value
Number
Average Value
LOANS ORIGINATED
7
$198,496
29
$154,455
4
$40,892
APPLICATIONS APPROVED, NOT ACCEPTED
1
$182,860
3
$171,253
0
$0
APPLICATIONS DENIED
3
$196,977
5
$140,164
1
$20,970
APPLICATIONS WITHDRAWN
1
$203,410
4
$163,775
0
$0
FILES CLOSED FOR INCOMPLETENESS
0
$0
1
$119,530
0
$0
Aggregated Statistics For Year 2000 (Based on 6 partial tracts)
A) FHA, FSA/RHS & VA Home Purchase Loans
B) Conventional Home Purchase Loans
C) Refinancings
D) Home Improvement Loans
Number
Average Value
Number
Average Value
Number
Average Value
Number
Average Value
LOANS ORIGINATED
1
$162,730
8
$162,938
8
$122,675
3
$28,940
APPLICATIONS APPROVED, NOT ACCEPTED
0
$0
2
$131,270
0
$0
0
$0
APPLICATIONS DENIED
0
$0
4
$152,662
4
$79,478
3
$16,777
APPLICATIONS WITHDRAWN
0
$0
0
$0
1
$188,310
0
$0
FILES CLOSED FOR INCOMPLETENESS
0
$0
0
$0
2
$167,340
0
$0
Aggregated Statistics For Year 1999 (Based on 5 partial tracts)
A) FHA, FSA/RHS & VA Home Purchase Loans
B) Conventional Home Purchase Loans
C) Refinancings
D) Home Improvement Loans
E) Loans on Dwellings For 5+ Families
F) Non-occupant Loans on < 5 Family Dwellings (A B C & D)
Detailed PMIC statistics for the following Tracts:0712.03
, 0713.00
2002 - 2018 National Fire Incident Reporting System (NFIRS) incidents
Based on the data from the years 2002 - 2018 the average number of fire incidents per year is 23. The highest number of fire incidents - 34 took place in 2002, and the least - 8 in 2018. The data has a decreasing trend.
When looking into fire subcategories, the most reports belonged to: Structure Fires (43.0%), and Outside Fires (33.7%).
Fire incident types reported to NFIRS in Zip Code 55071
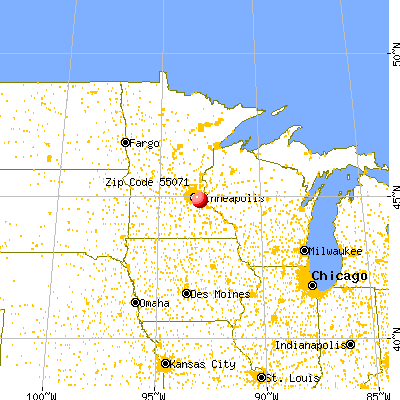


 Nearest zip codes: 55076, 55055, 55016, 55077, 55075, 55068.


 Based on the data from the years 2002 - 2018 the average number of fire incidents per year is 23. The highest number of fire incidents - 34 took place in 2002, and the least - 8 in 2018. The data has a decreasing trend.
 When looking into fire subcategories, the most reports belonged to: Structure Fires (43.0%), and Outside Fires (33.7%).