Estimated zip code population in 2022: 7,896 Zip code population in 2010: 7,367 Zip code population in 2000: 6,313
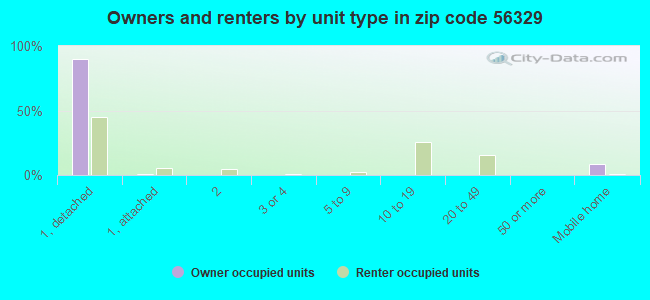
Houses and condos: 3,040 Renter-occupied apartments: 469
% of renters here:
17%
State:
28%
March 2022 cost of living index in zip code 56329: 86.7 (less than average, U.S. average is 100)
Land area: 191.3 sq. mi. Water area: 0.1 sq. mi.
Population density: 41 people per square mile
(very low).
OSM Map
General Map
Google Map
MSN Map
OSM Map
General Map
Google Map
MSN Map
OSM Map
General Map
Google Map
MSN Map
OSM Map
General Map
Google Map
MSN Map
Please wait while loading the map...
Real estate property taxes paid for housing units in 2022:
This zip code:
1.0% ($2,539)
Minnesota:
1.0% ($3,087)
Median real estate property taxes paid for housing units with mortgages in 2022: $2,589 (1.0%) Median real estate property taxes paid for housing units with no mortgage in 2022: $2,420 (1.0%)
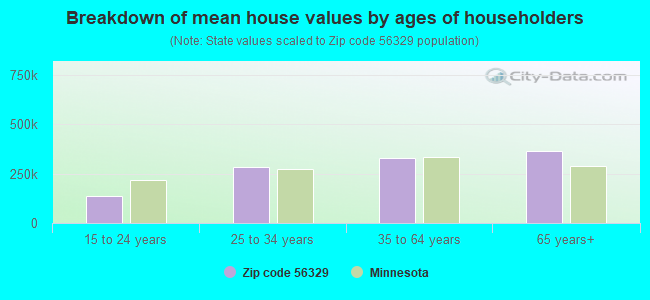
Estimated median house/condo value in 2022: $261,070
56329:
$261,070
Minnesota:
$314,600
According to our research of Minnesota and other state lists, there was 1 registered sex offender living in 56329 zip code as of April 27, 2024. The ratio of all residents to sex offenders in zip code 56329 is 7,505 to 1. The ratio of registered sex offenders to all residents in this zip code is near the state average.
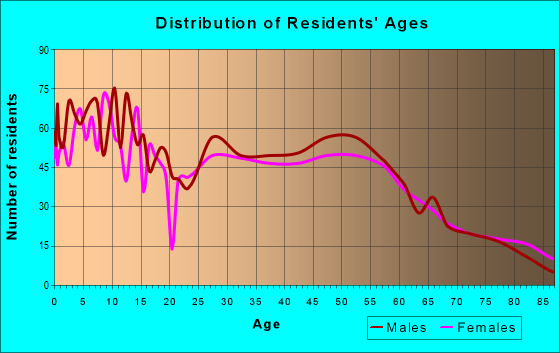
Median resident age:
This zip code:
36.7 years
Minnesota median age:
39.0 years
Average household size:
This zip code:
2.7 people
Minnesota:
2.4 people
Averages for the 2020 tax year for zip code 56329, filed in 2021:
Average Adjusted Gross Income (AGI) in 2020: $69,058 (Individual Income Tax Returns)
Here:
$69,058
State:
$82,178
Salary/wage: $57,776 (reported on 87.2% of returns)
Here:
$57,776
State:
$67,438
(% of AGI for various income ranges: 1513.1% for AGIs below $25k, 4042.9% for AGIs $25k-50k, 6892.9% for AGIs $50k-75k, 10404.5% for AGIs $75k-100k, 20192.7% for AGIs $100k-200k, 77930.0% for AGIs over 200k)
Taxable interest for individuals: $884 (reported on 32.8% of returns)
This zip code:
$884
Minnesota:
$1,814
(% of AGI for various income ranges: 25.6% for AGIs below $25k, 31.8% for AGIs $25k-50k, 30.3% for AGIs $50k-75k, 42.6% for AGIs $75k-100k, 77.6% for AGIs $100k-200k, 805.0% for AGIs over 200k)
Ordinary dividends: $2,796 (reported on 13.3% of returns)
Here:
$2,796
State:
$6,928
(% of AGI for various income ranges: 19.1% for AGIs below $25k, 24.8% for AGIs $25k-50k, 30.5% for AGIs $50k-75k, 49.0% for AGIs $75k-100k, 197.6% for AGIs $100k-200k, 545.0% for AGIs over 200k)
Net capital gain/loss in AGI: +$8,712 (reported on 13.9% of returns)
Here:
+$8,712
State:
+$20,591
(% of AGI for various income ranges: 36.9% for AGIs below $25k, 53.2% for AGIs $25k-50k, 130.3% for AGIs $50k-75k, 197.4% for AGIs $75k-100k, 401.2% for AGIs $100k-200k, 6110.0% for AGIs over 200k)
Profit/loss from business: +$12,448 (reported on 13.9% of returns)
Here:
+$12,448
State:
+$14,342
(% of AGI for various income ranges: 82.0% for AGIs below $25k, 100.3% for AGIs $25k-50k, 224.7% for AGIs $50k-75k, 481.0% for AGIs $75k-100k, 413.9% for AGIs $100k-200k, 5995.0% for AGIs over 200k)
Taxable individual retirement arrangement distribution: $14,830 (reported on 8.7% of returns)
56329:
$14,830
Minnesota:
$20,675
(% of AGI for various income ranges: 86.1% for AGIs below $25k, 130.3% for AGIs $25k-50k, 195.0% for AGIs $50k-75k, 258.7% for AGIs $75k-100k, 494.8% for AGIs $100k-200k)
Total itemized deductions: $31,258 (reported on 5.5% of returns)
Here:
$31,258
State:
$33,311
(% of AGI for various income ranges: 86.1% for AGIs below $25k, 216.6% for AGIs $50k-75k, 264.5% for AGIs $75k-100k, 497.0% for AGIs $100k-200k, 10955.0% for AGIs over 200k)
Charity contributions: $8,971 (reported on 4.1% of returns)
Here:
$8,971
State:
$11,879
(% of AGI for various income ranges: 23.9% for AGIs $50k-75k, 37.4% for AGIs $75k-100k, 107.3% for AGIs $100k-200k, 3475.0% for AGIs over 200k)
Taxes paid: $7,758 (reported on 5.5% of returns)
56329:
$7,758
State:
$8,252
(% of AGI for various income ranges: 75.8% for AGIs $50k-75k, 82.6% for AGIs $75k-100k, 168.2% for AGIs $100k-200k, 1875.0% for AGIs over 200k)
Earned income credit: $2,039 (reported on 9.6% of returns)
Here:
$2,039
State:
$2,055
(% of AGI for various income ranges: 60.6% for AGIs below $25k, 55.8% for AGIs $25k-50k)
Percentage of individuals using paid preparers for their 2020 taxes: 94.5%
Here:
94%
State:
94%
(% for various income ranges: 93.2% for AGIs below $25k, 95.3% for AGIs $25k-50k, 94.4% for AGIs $50k-75k, 93.5% for AGIs $75k-100k, 95.2% for AGIs $100k-200k, 100.0% for AGIs over 200k)
Averages for the 2012 tax year for zip code 56329, filed in 2013:
Average Adjusted Gross Income (AGI) in 2012: $49,160 (Individual Income Tax Returns)
Here:
$49,160
State:
$67,192
Salary/wage: $44,205 (reported on 87.8% of returns)
Here:
$44,205
State:
$55,182
(% of AGI for various income ranges: 77.2% for AGIs below $25k, 82.0% for AGIs $25k-50k, 83.8% for AGIs $50k-75k, 87.1% for AGIs $75k-100k, 79.8% for AGIs $100k-200k, 38.2% for AGIs over 200k)
Taxable interest for individuals: $941 (reported on 34.7% of returns)
This zip code:
$941
Minnesota:
$1,664
(% of AGI for various income ranges: 1.9% for AGIs below $25k, 0.8% for AGIs $25k-50k, 0.4% for AGIs $50k-75k, 0.4% for AGIs $75k-100k, 0.5% for AGIs $100k-200k, 0.7% for AGIs over 200k)
Ordinary dividends: $2,027 (reported on 13.8% of returns)
Here:
$2,027
State:
$5,665
(% of AGI for various income ranges: 1.1% for AGIs below $25k, 0.3% for AGIs $25k-50k, 0.7% for AGIs $50k-75k, 0.3% for AGIs $75k-100k, 0.9% for AGIs $100k-200k)
Net capital gain/loss in AGI: +$8,991 (reported on 14.1% of returns)
Here:
+$8,991
State:
+$16,131
(% of AGI for various income ranges: 3.6% for AGIs below $25k, 1.1% for AGIs $25k-50k, 0.7% for AGIs $50k-75k, 0.9% for AGIs $75k-100k, 2.6% for AGIs $100k-200k, 13.8% for AGIs over 200k)
Profit/loss from business: +$10,400 (reported on 16.2% of returns)
Here:
+$10,400
State:
+$12,430
(% of AGI for various income ranges: 6.3% for AGIs below $25k, 4.7% for AGIs $25k-50k, 3.6% for AGIs $50k-75k, 2.5% for AGIs $75k-100k, 3.2% for AGIs $100k-200k)
Taxable individual retirement arrangement distribution: $9,637 (reported on 8.4% of returns)
56329:
$9,637
Minnesota:
$15,212
(% of AGI for various income ranges: 3.2% for AGIs below $25k, 1.5% for AGIs $25k-50k, 1.5% for AGIs $50k-75k, 0.9% for AGIs $75k-100k, 2.5% for AGIs $100k-200k)
Total itemized deductions: $18,927 (23% of AGI, reported on 34.4% of returns)
Here:
$18,927
State:
$24,665
Here:
22.9% of AGI
State:
19.6% of AGI
(% of AGI for various income ranges: 10.1% for AGIs below $25k, 9.1% for AGIs $25k-50k, 12.8% for AGIs $50k-75k, 15.6% for AGIs $75k-100k, 15.8% for AGIs $100k-200k, 13.6% for AGIs over 200k)
Charity contributions: $2,351 (reported on 27.5% of returns)
Here:
$2,351
State:
$3,948
(% of AGI for various income ranges: 0.7% for AGIs below $25k, 0.6% for AGIs $25k-50k, 1.0% for AGIs $50k-75k, 1.4% for AGIs $75k-100k, 2.0% for AGIs $100k-200k, 2.2% for AGIs over 200k)
Taxes paid: $6,595 (reported on 34.4% of returns)
56329:
$6,595
State:
$10,589
(% of AGI for various income ranges: 2.2% for AGIs below $25k, 2.5% for AGIs $25k-50k, 3.7% for AGIs $50k-75k, 5.6% for AGIs $75k-100k, 6.8% for AGIs $100k-200k, 5.4% for AGIs over 200k)
Earned income credit: $2,036 (reported on 15.6% of returns)
Here:
$2,036
State:
$2,037
(% of AGI for various income ranges: 5.0% for AGIs below $25k, 1.0% for AGIs $25k-50k)
Percentage of individuals using paid preparers for their 2012 taxes: 65.9%
Here:
66%
State:
55%
(% for various income ranges: 56.8% for AGIs below $25k, 65.4% for AGIs $25k-50k, 73.6% for AGIs $50k-75k, 71.1% for AGIs $75k-100k, 79.3% for AGIs $100k-200k, 100.0% for AGIs over 200k)
Averages for the 2004 tax year for zip code 56329, filed in 2005:
Average Adjusted Gross Income (AGI) in 2004: $39,132 (Individual Income Tax Returns)
Here:
$39,132
State:
$53,560
Salary/wage: $37,115 (reported on 87.2% of returns)
Here:
$37,115
State:
$46,177
(% of AGI for various income ranges: 234.2% for AGIs below $10k, 76.5% for AGIs $10k-25k, 86.5% for AGIs $25k-50k, 87.1% for AGIs $50k-75k, 83.5% for AGIs $75k-100k, 61.7% for AGIs over 100k)
Taxable interest for individuals: $1,131 (reported on 50.3% of returns)
This zip code:
$1,131
Minnesota:
$1,796
(% of AGI for various income ranges: 13.9% for AGIs below $10k, 3.3% for AGIs $10k-25k, 1.6% for AGIs $25k-50k, 0.7% for AGIs $50k-75k, 0.5% for AGIs $75k-100k, 1.8% for AGIs over 100k)
Taxable dividends: $1,079 (reported on 17.8% of returns)
Here:
$1,079
State:
$3,096
(% of AGI for various income ranges: 3.6% for AGIs below $10k, 0.9% for AGIs $10k-25k, 0.3% for AGIs $25k-50k, 0.3% for AGIs $50k-75k, 0.2% for AGIs $75k-100k, 0.9% for AGIs over 100k)
Net capital gain/loss: +$7,554 (reported on 17.2% of returns)
Here:
+$7,554
State:
+$10,864
(% of AGI for various income ranges: 9.5% for AGIs below $10k, 2.3% for AGIs $10k-25k, 2.2% for AGIs $25k-50k, 2.1% for AGIs $50k-75k, 2.4% for AGIs $75k-100k, 8.5% for AGIs over 100k)
Profit/loss from business: +$8,724 (reported on 17.2% of returns)
Here:
+$8,724
State:
+$10,442
(% of AGI for various income ranges: 17.9% for AGIs below $10k, 7.1% for AGIs $10k-25k, 4.0% for AGIs $25k-50k, 3.6% for AGIs $50k-75k, 2.2% for AGIs $75k-100k, 3.0% for AGIs over 100k)
IRA payment deduction: $3,292 (reported on 3.1% of returns)
56329:
$3,292
Minnesota:
$2,955
(% of AGI for various income ranges: 0.3% for AGIs $10k-25k, 0.5% for AGIs $25k-50k, 0.2% for AGIs $50k-75k, 0.2% for AGIs $75k-100k)
Self-employed pension: $4,200 (reported on 0.3% of returns)
Here:
$4,200
Minnesota:
$12,099
Total itemized deductions: $15,721 (24% of AGI, reported on 36.5% of returns)
Here:
$15,721
State:
$20,035
Here:
24.2% of AGI
State:
21.3% of AGI
(% of AGI for various income ranges: 23.0% for AGIs below $10k, 9.5% for AGIs $10k-25k, 13.6% for AGIs $25k-50k, 15.9% for AGIs $50k-75k, 17.4% for AGIs $75k-100k, 13.5% for AGIs over 100k)
Charity contributions deductions: $1,679 (2% of AGI, reported on 32.0% of returns)
Here:
$1,679
State:
$3,333
Here:
2.5% of AGI
State:
3.4% of AGI
(% of AGI for various income ranges: 1.1% for AGIs below $10k, 1.1% for AGIs $10k-25k, 1.1% for AGIs $25k-50k, 1.6% for AGIs $50k-75k, 1.6% for AGIs $75k-100k, 1.4% for AGIs over 100k)
Total tax: $4,403 (reported on 76.8% of returns)
56329:
$4,403
State:
$8,485
(% of AGI for various income ranges: 6.8% for AGIs below $10k, 4.9% for AGIs $10k-25k, 6.3% for AGIs $25k-50k, 7.0% for AGIs $50k-75k, 8.7% for AGIs $75k-100k, 17.2% for AGIs over 100k)
Earned income credit: $1,599 (reported on 11.6% of returns)
Here:
$1,599
State:
$1,523
Percentage of individuals using paid preparers for their 2004 taxes: 72.9%
Here:
73%
State:
59%
(% for various income ranges: 62.5% for AGIs below $10k, 71.1% for AGIs $10k-25k, 74.2% for AGIs $25k-50k, 80.2% for AGIs $50k-75k, 76.5% for AGIs $75k-100k, 85.5% for AGIs over 100k)
Likely homosexual households (counted as self-reported same-sex unmarried-partner households)
Lesbian couples: 0.0% of all households
Gay men: 0.1% of all households
Household received Food Stamps/SNAP in the past 12 months: 258 Household did not receive Food Stamps/SNAP in the past 12 months: 2,568
Women who had a birth in the past 12 months: 101 (66 now married, 34 unmarried) Women who did not have a birth in the past 12 months: 1,577 (780 now married, 797 unmarried)
Housing units in zip code 56329 with a mortgage: 1,422 (168 second mortgage, 22 home equity loan, 96 both second mortgage and home equity loan) Houses without a mortgage: 52
Median monthly owner costs for units with a mortgage: $1,526 Median monthly owner costs for units without a mortgage: $607
Residents with income below the poverty level in 2022:
This zip code:
7.8%
Whole state:
9.6%
Residents with income below 50% of the poverty level in 2022:
This zip code:
5.1%
Whole state:
5.2%
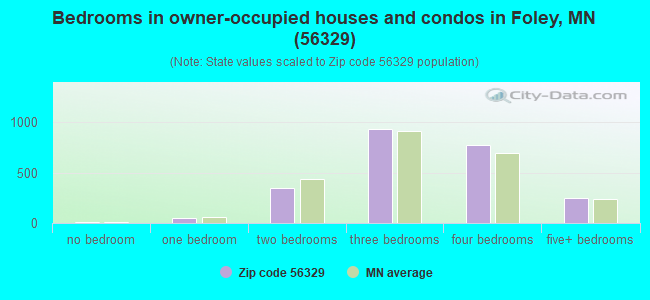
Median number of rooms in houses and condos:
Here:
6.8
State:
7.1
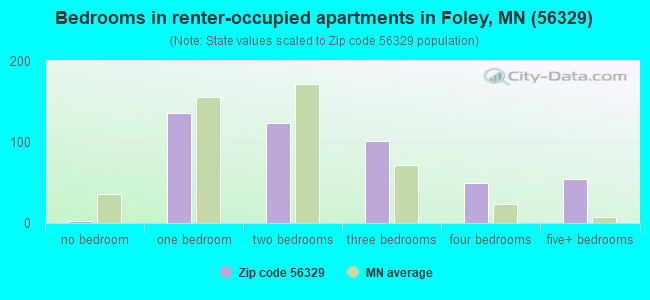
Median number of rooms in apartments:
Here:
4.6
State:
3.8
Notable locations in this zip code not listed on our city pages
Notable locations in zip code 56329: Rum River (A), Stone Creek Golf Club (B), Hanenburg Farms (C), Benton County Courthouse (D), Benton County Sheriffs Office (E), Foley City Hall (F), Foley Community Library (G), Foley Police Department (H), Foley Fire Department (I). Display/hide their locations on the map
Churches in zip code 56329 include: Bethany Church (A), Country Church (B), First Presbyterian Church (C), Maywood Church (D), Saint Lawrence Church - Duelm (E), Saint Pauls Lutheran Church (F), Gustavus Adolphus Lutheran Church (G), Saint John's Church (H), Church of Saint Joseph (I). Display/hide their locations on the map
Cemeteries: Lone Pine Cemetery (1), Riverside Cemetery (2), Polish National Catholic Church Cemetery (3), Saint Elizabeth Cemetery (4), Saint Peter and Paul Parish Cemetery (5), Saint Francis Cemetery (6), Saint Johns Cemetery (7). Display/hide their locations on the map
Parks in zip code 56329 include: Benton County Takes Shape Historical Marker (1), Benlacs State Wildlife Management Area (2), Bibles State Wildlife Management Area (3). Display/hide their locations on the map
1,590 married couples with children.
536 single-parent households (170 men, 366 women).
96.7% of residents of 56329 zip code speak English at home.
1.7% of residents speak Spanish at home (66% very well, 27% well, 7% not at all).
0.4% of residents speak other Indo-European language at home (90% very well, 10% well).
0.7% of residents speak Asian or Pacific Island language at home (48% very well, 46% well, 6% not at all).
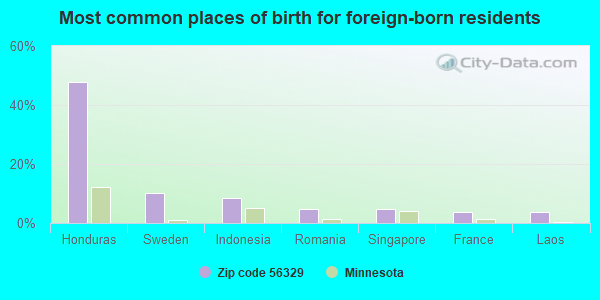
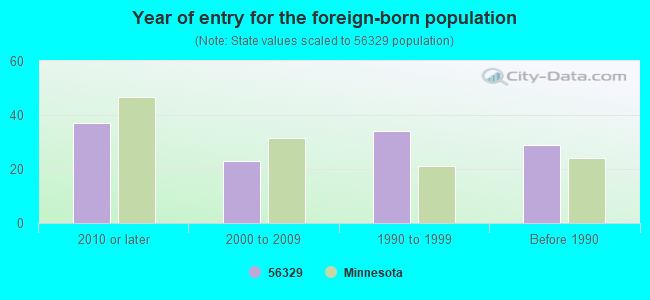
Foreign born population: 105 (1.3%) (28.0% of them are naturalized citizens)
This zip code:
1.3%
Whole state:
8.7%
48%Honduras
10%Sweden
8%Indonesia
5%Romania
5%Singapore
4%France
4%Laos
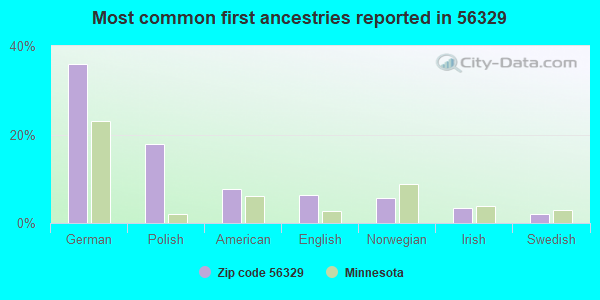
36%German
18%Polish
8%American
6%English
6%Norwegian
3%Irish
2%Swedish
Year of entry for the foreign-born population
372010 or later
232000 to 2009
341990 to 1999
29Before 1990
Major facilities with environmental interests located in this zip code:
FOLEY WWTP (331 OAK DR (BIRCH POND) in FOLEY, MN)
STATE MASTER (Minnesota Pollution Control Agency permits and compilance tracking) - PCS-MN0023451, NPDES NON-MAJOR National Pollutant Discharge Elimination System NON-MAJOR (Tracking pollutant discharge elimination systems) - permit National Pollutant Discharge Elimination System NON-MAJOR (Tracking pollutant discharge elimination systems) - permit COMMUNITY WATER SYSTEM (SDWIS) - SDWIS-MN1050001 3, WATER TREATMENT PLANT, SDWIS-MN1050001 4, Business SIC classification: SEWERAGE SYSTEMS Organizations: FOLEY CITY OF (CONTACT/OWNER)
GORECKI MANUFACTURING INCORPORATED (51 2ND AVENUE WEST in FOLEY, MN)
STATE MASTER (Minnesota Pollution Control Agency permits and compilance tracking) - RCRAINFO-MND985708817, SQG, RCRIS-MND985708817, CESQG CRITERIA AND HAZARDOUS AIR POLLUTANT INVENTORY (Inventory of air pollution sources) Conditionally Exempt Small Quantity Generators, less than 100 kg/month of hazardous waste (Resource Conservation and Recovery Act (tracking hazardous waste)) - notification TRANSPORTER (Resource Conservation and Recovery Act (tracking hazardous waste)) - notification TRI REPORTER (Tracking of toxic chemicals releasing facilities) Business SIC classification: COMMUNICATIONS EQUIPMENT; CHEMICALS AND ALLIED PRODUCTS Business NAICS classification: OTHER COMMUNICATIONS EQUIPMENT MANUFACTURING. Organizations: GORECKI BENEDICT F (CONTACT/OWNER)
, GORFOL MANUFACTURING (CONTACT/OWNER)
Alternative names: GORFOL MANUFACTURING
MIDSTATE CUSTOM CABINETRY (30 2ND AVE W in FOLEY, MN)
STATE MASTER (Minnesota Pollution Control Agency permits and compilance tracking) - RCRAINFO-MNR000000745, CESQG, RCRIS-MNR000000745, (Resource Conservation and Recovery Act (tracking hazardous waste)) Business SIC classification: FURNITURE STORES Organizations: DEMARAIS RANDY (CONTACT/OWNER)
OBRIEN STEVEN W DDS (341 DEWEY ST in FOLEY, MN)
STATE MASTER (Minnesota Pollution Control Agency permits and compilance tracking) - RCRAINFO-MND985754951, CESQG, RCRIS-MND985754951, Conditionally Exempt Small Quantity Generators, less than 100 kg/month of hazardous waste (Resource Conservation and Recovery Act (tracking hazardous waste)) - notification TRANSPORTER (Resource Conservation and Recovery Act (tracking hazardous waste)) - notification Business SIC classification: OFFICES AND CLINICS OF CHIROPRACTORS Organizations: O BRIEN STEVEN W DDS (CONTACT/OWNER)
PERFORMANCE UNLIMITED (6794 HWY 25 NE in FOLEY, MN)
STATE MASTER (Minnesota Pollution Control Agency permits and compilance tracking) - RCRAINFO-MND981532187, CESQG, RCRIS-MND981532187, Conditionally Exempt Small Quantity Generators, less than 100 kg/month of hazardous waste (Resource Conservation and Recovery Act (tracking hazardous waste)) - notification Business SIC classification: AUTO AND HOME SUPPLY STORES Business NAICS classification: AUTOMOTIVE PARTS AND ACCESSORIES STORES. Organizations: STRAIT KARL AND CHARLES (CONTACT/OWNER)
EILERS FABRICATING (210 BRONDER DR in FOLEY, MN)
STATE MASTER (Minnesota Pollution Control Agency permits and compilance tracking) - RCRAINFO-MND982606907, HAZARDOUS WASTE PROGRAM, RCRIS-MND982606907, Small Quantity Generators, between 100 kg and 1000 kg of hazardous waste/month (Resource Conservation and Recovery Act (tracking hazardous waste)) - notification Organizations: STATE BANK OF FOLEY (CONTACT/OWNER)
FOLEY DRUG CO LLC (351 DEWEY ST in FOLEY, MN)
STATE MASTER (Minnesota Pollution Control Agency permits and compilance tracking) - RCRIS-MNR000119412, CESQG Conditionally Exempt Small Quantity Generators, less than 100 kg/month of hazardous waste (Resource Conservation and Recovery Act (tracking hazardous waste)) Business SIC classification: DRUG STORES AND PROPRIETARY STORES Business NAICS classification: PHARMACIES AND DRUG STORES.
BENTON COUNTY HIGHWAY DEPARTMENT (321 NORTH 6TH AVENUE in FOLEY, MN)
STATE MASTER (Minnesota Pollution Control Agency permits and compilance tracking) - RCRAINFO-MN0000242966, CESQG, RCRIS-MN0000242966, Conditionally Exempt Small Quantity Generators, less than 100 kg/month of hazardous waste (Resource Conservation and Recovery Act (tracking hazardous waste)) - notification Business SIC and NAICS classification: REGULATION AND ADMINISTRATION OF TRANSPORTATION PROGRAMS Organizations: BENTON CO HWY DEPT (CONTACT/OWNER)
, BENTON COUNTY OF (CONTACT/OWNER)
Alternative names: BENTON CO HWY DEPT
BLOW MOLDED SPECIALTIES INC (222 BRONDER DR in FOLEY, MN)
STATE MASTER (Minnesota Pollution Control Agency permits and compilance tracking) - RCRIS-MNR000112656, CESQG Conditionally Exempt Small Quantity Generators, less than 100 kg/month of hazardous waste (Resource Conservation and Recovery Act (tracking hazardous waste)) - notification Business SIC classification: PLASTICS PRODUCTS Business NAICS classification: ALL OTHER PLASTICS PRODUCT MANUFACTURING. Organizations: UPPER MIDWEST INDUSTRIES, INC (CONTACT/OWNER)
, UPPER MIDWEST INDUSTRIES INC (CONTACT/OWNER)
Alternative names: BLOW MOLDER SPECIALTIES INC, BLOW MOLDER SPECIALTIES INC
MID MINNESOTA EQUINE SERVICES (600 DEWEY ST in FOLEY, MN)
STATE MASTER (Minnesota Pollution Control Agency permits and compilance tracking) - RCRAINFO-MNR000062927, HAZARDOUS WASTE PROGRAM, RCRIS-MNR000062927, Conditionally Exempt Small Quantity Generators, less than 100 kg/month of hazardous waste (Resource Conservation and Recovery Act (tracking hazardous waste)) - notification Organizations: ZACK JONATHAN T (CONTACT/OWNER)
MNDOT FOLEY (531 NORMAN AVE in FOLEY, MN)
STATE MASTER (Minnesota Pollution Control Agency permits and compilance tracking) - RCRAINFO-MND985750512, HAZARDOUS WASTE PROGRAM, RCRIS-MND985750512, Conditionally Exempt Small Quantity Generators, less than 100 kg/month of hazardous waste (Resource Conservation and Recovery Act (tracking hazardous waste)) - notification Business SIC and NAICS classification: REGULATION AND ADMINISTRATION OF TRANSPORTATION PROGRAMS Organizations: MN STATE OF (CONTACT/OWNER)
, MNDOT CENTRAL OFFICE (CONTACT/OWNER)
Alternative names: MNDOT DISTRICT 3B FOLEY
MURPHY CHEVROLET (211 GLEN ST in FOLEY, MN)
STATE MASTER (Minnesota Pollution Control Agency permits and compilance tracking) - RCRAINFO-MNR000028597, CESQG, RCRIS-MNR000028597, HAZARDOUS WASTE PROGRAM Conditionally Exempt Small Quantity Generators, less than 100 kg/month of hazardous waste (Resource Conservation and Recovery Act (tracking hazardous waste)) - notification Business SIC classification: MOTOR VEHICLE DEALERS (NEW AND USED) Business NAICS classification: NEW CAR DEALERS. Organizations: MURPHY DENNY (CONTACT/OWNER)
Alternative names: MURPHY CHEVROLET - FOLEY
CENTRAL MN ALC - FOLEY (621 PENN ST. in FOLEY, MN)
(National Center for Education Statistics) - STATE ID-506074651 Organizations: CENTRAL MINNESOTA JOINT POWERS DIST (SCHOOL DISTRICT)
Housing units lacking complete plumbing facilities: 2.0% Housing units lacking complete kitchen facilities: 1.4%
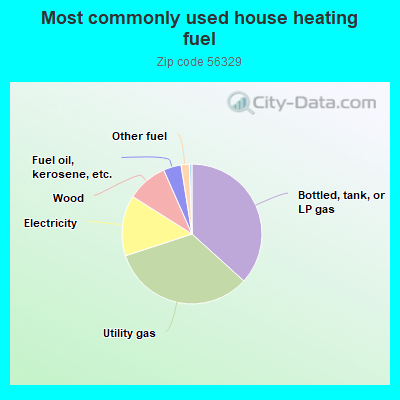
36.7%Bottled, tank, or LP gas
33.2%Utility gas
14.0%Electricity
9.4%Wood
4.1%Fuel oil, kerosene, etc.
1.9%Other fuel
0.6%No fuel used
Population in 1990: 4,078. Population change in the 1990s: +2,235 (+54.8%).
Place of birth for U.S.-born residents:
This state: 6,851
Northeast: 75
Midwest: 397
South: 143
West: 277
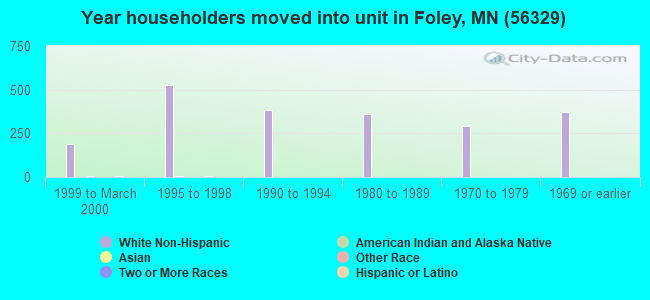
70% of the 56329 zip code residents lived in the same house 5 years ago. Out of people who lived in different houses, 51% lived in this county. Out of people who lived in different counties, 50% lived in Minnesota.
92% of the 56329 zip code residents lived in the same house 1 year ago. Out of people who lived in different houses, 42% moved from this county. Out of people who lived in different houses, 47% moved from different county within same state. Out of people who lived in different houses, 11% moved from different state. Out of people who lived in different houses, 1% moved from abroad.
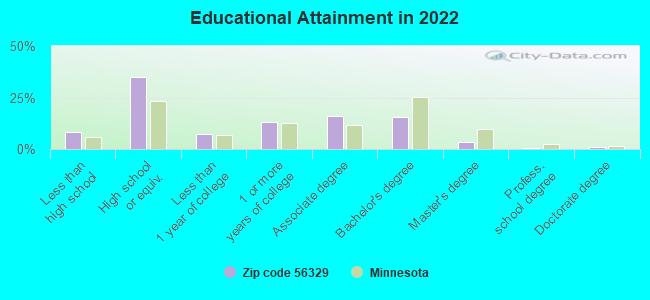
Private vs. public school enrollment:
Students in private schools in grades 1 to 8 (elementary and middle school): 96
Here:
10.2%
Minnesota:
12.9%
Students in private schools in grades 9 to 12 (high school): 9
Here:
2.1%
Minnesota:
8.6%
Students in private undergraduate colleges: 43
Here:
21.0%
Minnesota:
26.2%
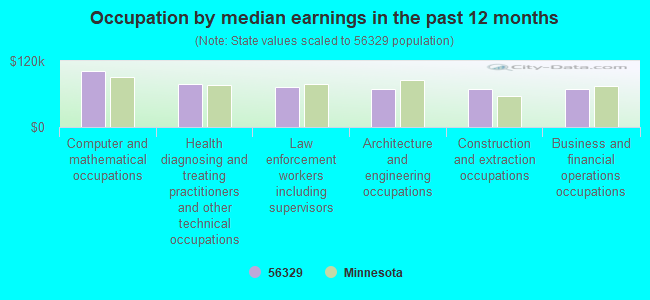
Occupation by median earnings in the past 12 months ($)
101,926Computer and mathematical occupations
78,057Health diagnosing and treating practitioners and other technical occupations
71,870Law enforcement workers including supervisors
69,994Architecture and engineering occupations
69,993Construction and extraction occupations
69,884Business and financial operations occupations
Top industries in this zip code by the number of employees in 2005:
Health Care and Social Assistance: Nursing Care Facilities (100-249 employees: 1 establishment)
Accommodation and Food Services: Limited-Service Restaurants (50-99: 1, 20-49: 1)
Other Services (except Public Administration): Religious Organizations (10-19: 2, 5-9: 3, 1-4: 2)
Finance and Insurance: Commercial Banking (20-49: 1, 10-19: 1)
Accommodation and Food Services: Caterers (20-49: 1)
People in group quarters in 2010:
82 people in nursing facilities/skilled-nursing facilities
58 people in local jails and other municipal confinement facilities
7 people in group homes intended for adults
People in group quarters in 2000:
121 people in nursing homes
70 people in local jails and other confinement facilities (including police lockups)
Fatal accident statistics in 2013:
Fatal accident count: 2
Vehicles involved in fatal accidents: 3
Fatal accidents caused by drunken drivers: 1
Fatalities: 2
Persons involved in fatal accidents: 3
Pedestrians involved in fatal accidents: 0
Fatal accident statistics in 2012:
Fatal accident count: 2
Vehicles involved in fatal accidents: 3
Fatal accidents caused by drunken drivers: 0
Fatalities: 3
Persons involved in fatal accidents: 3
Pedestrians involved in fatal accidents: 0
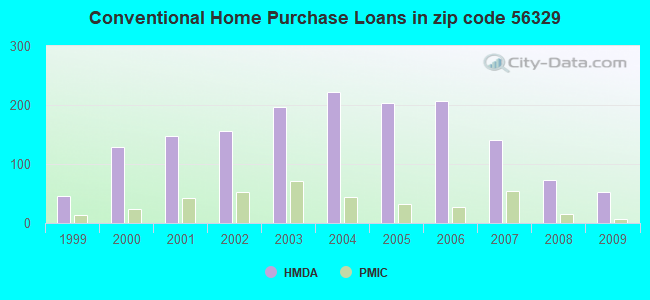
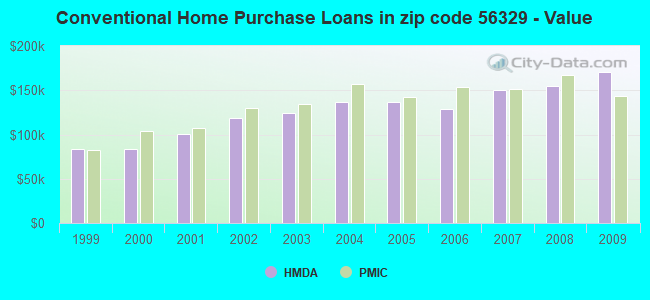
Home Mortgage Disclosure Act Aggregated Statistics For Year 2009 (Based on 6 partial tracts)
A) FHA, FSA/RHS & VA Home Purchase Loans
B) Conventional Home Purchase Loans
C) Refinancings
D) Home Improvement Loans
F) Non-occupant Loans on < 5 Family Dwellings (A B C & D)
G) Loans On Manufactured Home Dwelling (A B C & D)
Number
Average Value
Number
Average Value
Number
Average Value
Number
Average Value
Number
Average Value
Number
Average Value
LOANS ORIGINATED
55
$130,809
52
$170,076
272
$163,274
21
$49,466
20
$139,878
10
$68,805
APPLICATIONS APPROVED, NOT ACCEPTED
1
$81,720
6
$130,322
11
$167,673
3
$34,200
3
$112,100
3
$43,240
APPLICATIONS DENIED
6
$107,392
14
$160,078
98
$175,282
13
$24,981
2
$131,530
4
$85,798
APPLICATIONS WITHDRAWN
2
$147,500
6
$241,332
54
$182,983
2
$102,080
2
$158,810
1
$132,310
FILES CLOSED FOR INCOMPLETENESS
1
$110,260
0
$0
9
$208,110
1
$12,960
0
$0
0
$0
Aggregated Statistics For Year 2008 (Based on 6 partial tracts)
A) FHA, FSA/RHS & VA Home Purchase Loans
B) Conventional Home Purchase Loans
C) Refinancings
D) Home Improvement Loans
E) Loans on Dwellings For 5+ Families
F) Non-occupant Loans on < 5 Family Dwellings (A B C & D)
G) Loans On Manufactured Home Dwelling (A B C & D)
Number
Average Value
Number
Average Value
Number
Average Value
Number
Average Value
Number
Average Value
Number
Average Value
Number
Average Value
LOANS ORIGINATED
41
$150,063
73
$154,421
192
$161,604
32
$52,237
1
$317,810
28
$129,090
17
$97,079
APPLICATIONS APPROVED, NOT ACCEPTED
2
$82,685
9
$178,072
23
$200,955
1
$11,480
0
$0
1
$862,640
0
$0
APPLICATIONS DENIED
12
$130,801
20
$182,106
113
$158,066
17
$68,726
0
$0
2
$102,875
5
$97,526
APPLICATIONS WITHDRAWN
1
$169,930
10
$130,666
39
$173,413
2
$105,840
0
$0
2
$106,010
0
$0
FILES CLOSED FOR INCOMPLETENESS
1
$183,130
1
$168,640
12
$122,587
1
$129,200
0
$0
1
$168,640
0
$0
Aggregated Statistics For Year 2007 (Based on 6 partial tracts)
A) FHA, FSA/RHS & VA Home Purchase Loans
B) Conventional Home Purchase Loans
C) Refinancings
D) Home Improvement Loans
E) Loans on Dwellings For 5+ Families
F) Non-occupant Loans on < 5 Family Dwellings (A B C & D)
G) Loans On Manufactured Home Dwelling (A B C & D)
Number
Average Value
Number
Average Value
Number
Average Value
Number
Average Value
Number
Average Value
Number
Average Value
Number
Average Value
LOANS ORIGINATED
12
$148,027
141
$150,150
200
$138,888
42
$66,871
4
$258,142
17
$152,462
21
$67,670
APPLICATIONS APPROVED, NOT ACCEPTED
1
$159,560
16
$123,488
48
$130,100
5
$45,710
0
$0
2
$63,500
3
$54,483
APPLICATIONS DENIED
3
$119,557
53
$108,794
214
$167,538
27
$52,356
0
$0
17
$120,673
17
$91,644
APPLICATIONS WITHDRAWN
4
$120,965
17
$142,948
74
$163,170
4
$103,685
0
$0
5
$195,098
3
$170,587
FILES CLOSED FOR INCOMPLETENESS
0
$0
14
$176,733
21
$146,619
0
$0
0
$0
1
$99,880
0
$0
Aggregated Statistics For Year 2006 (Based on 6 partial tracts)
A) FHA, FSA/RHS & VA Home Purchase Loans
B) Conventional Home Purchase Loans
C) Refinancings
D) Home Improvement Loans
F) Non-occupant Loans on < 5 Family Dwellings (A B C & D)
G) Loans On Manufactured Home Dwelling (A B C & D)
Number
Average Value
Number
Average Value
Number
Average Value
Number
Average Value
Number
Average Value
Number
Average Value
LOANS ORIGINATED
18
$136,236
207
$128,480
233
$137,296
57
$68,968
38
$115,899
18
$96,804
APPLICATIONS APPROVED, NOT ACCEPTED
0
$0
27
$118,502
50
$143,155
5
$87,524
6
$139,947
1
$111,790
APPLICATIONS DENIED
1
$97,610
42
$122,197
179
$144,570
25
$85,024
15
$122,982
9
$89,078
APPLICATIONS WITHDRAWN
1
$246,480
22
$96,727
92
$163,879
6
$79,930
1
$39,730
4
$92,532
FILES CLOSED FOR INCOMPLETENESS
0
$0
10
$157,819
28
$168,003
0
$0
0
$0
1
$72,920
Aggregated Statistics For Year 2005 (Based on 6 partial tracts)
A) FHA, FSA/RHS & VA Home Purchase Loans
B) Conventional Home Purchase Loans
C) Refinancings
D) Home Improvement Loans
F) Non-occupant Loans on < 5 Family Dwellings (A B C & D)
G) Loans On Manufactured Home Dwelling (A B C & D)
Number
Average Value
Number
Average Value
Number
Average Value
Number
Average Value
Number
Average Value
Number
Average Value
LOANS ORIGINATED
21
$150,962
203
$136,426
351
$137,157
36
$42,031
20
$107,223
18
$97,354
APPLICATIONS APPROVED, NOT ACCEPTED
1
$214,040
14
$141,324
53
$132,937
1
$57,420
3
$116,747
4
$95,982
APPLICATIONS DENIED
0
$0
37
$153,565
219
$142,079
21
$64,623
3
$174,430
14
$95,627
APPLICATIONS WITHDRAWN
2
$117,910
19
$142,654
143
$155,454
14
$50,584
6
$163,097
5
$142,894
FILES CLOSED FOR INCOMPLETENESS
0
$0
4
$175,628
62
$157,500
0
$0
0
$0
1
$34,450
Aggregated Statistics For Year 2004 (Based on 6 partial tracts)
A) FHA, FSA/RHS & VA Home Purchase Loans
B) Conventional Home Purchase Loans
C) Refinancings
D) Home Improvement Loans
F) Non-occupant Loans on < 5 Family Dwellings (A B C & D)
G) Loans On Manufactured Home Dwelling (A B C & D)
Number
Average Value
Number
Average Value
Number
Average Value
Number
Average Value
Number
Average Value
Number
Average Value
LOANS ORIGINATED
15
$126,946
222
$136,236
292
$131,767
33
$53,478
29
$133,276
3
$165,473
APPLICATIONS APPROVED, NOT ACCEPTED
1
$172,530
14
$117,752
46
$132,326
6
$84,747
3
$112,007
1
$79,130
APPLICATIONS DENIED
3
$85,113
41
$118,366
183
$135,434
22
$36,194
6
$118,478
24
$101,892
APPLICATIONS WITHDRAWN
1
$173,820
19
$158,884
109
$147,880
4
$47,872
1
$121,940
6
$148,745
FILES CLOSED FOR INCOMPLETENESS
0
$0
6
$104,920
60
$145,807
1
$2,870
0
$0
4
$91,705
Aggregated Statistics For Year 2003 (Based on 6 partial tracts)
A) FHA, FSA/RHS & VA Home Purchase Loans
B) Conventional Home Purchase Loans
C) Refinancings
D) Home Improvement Loans
E) Loans on Dwellings For 5+ Families
F) Non-occupant Loans on < 5 Family Dwellings (A B C & D)
Number
Average Value
Number
Average Value
Number
Average Value
Number
Average Value
Number
Average Value
Number
Average Value
LOANS ORIGINATED
36
$132,464
197
$124,438
617
$120,808
34
$39,819
1
$2,021,040
17
$109,968
APPLICATIONS APPROVED, NOT ACCEPTED
3
$109,830
30
$132,205
64
$114,893
6
$17,727
0
$0
5
$181,402
APPLICATIONS DENIED
2
$168,535
36
$89,543
236
$125,484
11
$30,733
0
$0
5
$78,522
APPLICATIONS WITHDRAWN
0
$0
19
$120,471
112
$129,868
1
$22,050
1
$2,594,400
0
$0
FILES CLOSED FOR INCOMPLETENESS
1
$223,120
6
$108,332
23
$107,595
0
$0
0
$0
0
$0
Aggregated Statistics For Year 2002 (Based on 6 partial tracts)
A) FHA, FSA/RHS & VA Home Purchase Loans
B) Conventional Home Purchase Loans
C) Refinancings
D) Home Improvement Loans
E) Loans on Dwellings For 5+ Families
F) Non-occupant Loans on < 5 Family Dwellings (A B C & D)
Number
Average Value
Number
Average Value
Number
Average Value
Number
Average Value
Number
Average Value
Number
Average Value
LOANS ORIGINATED
29
$111,200
156
$118,720
428
$109,802
28
$19,121
1
$394,350
9
$112,226
APPLICATIONS APPROVED, NOT ACCEPTED
3
$108,977
11
$84,534
59
$104,545
1
$12,970
0
$0
0
$0
APPLICATIONS DENIED
2
$108,265
32
$91,589
158
$97,482
12
$29,088
0
$0
2
$102,385
APPLICATIONS WITHDRAWN
2
$101,460
18
$133,215
75
$121,067
1
$32,430
0
$0
1
$134,910
FILES CLOSED FOR INCOMPLETENESS
0
$0
4
$120,725
62
$119,630
0
$0
0
$0
2
$61,695
Aggregated Statistics For Year 2001 (Based on 6 partial tracts)
A) FHA, FSA/RHS & VA Home Purchase Loans
B) Conventional Home Purchase Loans
C) Refinancings
D) Home Improvement Loans
E) Loans on Dwellings For 5+ Families
F) Non-occupant Loans on < 5 Family Dwellings (A B C & D)
Number
Average Value
Number
Average Value
Number
Average Value
Number
Average Value
Number
Average Value
Number
Average Value
LOANS ORIGINATED
21
$124,445
148
$101,104
383
$93,896
54
$20,987
6
$1,363,100
13
$68,675
APPLICATIONS APPROVED, NOT ACCEPTED
1
$64,310
14
$80,242
38
$92,719
9
$20,291
0
$0
0
$0
APPLICATIONS DENIED
1
$145,290
26
$90,238
144
$86,931
23
$23,311
0
$0
3
$45,403
APPLICATIONS WITHDRAWN
0
$0
8
$107,664
70
$91,467
0
$0
0
$0
3
$102,173
FILES CLOSED FOR INCOMPLETENESS
0
$0
2
$75,440
32
$120,858
0
$0
0
$0
0
$0
Aggregated Statistics For Year 2000 (Based on 6 partial tracts)
A) FHA, FSA/RHS & VA Home Purchase Loans
B) Conventional Home Purchase Loans
C) Refinancings
D) Home Improvement Loans
E) Loans on Dwellings For 5+ Families
F) Non-occupant Loans on < 5 Family Dwellings (A B C & D)
Number
Average Value
Number
Average Value
Number
Average Value
Number
Average Value
Number
Average Value
Number
Average Value
LOANS ORIGINATED
34
$90,600
129
$83,605
130
$72,045
57
$24,390
2
$557,670
10
$43,044
APPLICATIONS APPROVED, NOT ACCEPTED
0
$0
23
$51,755
36
$70,021
6
$19,427
0
$0
0
$0
APPLICATIONS DENIED
2
$104,800
38
$46,850
105
$61,106
21
$15,976
0
$0
0
$0
APPLICATIONS WITHDRAWN
0
$0
9
$86,647
46
$73,180
2
$4,815
0
$0
1
$9,080
FILES CLOSED FOR INCOMPLETENESS
1
$57,420
3
$74,670
23
$92,595
0
$0
0
$0
1
$19,460
Aggregated Statistics For Year 1999 (Based on 3 partial tracts)
A) FHA, FSA/RHS & VA Home Purchase Loans
B) Conventional Home Purchase Loans
C) Refinancings
D) Home Improvement Loans
F) Non-occupant Loans on < 5 Family Dwellings (A B C & D)
2002 - 2018 National Fire Incident Reporting System (NFIRS) incidents
Based on the data from the years 2002 - 2018 the average number of fires per year is 48. The highest number of reported fires - 65 took place in 2006, and the least - 24 in 2013. The data has a growing trend.
When looking into fire subcategories, the most reports belonged to: Outside Fires (49.4%), and Structure Fires (37.3%).
Fire incident types reported to NFIRS in Zip Code 56329


 Nearest zip codes: 56357, 56330, 56379, 56304, 55319, 56363.


 Based on the data from the years 2002 - 2018 the average number of fires per year is 48. The highest number of reported fires - 65 took place in 2006, and the least - 24 in 2013. The data has a growing trend.
 When looking into fire subcategories, the most reports belonged to: Outside Fires (49.4%), and Structure Fires (37.3%).