Estimated zip code population in 2022: 17,317 Zip code population in 2010: 16,163 Zip code population in 2000: 12,696
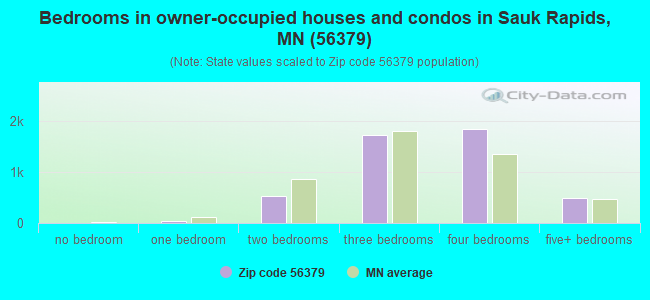
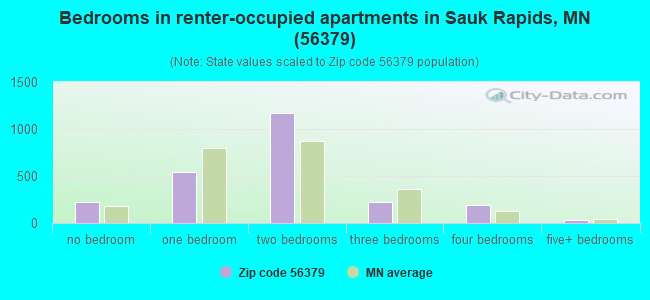
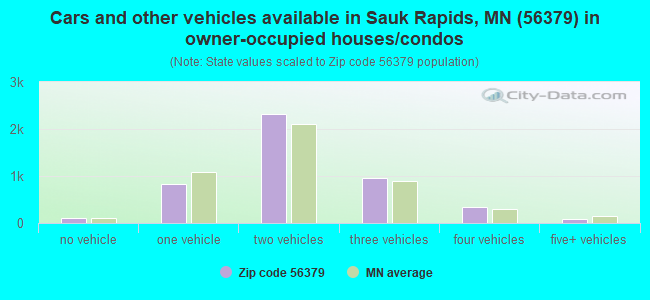
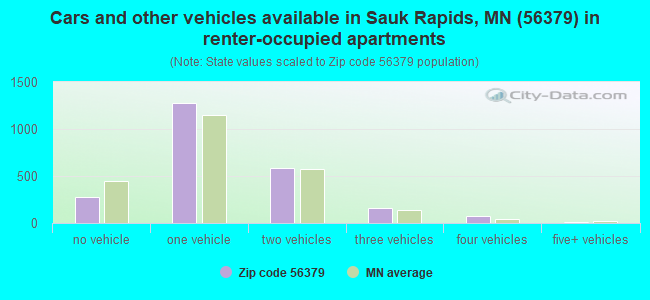
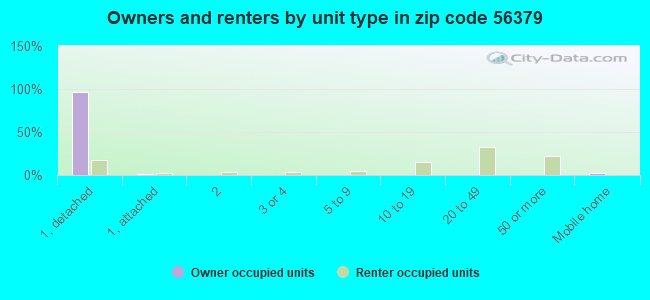
Houses and condos: 7,275 Renter-occupied apartments: 2,374
% of renters here:
34%
State:
28%
March 2022 cost of living index in zip code 56379: 99.7 (near average, U.S. average is 100)
Land area: 90.5 sq. mi. Water area: 1.0 sq. mi.
Population density: 191 people per square mile
(very low).
OSM Map
General Map
Google Map
MSN Map
OSM Map
General Map
Google Map
MSN Map
OSM Map
General Map
Google Map
MSN Map
OSM Map
General Map
Google Map
MSN Map
Please wait while loading the map...
Real estate property taxes paid for housing units in 2022:
This zip code:
1.0% ($2,665)
Minnesota:
1.0% ($3,087)
Median real estate property taxes paid for housing units with mortgages in 2022: $2,683 (1.0%) Median real estate property taxes paid for housing units with no mortgage in 2022: $2,621 (1.0%)
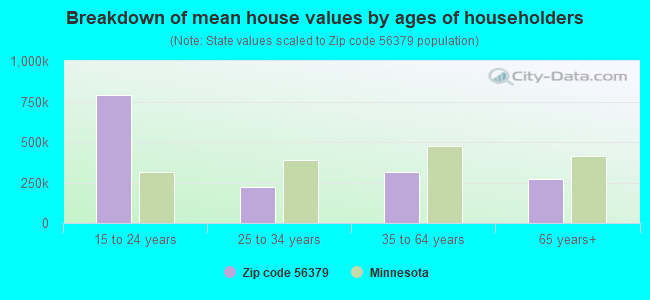
Estimated median house/condo value in 2022: $260,850
56379:
$260,850
Minnesota:
$314,600
According to our research of Minnesota and other state lists, there was 1 registered sex offender living in 56379 zip code as of April 27, 2024. The ratio of all residents to sex offenders in zip code 56379 is 17,251 to 1. The ratio of registered sex offenders to all residents in this zip code is lower than the state average.
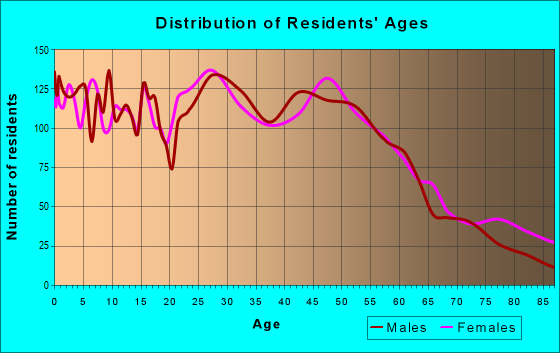
Median resident age:
This zip code:
36.6 years
Minnesota median age:
39.0 years
Average household size:
This zip code:
2.4 people
Minnesota:
2.4 people
Averages for the 2020 tax year for zip code 56379, filed in 2021:
Average Adjusted Gross Income (AGI) in 2020: $64,555 (Individual Income Tax Returns)
Here:
$64,555
State:
$82,178
Salary/wage: $56,187 (reported on 86.1% of returns)
Here:
$56,187
State:
$67,438
(% of AGI for various income ranges: 1280.6% for AGIs below $25k, 3852.2% for AGIs $25k-50k, 6751.2% for AGIs $50k-75k, 10096.0% for AGIs $75k-100k, 19091.0% for AGIs $100k-200k, 71225.7% for AGIs over 200k)
Taxable interest for individuals: $1,342 (reported on 29.4% of returns)
This zip code:
$1,342
Minnesota:
$1,814
(% of AGI for various income ranges: 17.9% for AGIs below $25k, 19.5% for AGIs $25k-50k, 36.1% for AGIs $50k-75k, 44.0% for AGIs $75k-100k, 119.2% for AGIs $100k-200k, 1751.4% for AGIs over 200k)
Ordinary dividends: $4,401 (reported on 17.0% of returns)
Here:
$4,401
State:
$6,928
(% of AGI for various income ranges: 21.6% for AGIs below $25k, 22.8% for AGIs $25k-50k, 59.9% for AGIs $50k-75k, 84.0% for AGIs $75k-100k, 194.6% for AGIs $100k-200k, 4457.1% for AGIs over 200k)
Net capital gain/loss in AGI: +$11,357 (reported on 15.5% of returns)
Here:
+$11,357
State:
+$20,591
(% of AGI for various income ranges: 17.3% for AGIs below $25k, 26.4% for AGIs $25k-50k, 91.9% for AGIs $50k-75k, 86.2% for AGIs $75k-100k, 449.1% for AGIs $100k-200k, 13821.4% for AGIs over 200k)
Profit/loss from business: +$13,489 (reported on 11.7% of returns)
Here:
+$13,489
State:
+$14,342
(% of AGI for various income ranges: 68.7% for AGIs below $25k, 88.1% for AGIs $25k-50k, 219.9% for AGIs $50k-75k, 212.3% for AGIs $75k-100k, 683.2% for AGIs $100k-200k, 2994.3% for AGIs over 200k)
Taxable individual retirement arrangement distribution: $15,701 (reported on 9.0% of returns)
56379:
$15,701
Minnesota:
$20,675
(% of AGI for various income ranges: 77.3% for AGIs below $25k, 96.1% for AGIs $25k-50k, 210.3% for AGIs $50k-75k, 313.8% for AGIs $75k-100k, 521.2% for AGIs $100k-200k, 1672.9% for AGIs over 200k)
Self-employed (Keogh) retirement plans: $19,950 (reported on 0.2% of returns)
56379:
$19,950
Minnesota:
$23,059
(% of AGI for various income ranges: 51.2% for AGIs $100k-200k)
Total itemized deductions: $31,510 (reported on 4.7% of returns)
Here:
$31,510
State:
$33,311
(% of AGI for various income ranges: 27.9% for AGIs below $25k, 71.7% for AGIs $25k-50k, 196.5% for AGIs $50k-75k, 251.4% for AGIs $75k-100k, 432.3% for AGIs $100k-200k, 5918.6% for AGIs over 200k)
Charity contributions: $11,491 (reported on 3.7% of returns)
Here:
$11,491
State:
$11,879
(% of AGI for various income ranges: 14.9% for AGIs $25k-50k, 28.5% for AGIs $50k-75k, 38.8% for AGIs $75k-100k, 86.3% for AGIs $100k-200k, 3132.9% for AGIs over 200k)
Taxes paid: $7,271 (reported on 4.7% of returns)
56379:
$7,271
State:
$8,252
(% of AGI for various income ranges: 3.4% for AGIs below $25k, 10.3% for AGIs $25k-50k, 51.2% for AGIs $50k-75k, 69.1% for AGIs $75k-100k, 123.7% for AGIs $100k-200k, 1130.0% for AGIs over 200k)
Earned income credit: $1,931 (reported on 11.3% of returns)
Here:
$1,931
State:
$2,055
(% of AGI for various income ranges: 62.7% for AGIs below $25k, 52.5% for AGIs $25k-50k)
Percentage of individuals using paid preparers for their 2020 taxes: 95.2%
Here:
95%
State:
94%
(% for various income ranges: 93.0% for AGIs below $25k, 96.0% for AGIs $25k-50k, 95.3% for AGIs $50k-75k, 96.9% for AGIs $75k-100k, 96.4% for AGIs $100k-200k, 96.2% for AGIs over 200k)
Averages for the 2012 tax year for zip code 56379, filed in 2013:
Average Adjusted Gross Income (AGI) in 2012: $53,476 (Individual Income Tax Returns)
Here:
$53,476
State:
$67,192
Salary/wage: $46,645 (reported on 89.3% of returns)
Here:
$46,645
State:
$55,182
(% of AGI for various income ranges: 80.6% for AGIs below $25k, 83.3% for AGIs $25k-50k, 81.7% for AGIs $50k-75k, 81.0% for AGIs $75k-100k, 82.8% for AGIs $100k-200k, 53.7% for AGIs over 200k)
Taxable interest for individuals: $1,215 (reported on 33.5% of returns)
This zip code:
$1,215
Minnesota:
$1,664
(% of AGI for various income ranges: 1.1% for AGIs below $25k, 0.6% for AGIs $25k-50k, 0.6% for AGIs $50k-75k, 0.6% for AGIs $75k-100k, 0.7% for AGIs $100k-200k, 1.3% for AGIs over 200k)
Ordinary dividends: $3,876 (reported on 17.7% of returns)
Here:
$3,876
State:
$5,665
(% of AGI for various income ranges: 1.0% for AGIs below $25k, 0.7% for AGIs $25k-50k, 0.6% for AGIs $50k-75k, 0.9% for AGIs $75k-100k, 1.1% for AGIs $100k-200k, 3.8% for AGIs over 200k)
Net capital gain/loss in AGI: +$13,350 (reported on 14.3% of returns)
Here:
+$13,350
State:
+$16,131
(% of AGI for various income ranges: 0.6% for AGIs below $25k, 0.6% for AGIs $25k-50k, 0.6% for AGIs $50k-75k, 1.4% for AGIs $75k-100k, 1.6% for AGIs $100k-200k, 18.2% for AGIs over 200k)
Profit/loss from business: +$9,192 (reported on 13.6% of returns)
Here:
+$9,192
State:
+$12,430
(% of AGI for various income ranges: 5.4% for AGIs below $25k, 1.9% for AGIs $25k-50k, 2.7% for AGIs $50k-75k, 2.2% for AGIs $75k-100k, 2.3% for AGIs $100k-200k, 1.0% for AGIs over 200k)
Taxable individual retirement arrangement distribution: $11,187 (reported on 8.9% of returns)
56379:
$11,187
Minnesota:
$15,212
(% of AGI for various income ranges: 2.8% for AGIs below $25k, 2.2% for AGIs $25k-50k, 1.8% for AGIs $50k-75k, 2.1% for AGIs $75k-100k, 2.3% for AGIs $100k-200k)
Self-employment retirement plans: $9,167 (reported on 0.4% of returns)
56379:
$9,167
Minnesota:
$17,874
Total itemized deductions: $20,354 (21% of AGI, reported on 35.1% of returns)
Here:
$20,354
State:
$24,665
Here:
21.0% of AGI
State:
19.6% of AGI
(% of AGI for various income ranges: 6.6% for AGIs below $25k, 9.6% for AGIs $25k-50k, 13.2% for AGIs $50k-75k, 14.9% for AGIs $75k-100k, 15.5% for AGIs $100k-200k, 16.3% for AGIs over 200k)
Charity contributions: $2,776 (reported on 28.3% of returns)
Here:
$2,776
State:
$3,948
(% of AGI for various income ranges: 0.5% for AGIs below $25k, 0.9% for AGIs $25k-50k, 1.3% for AGIs $50k-75k, 1.5% for AGIs $75k-100k, 1.9% for AGIs $100k-200k, 2.1% for AGIs over 200k)
Taxes paid: $8,299 (reported on 34.9% of returns)
56379:
$8,299
State:
$10,589
(% of AGI for various income ranges: 1.3% for AGIs below $25k, 2.5% for AGIs $25k-50k, 4.2% for AGIs $50k-75k, 5.4% for AGIs $75k-100k, 7.2% for AGIs $100k-200k, 9.8% for AGIs over 200k)
Earned income credit: $1,889 (reported on 15.6% of returns)
Here:
$1,889
State:
$2,037
(% of AGI for various income ranges: 4.7% for AGIs below $25k, 0.9% for AGIs $25k-50k)
Percentage of individuals using paid preparers for their 2012 taxes: 56.5%
Here:
57%
State:
55%
(% for various income ranges: 46.7% for AGIs below $25k, 54.7% for AGIs $25k-50k, 64.8% for AGIs $50k-75k, 65.5% for AGIs $75k-100k, 69.6% for AGIs $100k-200k, 83.3% for AGIs over 200k)
Averages for the 2004 tax year for zip code 56379, filed in 2005:
Average Adjusted Gross Income (AGI) in 2004: $44,314 (Individual Income Tax Returns)
Here:
$44,314
State:
$53,560
Salary/wage: $38,995 (reported on 91.0% of returns)
Here:
$38,995
State:
$46,177
(% of AGI for various income ranges: 136.4% for AGIs below $10k, 82.4% for AGIs $10k-25k, 85.6% for AGIs $25k-50k, 87.9% for AGIs $50k-75k, 86.9% for AGIs $75k-100k, 58.9% for AGIs over 100k)
Taxable interest for individuals: $1,285 (reported on 45.4% of returns)
This zip code:
$1,285
Minnesota:
$1,796
(% of AGI for various income ranges: 4.7% for AGIs below $10k, 2.0% for AGIs $10k-25k, 0.9% for AGIs $25k-50k, 0.7% for AGIs $50k-75k, 0.8% for AGIs $75k-100k, 2.2% for AGIs over 100k)
Taxable dividends: $2,131 (reported on 21.3% of returns)
Here:
$2,131
State:
$3,096
(% of AGI for various income ranges: 2.2% for AGIs below $10k, 0.9% for AGIs $10k-25k, 0.5% for AGIs $25k-50k, 0.3% for AGIs $50k-75k, 0.5% for AGIs $75k-100k, 2.5% for AGIs over 100k)
Net capital gain/loss: +$9,180 (reported on 17.2% of returns)
Here:
+$9,180
State:
+$10,864
(% of AGI for various income ranges: 1.2% for AGIs below $10k, 0.6% for AGIs $10k-25k, 0.8% for AGIs $25k-50k, 0.8% for AGIs $50k-75k, 1.2% for AGIs $75k-100k, 11.5% for AGIs over 100k)
Profit/loss from business: +$7,748 (reported on 14.7% of returns)
Here:
+$7,748
State:
+$10,442
(% of AGI for various income ranges: 7.5% for AGIs below $10k, 4.6% for AGIs $10k-25k, 3.0% for AGIs $25k-50k, 2.3% for AGIs $50k-75k, 2.3% for AGIs $75k-100k, 1.7% for AGIs over 100k)
IRA payment deduction: $3,005 (reported on 3.0% of returns)
56379:
$3,005
Minnesota:
$2,955
(% of AGI for various income ranges: 0.3% for AGIs $10k-25k, 0.4% for AGIs $25k-50k, 0.3% for AGIs $50k-75k, 0.1% for AGIs $75k-100k, 0.1% for AGIs over 100k)
Self-employed pension: $8,023 (reported on 0.6% of returns)
Here:
$8,023
Minnesota:
$12,099
(% of AGI for various income ranges: 0.2% for AGIs $10k-25k, 0.2% for AGIs $50k-75k, 0.2% for AGIs over 100k)
Total itemized deductions: $16,393 (22% of AGI, reported on 39.9% of returns)
Here:
$16,393
State:
$20,035
Here:
21.7% of AGI
State:
21.3% of AGI
(% of AGI for various income ranges: 9.7% for AGIs below $10k, 8.2% for AGIs $10k-25k, 13.8% for AGIs $25k-50k, 16.3% for AGIs $50k-75k, 16.7% for AGIs $75k-100k, 15.2% for AGIs over 100k)
Charity contributions deductions: $2,392 (3% of AGI, reported on 35.2% of returns)
Here:
$2,392
State:
$3,333
Here:
3.0% of AGI
State:
3.4% of AGI
(% of AGI for various income ranges: 0.8% for AGIs below $10k, 0.9% for AGIs $10k-25k, 1.2% for AGIs $25k-50k, 1.7% for AGIs $50k-75k, 2.1% for AGIs $75k-100k, 2.9% for AGIs over 100k)
Total tax: $5,545 (reported on 80.2% of returns)
56379:
$5,545
State:
$8,485
(% of AGI for various income ranges: 3.5% for AGIs below $10k, 4.8% for AGIs $10k-25k, 7.0% for AGIs $25k-50k, 7.9% for AGIs $50k-75k, 9.5% for AGIs $75k-100k, 17.3% for AGIs over 100k)
Earned income credit: $1,482 (reported on 11.4% of returns)
Here:
$1,482
State:
$1,523
Percentage of individuals using paid preparers for their 2004 taxes: 62.1%
Here:
62%
State:
59%
(% for various income ranges: 49.4% for AGIs below $10k, 56.1% for AGIs $10k-25k, 65.6% for AGIs $25k-50k, 69.1% for AGIs $50k-75k, 70.3% for AGIs $75k-100k, 74.9% for AGIs over 100k)
Likely homosexual households (counted as self-reported same-sex unmarried-partner households)
Lesbian couples: 0.5% of all households
Gay men: 0.4% of all households
Household received Food Stamps/SNAP in the past 12 months: 349 Household did not receive Food Stamps/SNAP in the past 12 months: 6,636
Women who had a birth in the past 12 months: 135 (117 now married, 19 unmarried) Women who did not have a birth in the past 12 months: 3,996 (1,824 now married, 2,172 unmarried)
Housing units in zip code 56379 with a mortgage: 2,994 (300 second mortgage, 1 home equity loan, 177 both second mortgage and home equity loan) Houses without a mortgage: 42
Median monthly owner costs for units with a mortgage: $1,623 Median monthly owner costs for units without a mortgage: $581
Residents with income below the poverty level in 2022:
This zip code:
7.1%
Whole state:
9.6%
Residents with income below 50% of the poverty level in 2022:
This zip code:
4.4%
Whole state:
5.2%
Median number of rooms in houses and condos:
Here:
7.3
State:
7.1
Median number of rooms in apartments:
Here:
3.5
State:
3.8
Notable locations in this zip code not listed on our city pages
Notable locations in zip code 56379: Wapicada Golf Course (A), Sauk Rapids City Hall (B), Sauk Rapids Police Department (C), Benton County Historical Society (D), Sauk Rapids Fire Department (E). Display/hide their locations on the map
Churches in zip code 56379 include: Saint Johns Church (A), Saint Patricks Church (B), Petra Evangelical Lutheran Church (C), Sacred Heart Church (D), Trinity Lutheran Church (E), Saint John's Lutheran Church (F), Seventh-Day Adventist Church (G), Alliance Church (H), Hope Presbyterian Church (I). Display/hide their locations on the map
Cemeteries: Benton Cemetery (1), Saint Patrick's Cemetery (2), Polish Lutheran Church Cemetery (3), Saint John's Cemetery (4), Pioneer Benton County Cemetery (5), Sacred Heart Cemetery (6), Saint Marys Cemetery (7). Display/hide their locations on the map
Parks in zip code 56379 include: Lions Park (1), Sauk Rapids Municipal Park (2), Prairie Lane Park (3), Oaklane Park (4), Pleasant View Park (5), Scenic View Park (6), Benedict Acres Park (7), Bob Cross Nature Preserve (8), Brookside Park (9). Display/hide their locations on the map
3,227 married couples with children.
1,127 single-parent households (563 men, 564 women).
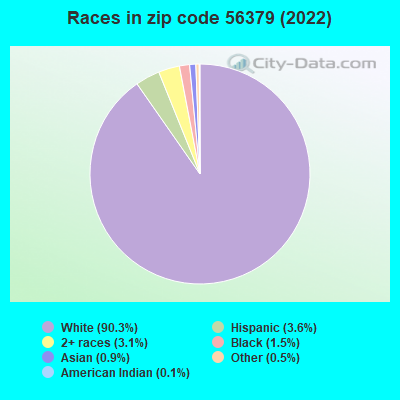
94.3% of residents of 56379 zip code speak English at home.
2.2% of residents speak Spanish at home (52% very well, 45% well, 3% not well).
1.5% of residents speak other Indo-European language at home (93% very well, 7% not well).
0.3% of residents speak Asian or Pacific Island language at home (55% very well, 29% well, 16% not well).
1.4% of residents speak other language at home (90% very well, 10% well).
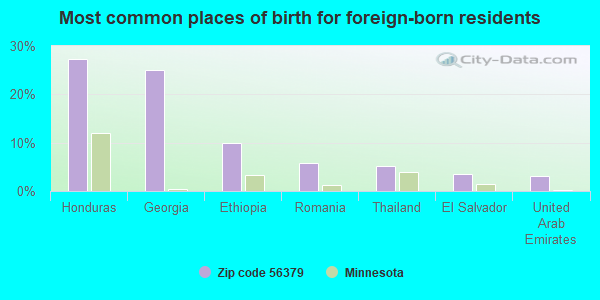
Foreign born population: 724 (4.2%) (64.0% of them are naturalized citizens)
This zip code:
4.2%
Whole state:
8.7%
27%Honduras
25%Georgia
10%Ethiopia
6%Romania
5%Thailand
3%El Salvador
3%United Arab Emirates
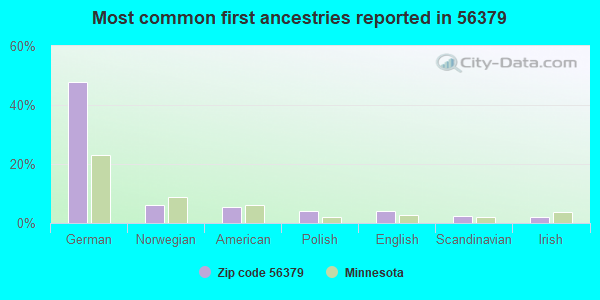
48%German
6%Norwegian
5%American
4%Polish
4%English
2%Scandinavian
2%Irish
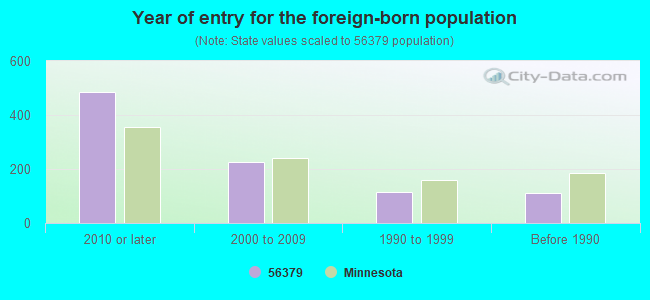
Year of entry for the foreign-born population
4852010 or later
2262000 to 2009
1161990 to 1999
111Before 1990
Major facilities with environmental interests located in this zip code:
AIR SYNTHETIC MINOR (AIRS/AFS) AIR MINOR (AIRS/AFS) STATE MASTER (Minnesota Pollution Control Agency permits and compilance tracking) - AIRS-2700900035, AIR PROGRAM, AIRS-2799000007, AIRS-2799000008, PCS-MNG490003, National Pollutant Discharge Elimination System Permit, RCRAINFO-MND047258306, SQG, AFS-2700900035, AIR SYNTHETIC MINOR, AFS-2799000008, RCRIS-MND047258306, SQG STATE MASTER (Minnesota Pollution Control Agency permits and compilance tracking) - AIRS-2799000270, AIR PROGRAM, AFS-2799000270, AIR SYNTHETIC MINOR CRITERIA AND HAZARDOUS AIR POLLUTANT INVENTORY (Inventory of air pollution sources) National Pollutant Discharge Elimination System NON-MAJOR (Tracking pollutant discharge elimination systems) - permit (Resource Conservation and Recovery Act (tracking hazardous waste)) TRI REPORTER (Tracking of toxic chemicals releasing facilities) Business SIC classification: CRUSHED AND BROKEN LIMESTONE; HIGHWAY AND STREET CONSTRUCTION, EXCEPT ELEVATED HIGHWAYS; ASPHALT PAVING MIXTURES AND BLOCKS Business NAICS classification: CRUSHED AND BROKEN LIMESTONE MINING AND QUARRYING.; CRUSHED AND BROKEN LIMESTONE MINING AND QUARRYING.; HIGHWAY, STREET, AND BRIDGE CONSTRUCTION.; ASPHALT PAVING MIXTURE AND BLOCK MANUFACTURING.; ASPHALT PAVING MIXTURE AND BLOCK MANUFACTURING. Organizations: BAUERLY BROS INC (CONTACT/OWNER)
Alternative names: BAUERLY BROS. INC. PLANTS 1 2 3 4, BAUERLY BROS INC - PLANT 4, BAUERLY BROS INC - PLANT 1
MIDWEST MOTOR SPORTS INC (26 S 1ST ST in SAUK RAPIDS, MN)
STATE MASTER (Minnesota Pollution Control Agency permits and compilance tracking) - RCRIS-MNR000105692, CESQG (Resource Conservation and Recovery Act (tracking hazardous waste)) Business SIC classification: GENERAL AUTOMOTIVE REPAIR SHOPS Business NAICS classification: GENERAL AUTOMOTIVE REPAIR. Organizations: DAN IBURG MIKE HENGEL (CONTACT/OWNER)
CENTRAL TV AND APPLIANCE (5 S BENTON DR in SAUK RAPIDS, MN)
STATE MASTER (Minnesota Pollution Control Agency permits and compilance tracking) - RCRAINFO-HWLIC1002633, HAZARDOUS WASTE PROGRAM, RCRAINFO-MN0000019505, RCRIS-HWLIC1002633, RCRIS-MN0000019505, (Resource Conservation and Recovery Act (tracking hazardous waste)) Business SIC classification: REPAIR SHOPS AND RELATED SERVICES Organizations: LUNDGREN JERRY (CONTACT/OWNER)
, CENTRAL TV & APPLIANCE (CONTACT/OWNER)
BRENNY CUSTOM CABINETS INC (2817 65TH AVE NE in SAUK RAPIDS, MN)
STATE MASTER (Minnesota Pollution Control Agency permits and compilance tracking) - RCRAINFO-MNR000100362, CESQG, RCRIS-MNR000100362, (Resource Conservation and Recovery Act (tracking hazardous waste)) Business SIC classification: WOOD KITCHEN CABINETS Business NAICS classification: WOOD KITCHEN CABINET AND COUNTERTOP MANUFACTURING. Organizations: BRENNY MARK (CONTACT/OWNER)
CENTRAL MN MACK SALES (1040 STEARNS DR in SAUK RAPIDS, MN)
STATE MASTER (Minnesota Pollution Control Agency permits and compilance tracking) - RCRAINFO-MND982618043, SQG, RCRIS-MND982618043, CESQG Conditionally Exempt Small Quantity Generators, less than 100 kg/month of hazardous waste (Resource Conservation and Recovery Act (tracking hazardous waste)) - notification Business SIC classification: MOTOR VEHICLE DEALERS (NEW AND USED) Business NAICS classification: NEW CAR DEALERS. Organizations: MACK TRUCKS OF ROCHESTER (CONTACT/OWNER)
, CENTRAL MINNESOTA MACK SALES (CONTACT/OWNER)
GRILE AUTO AND TRUCK REPAIR INCORPORATED (218 STEARNS DRIVE in SAUK RAPIDS, MN)
STATE MASTER (Minnesota Pollution Control Agency permits and compilance tracking) - RCRAINFO-MND054484217, CESQG, RCRIS-MND054484217, Conditionally Exempt Small Quantity Generators, less than 100 kg/month of hazardous waste (Resource Conservation and Recovery Act (tracking hazardous waste)) Business SIC classification: MOTOR VEHICLE DEALERS (NEW AND USED) Business NAICS classification: NEW CAR DEALERS.; GENERAL AUTOMOTIVE REPAIR. Organizations: GATR OF SAUK RAPIDS INC (CONTACT/OWNER)
GOLDEN SPIKE AUTO SALVAGE (2540 GOLDEN SPIKE RD NE in SAUK RAPIDS, MN)
STATE MASTER (Minnesota Pollution Control Agency permits and compilance tracking) - RCRAINFO-MND982626855, CESQG, PCS-194754693, GENERAL PERMIT STORM WATER IND, NPDES STORMWATER PERMIT, RCRIS-MND982626855, CESQG Small Quantity Generators, between 100 kg and 1000 kg of hazardous waste/month (Resource Conservation and Recovery Act (tracking hazardous waste)) - notification Business SIC classification: MOTOR VEHICLE PARTS, USED Business NAICS classification: AUTOMOTIVE PARTS AND ACCESSORIES STORES. Organizations: PETERSON ARON L (CONTACT/OWNER)
, GOLDEN SPIKE AUTO SALVAGE INC (CONTACT/OWNER)
NATIONAL VISION INCORPORATED (2765 QUAIL ROAD NE in SAUK RAPIDS, MN)
STATE MASTER (Minnesota Pollution Control Agency permits and compilance tracking) - RCRAINFO-MND059033449, CESQG, RCRIS-MND059033449, Small Quantity Generators, between 100 kg and 1000 kg of hazardous waste/month (Resource Conservation and Recovery Act (tracking hazardous waste)) - notification Business SIC and NAICS classification: OPHTHALMIC GOODS Organizations: MIDWEST VISION DIST (CONTACT/OWNER)
FROST JACK INC GOLD N PLUMP (245 INDUSTRIAL BLVD in SAUK RAPIDS, MN)
STATE MASTER (Minnesota Pollution Control Agency permits and compilance tracking) - RCRAINFO-MND985736180, CESQG, RCRIS-MND985736180, Conditionally Exempt Small Quantity Generators, less than 100 kg/month of hazardous waste (Resource Conservation and Recovery Act (tracking hazardous waste)) - notification Business SIC classification: SAUSAGES AND OTHER PREPARED MEAT PRODUCTS Business NAICS classification: MEAT PROCESSED FROM CARCASSES. Organizations: TRAIL S BEST INC (CONTACT/OWNER)
Alternative names: GOLD N PLUMP POULTRY FURTHER PROCESSING, GOLDN PLUMP SAUK RAPIDS
ARNOLD EQUIPMENT (2995 QUAIL RD NE in SAUK RAPIDS, MN)
STATE MASTER (Minnesota Pollution Control Agency permits and compilance tracking) - RCRAINFO-MN0000052548, CESQG, RCRIS-MN0000052548, Small Quantity Generators, between 100 kg and 1000 kg of hazardous waste/month (Resource Conservation and Recovery Act (tracking hazardous waste)) - notification Business SIC classification: REPAIR SHOPS AND RELATED SERVICES Business NAICS classification: COMMERCIAL AND INDUSTRIAL MACHINERY AND EQUIPMENT (EXCEPT AUTOMOTIVE AND ELECTRONIC) REPAIR AND MAINTENANCE. Organizations: ARNOLD S EQUIPMENT (CONTACT/OWNER)
Alternative names: ARNOLDS EQUIPMENT
NEW LOOK REFURBISHING (250 STEARNS DR in SAUK RAPIDS, MN)
STATE MASTER (Minnesota Pollution Control Agency permits and compilance tracking) - RCRAINFO-MNR000034900, CESQG, RCRIS-MNR000034900, HAZARDOUS WASTE PROGRAM Conditionally Exempt Small Quantity Generators, less than 100 kg/month of hazardous waste (Resource Conservation and Recovery Act (tracking hazardous waste)) - notification Business SIC classification: TOP, BODY, AND UPHOLSTERY REPAIR SHOPS AND PAINT SHOPS Business NAICS classification: AUTOMOTIVE BODY, PAINT, AND INTERIOR REPAIR AND MAINTENANCE. Organizations: MERRILL GRILE (CONTACT/OWNER)
, GATR BODY SHOP (CONTACT/OWNER)
NORTHERN NATURAL GAS - POPPLE CR (6220 GOLDEN SPIKE RD NE in SAUK RAPIDS, MN)
STATE MASTER (Minnesota Pollution Control Agency permits and compilance tracking) - RCRIS-MNS000107169, CESQG Conditionally Exempt Small Quantity Generators, less than 100 kg/month of hazardous waste (Resource Conservation and Recovery Act (tracking hazardous waste)) Business SIC classification: NATURAL GAS TRANSMISSION Business NAICS classification: PIPELINE TRANSPORTATION OF NATURAL GAS. Organizations: NORTHERN NATURAL GAS CO (CONTACT/OWNER)
BAUERLY BROTHERS (PLANT 2 BG DM71 in SAUK RAPIDS, MN)
AIR SYNTHETIC MINOR (AIRS/AFS) STATE MASTER (Minnesota Pollution Control Agency permits and compilance tracking) - AIRS-2799000006, AIR PROGRAM, AFS-2799000006, AIR SYNTHETIC MINOR Business SIC classification: ASPHALT PAVING MIXTURES AND BLOCKS Business NAICS classification: ASPHALT PAVING MIXTURE AND BLOCK MANUFACTURING. Organizations: BAUERLY BROS INC (CONTACT/OWNER)
Alternative names: BAUERLY BROS INC - PLANT 2
Housing units lacking complete plumbing facilities: 0.3% Housing units lacking complete kitchen facilities: 1.0%
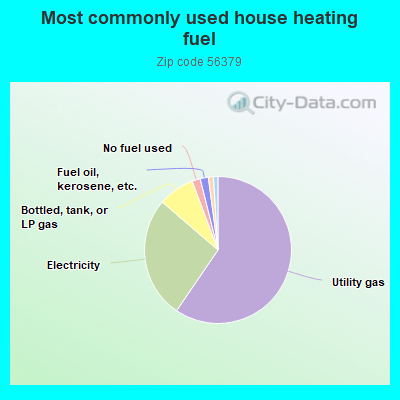
59.6%Utility gas
26.8%Electricity
8.0%Bottled, tank, or LP gas
1.8%No fuel used
1.8%Fuel oil, kerosene, etc.
1.1%Wood
1.0%Other fuel
Population in 1990: 12,505. Population change in the 1990s: +191 (+1.5%).
Place of birth for U.S.-born residents:
This state: 13,876
Northeast: 164
Midwest: 1,470
South: 232
West: 624
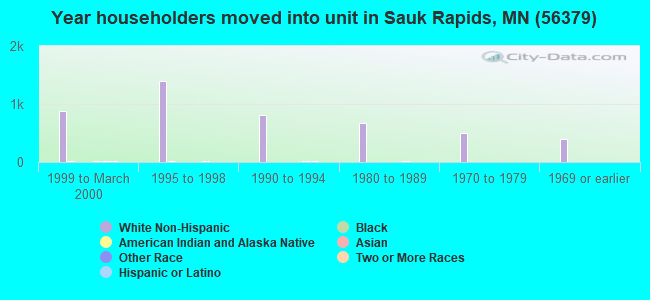
57% of the 56379 zip code residents lived in the same house 5 years ago. Out of people who lived in different houses, 38% lived in this county. Out of people who lived in different counties, 50% lived in Minnesota.
89% of the 56379 zip code residents lived in the same house 1 year ago. Out of people who lived in different houses, 27% moved from this county. Out of people who lived in different houses, 58% moved from different county within same state. Out of people who lived in different houses, 16% moved from different state. Out of people who lived in different houses, 1% moved from abroad.
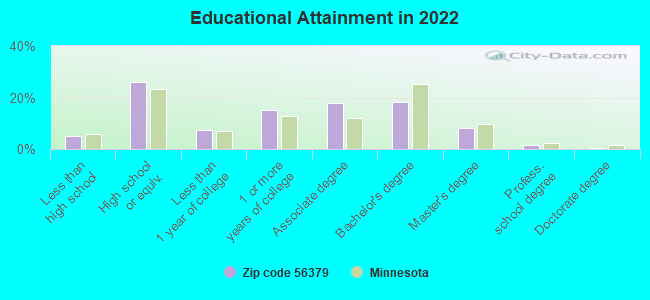
Private vs. public school enrollment:
Students in private schools in grades 1 to 8 (elementary and middle school): 193
Here:
8.9%
Minnesota:
12.9%
Students in private schools in grades 9 to 12 (high school): 117
Here:
12.0%
Minnesota:
8.6%
Students in private undergraduate colleges: 48
Here:
7.5%
Minnesota:
26.2%
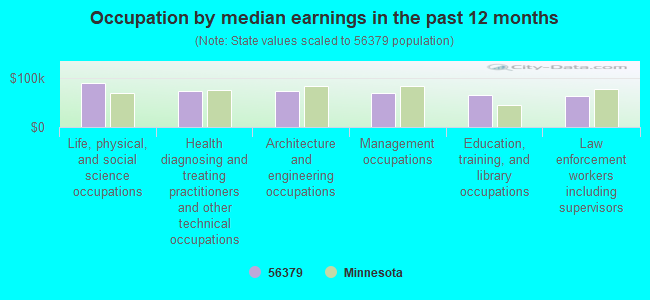
Occupation by median earnings in the past 12 months ($)
90,426Life, physical, and social science occupations
74,960Health diagnosing and treating practitioners and other technical occupations
73,535Architecture and engineering occupations
69,010Management occupations
65,424Education, training, and library occupations
64,389Law enforcement workers including supervisors
Companies with federal contracts located in this zip code (SAUK RAPIDS, MN):
STEARNS INC (1100 STEARNS DR; small business) : $571,687 in 24 contractsfrom 2001 to 2005
Contracts for Marine Lifesaving and Diving Equipment, Non-nuclear Ship Repair (East) Ship repair (including overhauls and conversions) performed on non-nuclear propelled and nonpropelled ships east of the 108th meridian, Miscellaneous Communication Equipment, Safety and Rescue Equipment, and moreby Defense Logistics Agency, Navy, U.S. Army Corps of Engineers - civil program financing only, Department of State, and others Signed by year:2000: $0; 2001: $4,987; 2002: $41,743; 2003: $371,303; 2004: $3,374; 2005: $150,280; 2006: $0.
Biggest contracts:
$71,749 with Defense Logistics Agency for Marine Lifesaving and Diving Equipment. Signed on 2003-10-26. Completion date: 2004-01-23.
$62,674, same as above.Signed on 2003-10-26. Completion date: 2004-01-31.
$51,916, same as above.Signed on 2003-10-26. Completion date: 2004-01-31.
$51,372, same as above.Signed on 2003-11-06. Completion date: 2004-02-06.
W F SCARINCE INC (315 INDUSTRIAL BLVD; small business) : $474,624 in 2 contractsfrom 2001 to 2003
$405,420 with Navy for Guns, over 30 mm up to 75 mm. Signed on 2003-08-27. Completion date: 2004-08-23.
$69,204 with Navy for Motor Vehicle Maintenance and Repair Shop Specialized Equipment. Signed on 2001-01-30. Completion date: 2001-03-23.
KOMO MACHINE, INC (11 INDUSTRIAL BLVD; small business)
$316,465 with Air Force for Machining Centers and Way-Type Machines. Taking place in TX. Signed on 2006-04-25. Completion date: 2006-08-28.
HUISKEN MEAT COMPANY OF SAUK R (245 INDUSTRIAL BLVD; small business) : $42,469 in 3 contractsfrom 2004 to 2005
$18,210 with Defense Commissary Agency for Food Items For Resale. Signed on 2004-10-01. Completion date: 2005-02-28.
$17,132, same as above.Signed on 2005-04-01. Completion date: 2005-08-31.
$7,127, same as above.Signed on 2005-01-01. Completion date: 2005-03-31.
WILKIE SANDERSON (1010 SUMMIT AVE N; small business) : $11,705 in 2 contractsfrom 2004 to 2005
$10,161 with Air Force for Maintenance, Repair or Alteration of Real Property -- Troop Housing Facilities. Signed on 2004-09-03. Completion date: 2004-09-24.
$1,544, same as above.Signed on 2005-01-19. Completion date: 2005-03-31.
Top industries in this zip code by the number of employees in 2005:
Construction: Highway, Street, and Bridge Construction (250-499 employees: 1 establishment, 50-99 employees: 1 establishment, 1-4 employees: 1 establishment)
Health Care and Social Assistance: Continuing Care Retirement Communities (250-499: 1, 5-9: 1)
Administrative and Support and Waste Management and Remediation Services: Collection Agencies (100-249: 1)
Health Care and Social Assistance: Residential Mental Retardation Facilities (20-49: 2, 10-19: 4, 5-9: 5)
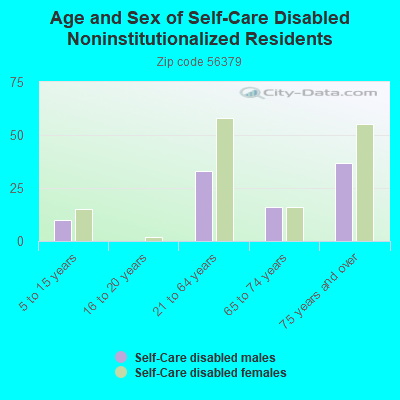
People in group quarters in 2010:
187 people in nursing facilities/skilled-nursing facilities
119 people in group homes intended for adults
80 people in residential treatment centers for adults
20 people in other noninstitutional facilities
5 people in workers' group living quarters and job corps centers
4 people in correctional residential facilities
4 people in group homes for juveniles (non-correctional)
People in group quarters in 2000:
161 people in nursing homes
49 people in homes for the mentally retarded
30 people in other noninstitutional group quarters
23 people in homes for the mentally ill
20 people in other nonhousehold living situations
4 people in mental (psychiatric) hospitals or wards
Fatal accident statistics in 2013:
Fatal accident count: 3
Vehicles involved in fatal accidents: 4
Fatal accidents caused by drunken drivers: 1
Fatalities: 3
Persons involved in fatal accidents: 5
Pedestrians involved in fatal accidents: 2
Fatal accident statistics in 2012:
Fatal accident count: 3
Vehicles involved in fatal accidents: 5
Fatal accidents caused by drunken drivers: 0
Fatalities: 4
Persons involved in fatal accidents: 7
Pedestrians involved in fatal accidents: 0
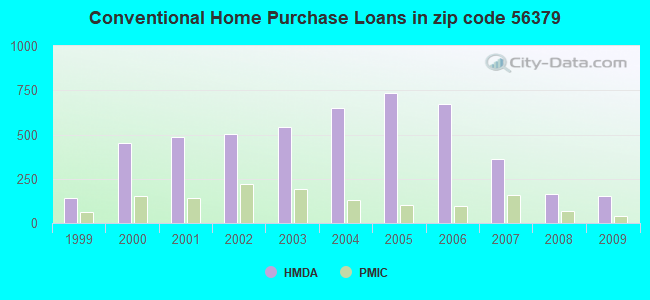
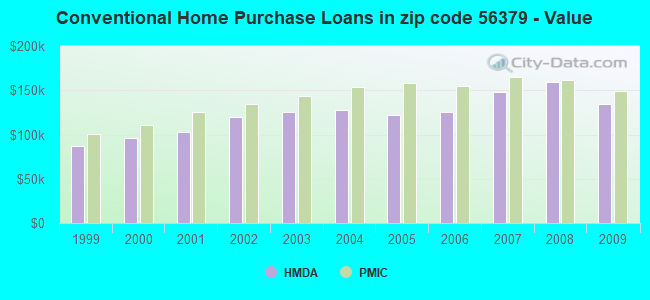
Home Mortgage Disclosure Act Aggregated Statistics For Year 2009 (Based on 8 partial tracts)
A) FHA, FSA/RHS & VA Home Purchase Loans
B) Conventional Home Purchase Loans
C) Refinancings
D) Home Improvement Loans
E) Loans on Dwellings For 5+ Families
F) Non-occupant Loans on < 5 Family Dwellings (A B C & D)
G) Loans On Manufactured Home Dwelling (A B C & D)
Number
Average Value
Number
Average Value
Number
Average Value
Number
Average Value
Number
Average Value
Number
Average Value
Number
Average Value
LOANS ORIGINATED
165
$142,218
155
$134,057
830
$146,230
39
$68,073
2
$410,145
21
$162,350
8
$64,668
APPLICATIONS APPROVED, NOT ACCEPTED
5
$125,392
6
$119,103
44
$152,912
4
$12,242
0
$0
1
$398,400
2
$32,205
APPLICATIONS DENIED
10
$108,809
11
$159,585
194
$149,545
14
$23,706
0
$0
4
$165,535
8
$48,712
APPLICATIONS WITHDRAWN
7
$101,751
14
$159,291
155
$165,320
9
$46,541
0
$0
4
$60,960
1
$83,890
FILES CLOSED FOR INCOMPLETENESS
0
$0
0
$0
31
$151,158
4
$165,205
0
$0
0
$0
0
$0
Aggregated Statistics For Year 2008 (Based on 8 partial tracts)
A) FHA, FSA/RHS & VA Home Purchase Loans
B) Conventional Home Purchase Loans
C) Refinancings
D) Home Improvement Loans
E) Loans on Dwellings For 5+ Families
F) Non-occupant Loans on < 5 Family Dwellings (A B C & D)
G) Loans On Manufactured Home Dwelling (A B C & D)
Number
Average Value
Number
Average Value
Number
Average Value
Number
Average Value
Number
Average Value
Number
Average Value
Number
Average Value
LOANS ORIGINATED
136
$148,795
164
$159,679
411
$142,297
62
$44,149
30
$504,882
42
$162,103
11
$74,015
APPLICATIONS APPROVED, NOT ACCEPTED
6
$122,373
15
$151,964
58
$132,469
3
$24,853
0
$0
1
$175,870
3
$101,530
APPLICATIONS DENIED
5
$144,422
36
$185,303
187
$158,405
24
$34,529
0
$0
12
$217,047
5
$46,764
APPLICATIONS WITHDRAWN
10
$139,433
14
$133,369
101
$152,743
3
$55,527
0
$0
3
$114,663
1
$53,630
FILES CLOSED FOR INCOMPLETENESS
0
$0
4
$135,915
26
$157,573
5
$76,424
0
$0
3
$108,017
0
$0
Aggregated Statistics For Year 2007 (Based on 8 partial tracts)
A) FHA, FSA/RHS & VA Home Purchase Loans
B) Conventional Home Purchase Loans
C) Refinancings
D) Home Improvement Loans
E) Loans on Dwellings For 5+ Families
F) Non-occupant Loans on < 5 Family Dwellings (A B C & D)
G) Loans On Manufactured Home Dwelling (A B C & D)
Number
Average Value
Number
Average Value
Number
Average Value
Number
Average Value
Number
Average Value
Number
Average Value
Number
Average Value
LOANS ORIGINATED
28
$182,400
362
$148,036
425
$122,420
84
$43,357
15
$478,609
84
$145,014
11
$75,526
APPLICATIONS APPROVED, NOT ACCEPTED
2
$151,770
31
$130,069
103
$123,305
23
$34,894
0
$0
8
$99,116
3
$21,533
APPLICATIONS DENIED
3
$135,417
60
$138,372
354
$154,656
38
$45,233
0
$0
48
$161,534
10
$31,377
APPLICATIONS WITHDRAWN
0
$0
21
$157,168
133
$168,198
8
$105,385
0
$0
8
$131,464
3
$81,337
FILES CLOSED FOR INCOMPLETENESS
0
$0
20
$112,129
33
$156,993
0
$0
0
$0
7
$107,376
0
$0
Aggregated Statistics For Year 2006 (Based on 8 partial tracts)
A) FHA, FSA/RHS & VA Home Purchase Loans
B) Conventional Home Purchase Loans
C) Refinancings
D) Home Improvement Loans
E) Loans on Dwellings For 5+ Families
F) Non-occupant Loans on < 5 Family Dwellings (A B C & D)
G) Loans On Manufactured Home Dwelling (A B C & D)
Number
Average Value
Number
Average Value
Number
Average Value
Number
Average Value
Number
Average Value
Number
Average Value
Number
Average Value
LOANS ORIGINATED
43
$160,000
670
$125,233
601
$120,945
97
$47,293
4
$1,568,582
85
$117,688
15
$66,961
APPLICATIONS APPROVED, NOT ACCEPTED
0
$0
54
$105,367
110
$121,199
21
$61,851
0
$0
11
$115,545
6
$47,103
APPLICATIONS DENIED
1
$180,990
87
$121,171
387
$129,835
53
$80,788
0
$0
11
$107,432
12
$65,246
APPLICATIONS WITHDRAWN
2
$148,070
35
$101,902
223
$154,286
14
$52,902
0
$0
5
$138,156
3
$130,043
FILES CLOSED FOR INCOMPLETENESS
0
$0
10
$149,755
83
$163,518
4
$137,830
0
$0
0
$0
1
$173,280
Aggregated Statistics For Year 2005 (Based on 8 partial tracts)
A) FHA, FSA/RHS & VA Home Purchase Loans
B) Conventional Home Purchase Loans
C) Refinancings
D) Home Improvement Loans
E) Loans on Dwellings For 5+ Families
F) Non-occupant Loans on < 5 Family Dwellings (A B C & D)
G) Loans On Manufactured Home Dwelling (A B C & D)
Number
Average Value
Number
Average Value
Number
Average Value
Number
Average Value
Number
Average Value
Number
Average Value
Number
Average Value
LOANS ORIGINATED
48
$149,272
735
$121,525
666
$121,209
72
$39,262
10
$342,703
87
$101,412
9
$53,937
APPLICATIONS APPROVED, NOT ACCEPTED
2
$172,305
45
$133,166
79
$117,279
9
$47,608
0
$0
4
$129,230
3
$47,313
APPLICATIONS DENIED
0
$0
101
$126,543
352
$127,968
43
$42,804
0
$0
8
$98,601
16
$50,343
APPLICATIONS WITHDRAWN
1
$149,400
70
$143,722
235
$143,730
24
$108,535
0
$0
18
$110,793
4
$132,588
FILES CLOSED FOR INCOMPLETENESS
0
$0
20
$100,344
93
$143,676
6
$39,533
0
$0
2
$88,535
3
$76,423
Aggregated Statistics For Year 2004 (Based on 8 partial tracts)
A) FHA, FSA/RHS & VA Home Purchase Loans
B) Conventional Home Purchase Loans
C) Refinancings
D) Home Improvement Loans
E) Loans on Dwellings For 5+ Families
F) Non-occupant Loans on < 5 Family Dwellings (A B C & D)
G) Loans On Manufactured Home Dwelling (A B C & D)
Number
Average Value
Number
Average Value
Number
Average Value
Number
Average Value
Number
Average Value
Number
Average Value
Number
Average Value
LOANS ORIGINATED
61
$140,042
652
$127,483
714
$116,358
93
$46,308
16
$364,070
61
$123,662
19
$64,325
APPLICATIONS APPROVED, NOT ACCEPTED
2
$162,810
62
$109,821
87
$135,123
3
$78,733
0
$0
3
$154,637
6
$34,285
APPLICATIONS DENIED
7
$144,736
64
$96,263
242
$129,601
30
$38,610
2
$141,835
5
$96,664
24
$56,930
APPLICATIONS WITHDRAWN
6
$145,410
31
$120,341
158
$139,919
5
$36,954
0
$0
0
$0
0
$0
FILES CLOSED FOR INCOMPLETENESS
0
$0
6
$87,122
119
$141,048
3
$14,290
0
$0
0
$0
2
$134,990
Aggregated Statistics For Year 2003 (Based on 8 partial tracts)
A) FHA, FSA/RHS & VA Home Purchase Loans
B) Conventional Home Purchase Loans
C) Refinancings
D) Home Improvement Loans
E) Loans on Dwellings For 5+ Families
F) Non-occupant Loans on < 5 Family Dwellings (A B C & D)
Number
Average Value
Number
Average Value
Number
Average Value
Number
Average Value
Number
Average Value
Number
Average Value
LOANS ORIGINATED
92
$132,628
542
$125,314
1,939
$108,998
59
$31,678
11
$310,770
35
$103,032
APPLICATIONS APPROVED, NOT ACCEPTED
4
$106,395
40
$122,181
188
$102,180
13
$22,127
0
$0
9
$125,816
APPLICATIONS DENIED
0
$0
54
$91,804
464
$111,607
42
$31,447
0
$0
8
$99,848
APPLICATIONS WITHDRAWN
4
$136,812
52
$145,399
258
$116,256
5
$42,372
2
$711,880
4
$118,608
FILES CLOSED FOR INCOMPLETENESS
0
$0
9
$155,120
36
$117,926
2
$22,585
0
$0
0
$0
Aggregated Statistics For Year 2002 (Based on 8 partial tracts)
A) FHA, FSA/RHS & VA Home Purchase Loans
B) Conventional Home Purchase Loans
C) Refinancings
D) Home Improvement Loans
E) Loans on Dwellings For 5+ Families
F) Non-occupant Loans on < 5 Family Dwellings (A B C & D)
Number
Average Value
Number
Average Value
Number
Average Value
Number
Average Value
Number
Average Value
Number
Average Value
LOANS ORIGINATED
102
$134,284
502
$120,193
1,216
$103,087
94
$27,388
18
$695,518
37
$79,142
APPLICATIONS APPROVED, NOT ACCEPTED
2
$123,290
24
$122,412
121
$85,257
11
$15,779
0
$0
4
$98,525
APPLICATIONS DENIED
2
$85,345
37
$64,870
312
$81,414
26
$17,200
0
$0
2
$122,340
APPLICATIONS WITHDRAWN
1
$180,100
41
$109,824
158
$107,946
1
$15,280
0
$0
5
$86,784
FILES CLOSED FOR INCOMPLETENESS
2
$105,700
7
$89,647
118
$108,466
0
$0
0
$0
3
$108,780
Aggregated Statistics For Year 2001 (Based on 8 partial tracts)
A) FHA, FSA/RHS & VA Home Purchase Loans
B) Conventional Home Purchase Loans
C) Refinancings
D) Home Improvement Loans
E) Loans on Dwellings For 5+ Families
F) Non-occupant Loans on < 5 Family Dwellings (A B C & D)
Number
Average Value
Number
Average Value
Number
Average Value
Number
Average Value
Number
Average Value
Number
Average Value
LOANS ORIGINATED
183
$117,090
485
$102,274
1,045
$89,515
125
$18,570
17
$819,585
23
$89,397
APPLICATIONS APPROVED, NOT ACCEPTED
2
$95,580
27
$65,954
73
$69,275
14
$23,109
0
$0
2
$111,225
APPLICATIONS DENIED
4
$82,950
70
$47,106
312
$76,686
33
$16,834
0
$0
5
$77,320
APPLICATIONS WITHDRAWN
2
$79,925
34
$118,871
122
$92,955
3
$27,423
0
$0
3
$74,680
FILES CLOSED FOR INCOMPLETENESS
0
$0
1
$22,320
50
$110,790
5
$24,738
0
$0
2
$149,060
Aggregated Statistics For Year 2000 (Based on 8 partial tracts)
A) FHA, FSA/RHS & VA Home Purchase Loans
B) Conventional Home Purchase Loans
C) Refinancings
D) Home Improvement Loans
E) Loans on Dwellings For 5+ Families
F) Non-occupant Loans on < 5 Family Dwellings (A B C & D)
Number
Average Value
Number
Average Value
Number
Average Value
Number
Average Value
Number
Average Value
Number
Average Value
LOANS ORIGINATED
131
$105,005
452
$96,455
272
$59,466
93
$20,643
7
$73,723
19
$97,649
APPLICATIONS APPROVED, NOT ACCEPTED
3
$96,583
23
$48,100
64
$58,839
22
$34,418
0
$0
0
$0
APPLICATIONS DENIED
3
$132,910
73
$66,448
178
$56,678
40
$16,908
0
$0
0
$0
APPLICATIONS WITHDRAWN
1
$37,750
26
$89,161
87
$64,795
4
$16,565
0
$0
4
$75,260
FILES CLOSED FOR INCOMPLETENESS
1
$136,440
4
$91,460
30
$97,196
2
$9,035
0
$0
0
$0
Aggregated Statistics For Year 1999 (Based on 4 partial tracts)
A) FHA, FSA/RHS & VA Home Purchase Loans
B) Conventional Home Purchase Loans
C) Refinancings
D) Home Improvement Loans
E) Loans on Dwellings For 5+ Families
F) Non-occupant Loans on < 5 Family Dwellings (A B C & D)
2002 - 2018 National Fire Incident Reporting System (NFIRS) incidents
Based on the data from the years 2002 - 2018 the average number of fire incidents per year is 38. The highest number of fire incidents - 71 took place in 2006, and the least - 1 in 2005. The data has a declining trend.
When looking into fire subcategories, the most reports belonged to: Outside Fires (39.0%), and Structure Fires (36.3%).
Fire incident types reported to NFIRS in Zip Code 56379
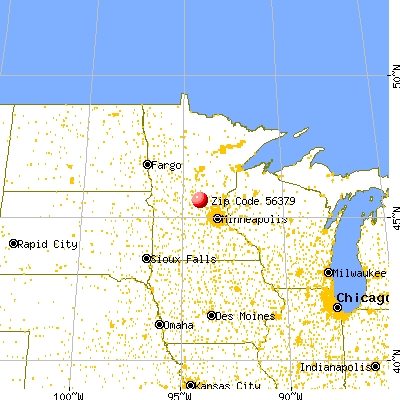


 Nearest zip codes: 56304, 56303, 56367, 56377, 56329, 56387.
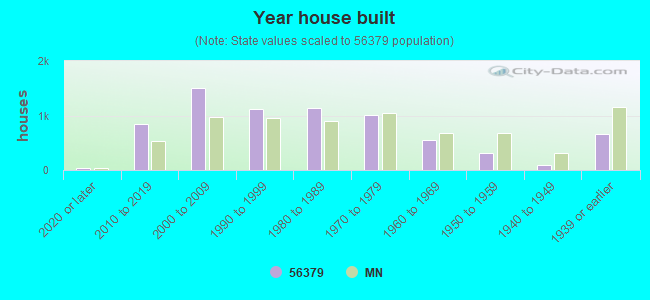


 Based on the data from the years 2002 - 2018 the average number of fire incidents per year is 38. The highest number of fire incidents - 71 took place in 2006, and the least - 1 in 2005. The data has a declining trend.
 When looking into fire subcategories, the most reports belonged to: Outside Fires (39.0%), and Structure Fires (36.3%).