Estimated zip code population in 2022: 2,443 Zip code population in 2010: 2,829 Zip code population in 2000: 2,871
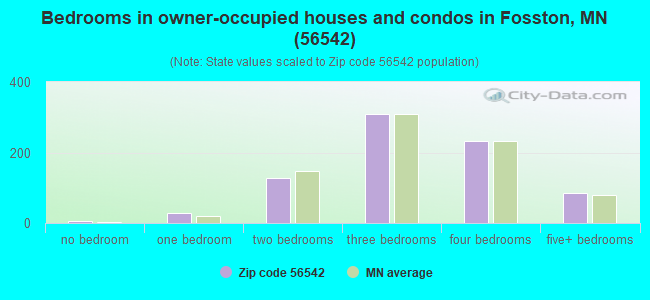
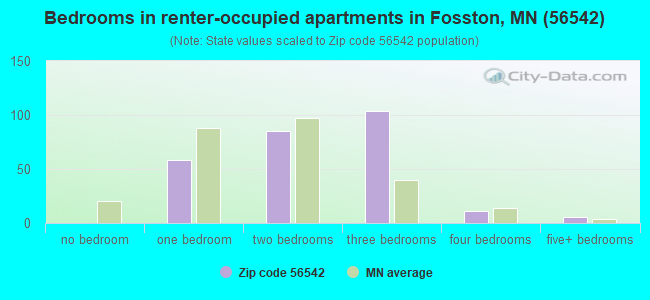
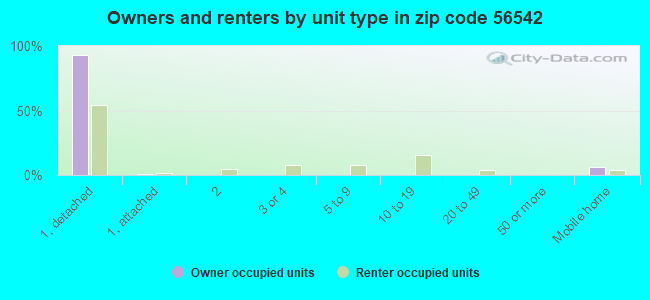
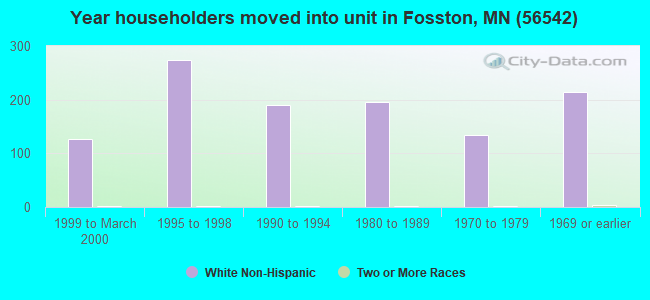
Houses and condos: 1,242 Renter-occupied apartments: 268
% of renters here:
25%
State:
28%
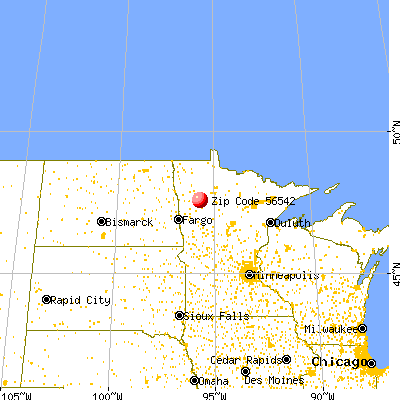
March 2022 cost of living index in zip code 56542: 86.8 (less than average, U.S. average is 100)
Land area: 191.3 sq. mi. Water area: 10.6 sq. mi.
Population density: 13 people per square mile
(very low).
OSM Map
General Map
Google Map
MSN Map
OSM Map
General Map
Google Map
MSN Map
OSM Map
General Map
Google Map
MSN Map
OSM Map
General Map
Google Map
MSN Map
Please wait while loading the map...
Real estate property taxes paid for housing units in 2022:
This zip code:
1.0% ($1,722)
Minnesota:
1.0% ($3,087)
Median real estate property taxes paid for housing units with mortgages in 2022: $1,743 (0.9%) Median real estate property taxes paid for housing units with no mortgage in 2022: $1,685 (1.0%)
Business Search- 14 Million verified businesses
Males: 1,228
(50.3%)
Females: 1,214
(49.7%)
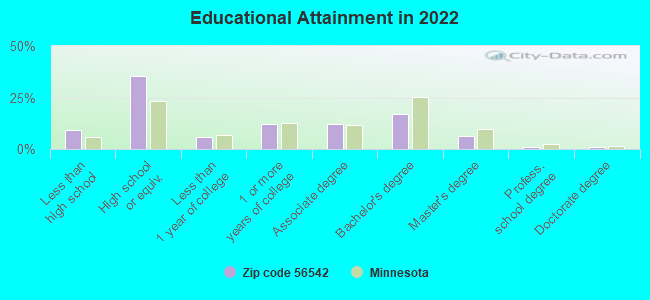
For population 25 years and over in 56542:
High school or higher: 89.5%
Bachelor's degree or higher: 25.0%
Graduate or professional degree: 8.3%
Unemployed: 4.1%
Mean travel time to work (commute): 17.6 minutes
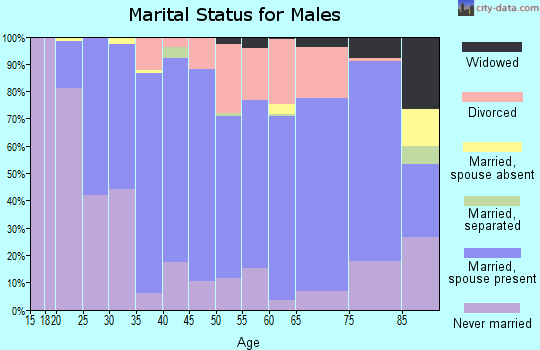
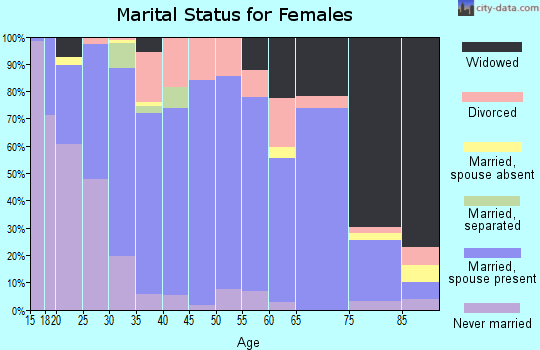
For population 15 years and over in 56542:
Never married: 21.6%
Now married: 55.6%
Separated: 1.1%
Widowed: 10.9%
Divorced: 10.8%
Zip code 56542 compared to state average:
Median household income below state average.
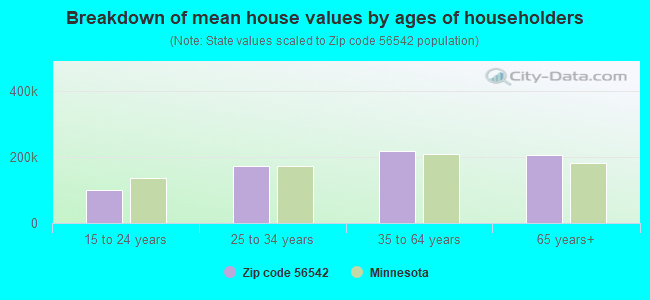
Median house value below state average.
Black race population percentage significantly below state average.
Hispanic race population percentage below state average.
Median age significantly above state average.
Foreign-born population percentage significantly below state average.
Length of stay since moving in significantly above state average.
Estimated median house/condo value in 2022: $180,006
56542:
$180,006
Minnesota:
$314,600
Median resident age:
This zip code:
48.9 years
Minnesota median age:
39.0 years
Average household size:
This zip code:
2.2 people
Minnesota:
2.4 people
Averages for the 2020 tax year for zip code 56542, filed in 2021:
Average Adjusted Gross Income (AGI) in 2020: $59,629 (Individual Income Tax Returns)
Here:
$59,629
State:
$82,178
Salary/wage: $45,884 (reported on 81.6% of returns)
Here:
$45,884
State:
$67,438
(% of AGI for various income ranges: 1117.2% for AGIs below $25k, 3860.0% for AGIs $25k-50k, 6760.8% for AGIs $50k-75k, 10292.5% for AGIs $75k-100k, 15220.0% for AGIs $100k-200k)
Taxable interest for individuals: $1,390 (reported on 38.4% of returns)
This zip code:
$1,390
Minnesota:
$1,814
(% of AGI for various income ranges: 32.4% for AGIs below $25k, 30.4% for AGIs $25k-50k, 45.8% for AGIs $50k-75k, 75.0% for AGIs $75k-100k, 217.8% for AGIs $100k-200k)
Ordinary dividends: $2,621 (reported on 15.2% of returns)
Here:
$2,621
State:
$6,928
(% of AGI for various income ranges: 15.6% for AGIs below $25k, 10.0% for AGIs $25k-50k, 33.3% for AGIs $50k-75k, 66.2% for AGIs $75k-100k, 380.0% for AGIs $100k-200k)
Net capital gain/loss in AGI: +$9,052 (reported on 16.8% of returns)
Here:
+$9,052
State:
+$20,591
(% of AGI for various income ranges: 31.2% for AGIs below $25k, 28.3% for AGIs $25k-50k, 101.7% for AGIs $50k-75k, 403.7% for AGIs $75k-100k, 736.7% for AGIs $100k-200k)
Profit/loss from business: +$7,765 (reported on 16.0% of returns)
Here:
+$7,765
State:
+$14,342
(% of AGI for various income ranges: 112.4% for AGIs below $25k, 153.3% for AGIs $25k-50k, 238.3% for AGIs $50k-75k, 427.5% for AGIs $75k-100k, 306.7% for AGIs $100k-200k)
Taxable individual retirement arrangement distribution: $15,781 (reported on 12.8% of returns)
56542:
$15,781
Minnesota:
$20,675
(% of AGI for various income ranges: 70.8% for AGIs below $25k, 120.8% for AGIs $25k-50k, 527.5% for AGIs $50k-75k, 1583.3% for AGIs $100k-200k)
Total itemized deductions: $32,760 (reported on 4.0% of returns)
Here:
$32,760
State:
$33,311
(% of AGI for various income ranges: 365.4% for AGIs $25k-50k, 845.6% for AGIs $100k-200k)
Charity contributions: $6,775 (reported on 3.2% of returns)
Here:
$6,775
State:
$11,879
(% of AGI for various income ranges: 301.1% for AGIs $100k-200k)
Taxes paid: $6,240 (reported on 4.0% of returns)
56542:
$6,240
State:
$8,252
(% of AGI for various income ranges: 36.2% for AGIs $25k-50k, 250.0% for AGIs $100k-200k)
Earned income credit: $2,447 (reported on 13.6% of returns)
Here:
$2,447
State:
$2,055
(% of AGI for various income ranges: 87.6% for AGIs below $25k, 82.1% for AGIs $25k-50k)
Percentage of individuals using paid preparers for their 2020 taxes: 96.0%
Here:
96%
State:
94%
(% for various income ranges: 95.0% for AGIs below $25k, 93.9% for AGIs $25k-50k, 94.4% for AGIs $50k-75k, 100.0% for AGIs $75k-100k, 100.0% for AGIs $100k-200k, 100.0% for AGIs over 200k)
Averages for the 2012 tax year for zip code 56542, filed in 2013:
Average Adjusted Gross Income (AGI) in 2012: $46,704 (Individual Income Tax Returns)
Here:
$46,704
State:
$67,192
Salary/wage: $37,782 (reported on 82.4% of returns)
Here:
$37,782
State:
$55,182
(% of AGI for various income ranges: 74.6% for AGIs below $25k, 73.7% for AGIs $25k-50k, 75.3% for AGIs $50k-75k, 71.5% for AGIs $75k-100k, 62.7% for AGIs $100k-200k, 38.6% for AGIs over 200k)
Taxable interest for individuals: $1,232 (reported on 37.6% of returns)
This zip code:
$1,232
Minnesota:
$1,664
(% of AGI for various income ranges: 1.6% for AGIs below $25k, 1.0% for AGIs $25k-50k, 0.9% for AGIs $50k-75k, 0.7% for AGIs $75k-100k, 1.0% for AGIs $100k-200k, 1.0% for AGIs over 200k)
Ordinary dividends: $2,052 (reported on 16.8% of returns)
Here:
$2,052
State:
$5,665
(% of AGI for various income ranges: 1.3% for AGIs below $25k, 0.5% for AGIs $25k-50k, 0.4% for AGIs $50k-75k, 0.3% for AGIs $75k-100k, 1.6% for AGIs $100k-200k)
Net capital gain/loss in AGI: +$6,524 (reported on 16.8% of returns)
Here:
+$6,524
State:
+$16,131
(% of AGI for various income ranges: 0.3% for AGIs below $25k, 1.6% for AGIs $25k-50k, 2.1% for AGIs $50k-75k, 0.9% for AGIs $75k-100k, 6.5% for AGIs $100k-200k)
Profit/loss from business: +$7,692 (reported on 20.0% of returns)
Here:
+$7,692
State:
+$12,430
(% of AGI for various income ranges: 9.0% for AGIs below $25k, 4.5% for AGIs $25k-50k, 3.1% for AGIs $50k-75k, 2.3% for AGIs $75k-100k, 2.3% for AGIs $100k-200k)
Taxable individual retirement arrangement distribution: $7,225 (reported on 12.8% of returns)
56542:
$7,225
Minnesota:
$15,212
(% of AGI for various income ranges: 4.0% for AGIs below $25k, 3.1% for AGIs $25k-50k, 1.9% for AGIs $50k-75k, 4.1% for AGIs $75k-100k)
Total itemized deductions: $19,306 (21% of AGI, reported on 25.6% of returns)
Here:
$19,306
State:
$24,665
Here:
21.4% of AGI
State:
19.6% of AGI
(% of AGI for various income ranges: 8.1% for AGIs below $25k, 8.5% for AGIs $25k-50k, 8.7% for AGIs $50k-75k, 10.2% for AGIs $75k-100k, 14.7% for AGIs $100k-200k, 11.7% for AGIs over 200k)
Charity contributions: $4,120 (reported on 20.0% of returns)
Here:
$4,120
State:
$3,948
(% of AGI for various income ranges: 0.7% for AGIs below $25k, 1.0% for AGIs $25k-50k, 1.6% for AGIs $50k-75k, 1.9% for AGIs $75k-100k, 3.0% for AGIs $100k-200k, 1.6% for AGIs over 200k)
Taxes paid: $6,834 (reported on 25.6% of returns)
56542:
$6,834
State:
$10,589
(% of AGI for various income ranges: 1.2% for AGIs below $25k, 1.7% for AGIs $25k-50k, 2.7% for AGIs $50k-75k, 2.9% for AGIs $75k-100k, 6.4% for AGIs $100k-200k, 6.8% for AGIs over 200k)
Earned income credit: $2,013 (reported on 18.4% of returns)
Here:
$2,013
State:
$2,037
(% of AGI for various income ranges: 5.5% for AGIs below $25k, 1.0% for AGIs $25k-50k)
Percentage of individuals using paid preparers for their 2012 taxes: 68.0%
Here:
68%
State:
55%
(% for various income ranges: 60.0% for AGIs below $25k, 66.7% for AGIs $25k-50k, 72.2% for AGIs $50k-75k, 80.0% for AGIs $75k-100k, 90.0% for AGIs $100k-200k, 100.0% for AGIs over 200k)
Averages for the 2004 tax year for zip code 56542, filed in 2005:
Average Adjusted Gross Income (AGI) in 2004: $32,445 (Individual Income Tax Returns)
Here:
$32,445
State:
$53,560
Salary/wage: $28,059 (reported on 83.3% of returns)
Here:
$28,059
State:
$46,177
(% of AGI for various income ranges: 121.7% for AGIs below $10k, 73.7% for AGIs $10k-25k, 75.2% for AGIs $25k-50k, 78.3% for AGIs $50k-75k, 68.1% for AGIs $75k-100k, 52.2% for AGIs over 100k)
Taxable interest for individuals: $1,262 (reported on 45.2% of returns)
This zip code:
$1,262
Minnesota:
$1,796
(% of AGI for various income ranges: 6.0% for AGIs below $10k, 2.3% for AGIs $10k-25k, 1.8% for AGIs $25k-50k, 1.4% for AGIs $50k-75k, 1.5% for AGIs $75k-100k, 1.3% for AGIs over 100k)
Taxable dividends: $1,249 (reported on 17.5% of returns)
Here:
$1,249
State:
$3,096
(% of AGI for various income ranges: 3.1% for AGIs below $10k, 1.5% for AGIs $10k-25k, 0.5% for AGIs $25k-50k, 0.3% for AGIs $50k-75k, 0.6% for AGIs $75k-100k, 0.4% for AGIs over 100k)
Net capital gain/loss: +$3,815 (reported on 17.2% of returns)
Here:
+$3,815
State:
+$10,864
(% of AGI for various income ranges: -2.6% for AGIs below $10k, 3.2% for AGIs $10k-25k, 1.3% for AGIs $25k-50k, 2.3% for AGIs $50k-75k, 3.3% for AGIs $75k-100k, 1.3% for AGIs over 100k)
Profit/loss from business: +$4,891 (reported on 21.4% of returns)
Here:
+$4,891
State:
+$10,442
(% of AGI for various income ranges: 13.6% for AGIs below $10k, 5.9% for AGIs $10k-25k, 5.0% for AGIs $25k-50k, 1.4% for AGIs $50k-75k, 2.0% for AGIs $75k-100k)
IRA payment deduction: $3,030 (reported on 5.2% of returns)
56542:
$3,030
Minnesota:
$2,955
Total itemized deductions: $15,187 (23% of AGI, reported on 21.6% of returns)
Here:
$15,187
State:
$20,035
Here:
22.8% of AGI
State:
21.3% of AGI
(% of AGI for various income ranges: 15.3% for AGIs below $10k, 6.9% for AGIs $10k-25k, 8.9% for AGIs $25k-50k, 10.2% for AGIs $50k-75k, 13.3% for AGIs $75k-100k, 10.9% for AGIs over 100k)
Charity contributions deductions: $3,264 (4% of AGI, reported on 17.9% of returns)
Here:
$3,264
State:
$3,333
Here:
4.5% of AGI
State:
3.4% of AGI
(% of AGI for various income ranges: 1.0% for AGIs $10k-25k, 1.1% for AGIs $25k-50k, 2.0% for AGIs $50k-75k, 2.9% for AGIs $75k-100k, 2.7% for AGIs over 100k)
Total tax: $4,222 (reported on 70.8% of returns)
56542:
$4,222
State:
$8,485
(% of AGI for various income ranges: 4.1% for AGIs below $10k, 4.5% for AGIs $10k-25k, 6.6% for AGIs $25k-50k, 7.6% for AGIs $50k-75k, 9.4% for AGIs $75k-100k, 20.4% for AGIs over 100k)
Earned income credit: $1,717 (reported on 18.1% of returns)
Here:
$1,717
State:
$1,523
Percentage of individuals using paid preparers for their 2004 taxes: 75.4%
Here:
75%
State:
59%
(% for various income ranges: 64.3% for AGIs below $10k, 80.5% for AGIs $10k-25k, 78.1% for AGIs $25k-50k, 78.8% for AGIs $50k-75k, 76.6% for AGIs $75k-100k, 91.9% for AGIs over 100k)
Household received Food Stamps/SNAP in the past 12 months: 153 Household did not receive Food Stamps/SNAP in the past 12 months: 911
Women who had a birth in the past 12 months: 39 (31 now married, 8 unmarried) Women who did not have a birth in the past 12 months: 361 (183 now married, 178 unmarried)
Housing units in zip code 56542 with a mortgage: 372 (16 second mortgage, 11 both second mortgage and home equity loan) Median monthly owner costs for units with a mortgage: $1,319 Median monthly owner costs for units without a mortgage: $625
Residents with income below the poverty level in 2022:
This zip code:
16.3%
Whole state:
9.6%
Residents with income below 50% of the poverty level in 2022:
This zip code:
10.7%
Whole state:
5.2%
Median number of rooms in houses and condos:
Here:
6.8
State:
7.1
Median number of rooms in apartments:
Here:
4.8
State:
3.8
Notable locations in this zip code not listed on our city pages
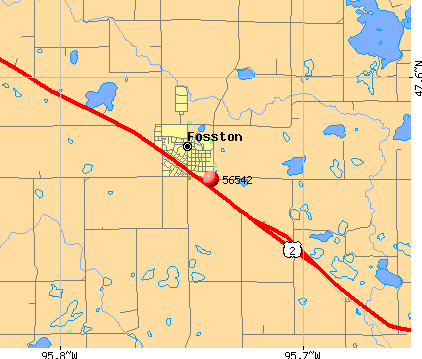
Notable locations in zip code 56542: Fosston (A), City of Fosston Campground (B), Sand Hill Camp (C), Fosston Golf Club (D), Fosston Library (E), Fosston Police Department (F), Fosston Volunteer Fire Department (G), East Polk Heritage Center (H). Display/hide their locations on the map
Churches in zip code 56542 include: Cross Lake Church (A), Saint Peter Church (B), Poplar Lake Church (C), Sand Hill Chapel (D), Sand Hill Church (E), Bethel Assembly Church (F), Calvary Free Lutheran Church (G), First English Lutheran Church (H), First Baptist Church (I). Display/hide their locations on the map
Cemeteries: Poplar River Cemetery (1), Queen Cemetery (2), Cross Lake Cemetery (3), Rosehill Cemetery (4), Duane Cemetery (5), Mamre Cemetery (6), Hansville Cemetery (7). Display/hide their locations on the map
Lakes and reservoirs: South Lake (A), Whitefish Lake (B), Volden Lake (C), Underberg Lake (D), Turtle Lake (E), Third Lake (F), Syverson Lake (G), Strand Lake (H). Display/hide their locations on the map
Parks in zip code 56542 include: Foot State Wildlife Management Area (1), Hasselton State Wildlife Management Area (2), Hill River State Wildlife Management Area (3), Hovland State Wildlife Management Area (4), Kroening State Wildlife Management Area (5), Melland Park (6), Lavoi State Wildlife Management Area (7), Sagaiigan State Wildlife Management Area (8), Tilberg County Park (9). Display/hide their locations on the map
In group quarters: 139 (-1 institutionalized population)
Size of family households: 358 2-persons, 130 3-persons, 71 4-persons, 42 5-persons, 33 6-persons, 6 7-or-more-persons
Size of nonfamily households: 382 1-person, 37 2-persons, 2 3-persons
397 married couples with children.
128 single-parent households (35 men, 93 women).
96.9% of residents of 56542 zip code speak English at home.
1.1% of residents speak Spanish at home (4% very well, 85% well, 12% not well).
2.2% of residents speak other Indo-European language at home (84% very well, 12% well, 4% not well).
0.3% of residents speak Asian or Pacific Island language at home (100% very well).
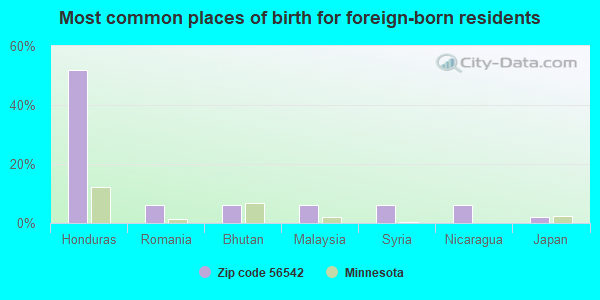
Foreign born population: 50 (2.1%) (36.0% of them are naturalized citizens)
This zip code:
2.1%
Whole state:
8.7%
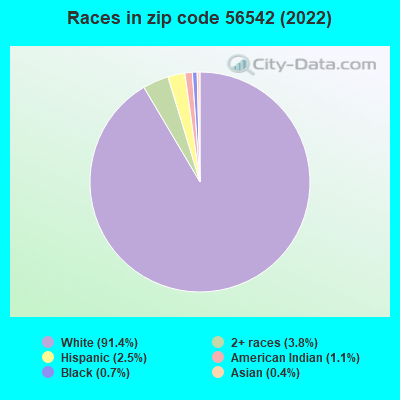
52%Honduras
6%Romania
6%Bhutan
6%Malaysia
6%Syria
6%Nicaragua
2%Japan
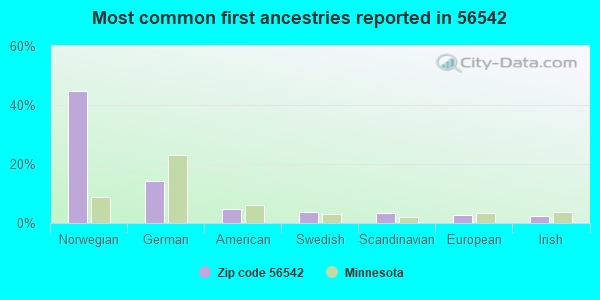
45%Norwegian
14%German
5%American
4%Swedish
3%Scandinavian
3%European
2%Irish
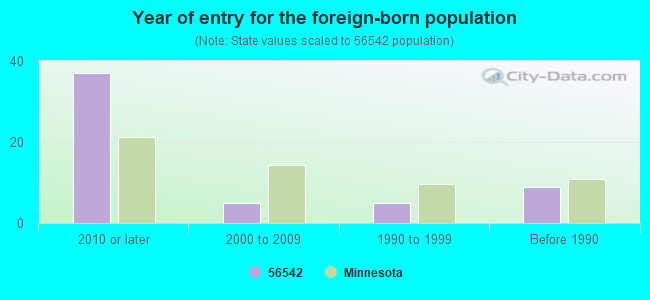
Year of entry for the foreign-born population
372010 or later
52000 to 2009
51990 to 1999
9Before 1990
Facilities with environmental interests located in this zip code:
FOSSTON WWTP (TOWNSHIP ROAD 27 in FOSSTON, MN)
STATE MASTER (Minnesota Pollution Control Agency permits and compilance tracking) - PCS-MN0022128, NPDES NON-MAJOR National Pollutant Discharge Elimination System NON-MAJOR (Tracking pollutant discharge elimination systems) - permit National Pollutant Discharge Elimination System NON-MAJOR (Tracking pollutant discharge elimination systems) - permit COMMUNITY WATER SYSTEM (SDWIS) - SDWIS-MN1600010 4, WATER TREATMENT PLANT Business SIC classification: SEWERAGE SYSTEMS Business NAICS classification: SEWAGE TREATMENT FACILITIES. Organizations: FOSSTON CITY OF (CONTACT/OWNER)
FOSSTON IMPLEMENT CO (HWY 2 W in FOSSTON, MN)
STATE MASTER (Minnesota Pollution Control Agency permits and compilance tracking) - RCRAINFO-MND047253554, CESQG, RCRIS-MND047253554, Conditionally Exempt Small Quantity Generators, less than 100 kg/month of hazardous waste (Resource Conservation and Recovery Act (tracking hazardous waste)) - notification USED OIL PROGRAM (Resource Conservation and Recovery Act (tracking hazardous waste)) Business SIC and NAICS classification: FARM AND GARDEN MACHINERY AND EQUIPMENT Organizations: DU FAULT LLOYD (CONTACT/OWNER)
FIRST CARE MEDICAL SERVICES (900 HILLIGOSS BOULEVARD SOUTHEAST in FOSSTON, MN)
STATE MASTER (Minnesota Pollution Control Agency permits and compilance tracking) - RCRAINFO-MND076511088, CESQG, RCRIS-MND076511088, Conditionally Exempt Small Quantity Generators, less than 100 kg/month of hazardous waste (Resource Conservation and Recovery Act (tracking hazardous waste)) - notification Business SIC and NAICS classification: GENERAL MEDICAL AND SURGICAL HOSPITALS Organizations: FOSSTON CITY OF (CONTACT/OWNER)
Alternative names: FOSSTON HOSPITAL
AIR TECH PAINT AND BODY (HIGHWAY 2 WEST FOSSTON AIRPORT in FOSSTON, MN)
STATE MASTER (Minnesota Pollution Control Agency permits and compilance tracking) - RCRAINFO-MN0000781872, CESQG, RCRIS-MN0000781872, Conditionally Exempt Small Quantity Generators, less than 100 kg/month of hazardous waste (Resource Conservation and Recovery Act (tracking hazardous waste)) - notification Organizations: ANDERSON RICHARD W (CONTACT/OWNER)
, AIR TECH PAINT & BODY (CONTACT/OWNER)
Alternative names: AIP TECH PAINT AND BODY
GARYS 66 SER (101 N JOHNSON AVE in FOSSTON, MN)
STATE MASTER (Minnesota Pollution Control Agency permits and compilance tracking) - RCRAINFO-MND985706902, CESQG, RCRIS-MND985706902, Conditionally Exempt Small Quantity Generators, less than 100 kg/month of hazardous waste (Resource Conservation and Recovery Act (tracking hazardous waste)) - notification Business SIC classification: GENERAL AUTOMOTIVE REPAIR SHOPS Organizations: HANSON GARY (CONTACT/OWNER)
, GARY S 66 SERVICE (CONTACT/OWNER)
FOSSTON SEC. (301 E. 1ST ST. in FOSSTON, MN)
(National Center for Education Statistics) - STATE ID-010601020
NORTHERN FOOD & DAIRY INCORPORATED (710 WEST FIRST STREET in FOSSTON, MN)
AIR MINOR (AIRS/AFS) TRI REPORTER (Tracking of toxic chemicals releasing facilities) Business SIC classification: DRY, CONDENSED, AND EVAPORATED DAIRY PRODUCTS Alternative names: LAND O LAKES, SUNOPTA INGREDIENTS
ABELGARRD LOGGING (ROUTE 1 in FOSSTON, MN)
AIR MINOR (AIRS/AFS) Business SIC classification: NONCLASSIFIABLE ESTABLISHMENTS
FOSSTON FORD INC (HWY 2 E in FOSSTON, MN)
Small Quantity Generators, between 100 kg and 1000 kg of hazardous waste/month (Resource Conservation and Recovery Act (tracking hazardous waste)) - notification Organizations: LOWTH BOB (CONTACT/OWNER)
FOSSTON COOP ELEVATOR (COUNTY ROAD 1 in FOSSTON, MN)
ENFORCEMENT/COMPLIANCE ACTIVITY (Integrated Compliance Information System)
Housing units lacking complete plumbing facilities: 4.2% Housing units lacking complete kitchen facilities: 4.5%
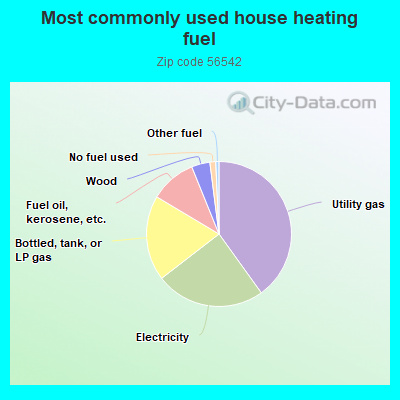
40.0%Utility gas
24.4%Electricity
19.0%Bottled, tank, or LP gas
10.3%Fuel oil, kerosene, etc.
4.1%Wood
1.3%No fuel used
0.7%Other fuel
Population in 1990: 2,469. Population change in the 1990s: +402 (+16.3%).
Place of birth for U.S.-born residents:
This state: 1,834
Northeast: 9
Midwest: 303
South: 73
West: 160
63% of the 56542 zip code residents lived in the same house 5 years ago. Out of people who lived in different houses, 56% lived in this county. Out of people who lived in different counties, 50% lived in Minnesota.
92% of the 56542 zip code residents lived in the same house 1 year ago. Out of people who lived in different houses, 58% moved from this county. Out of people who lived in different houses, 34% moved from different county within same state. Out of people who lived in different houses, 5% moved from different state.
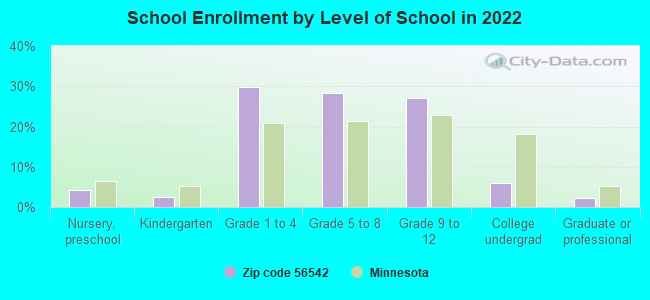
Private vs. public school enrollment:
Students in private schools in grades 1 to 8 (elementary and middle school): 19
Here:
7.1%
Minnesota:
12.9%
Students in private schools in grades 9 to 12 (high school): 1
Here:
0.9%
Minnesota:
8.6%
Students in private undergraduate colleges: 9
Here:
32.7%
Minnesota:
26.2%
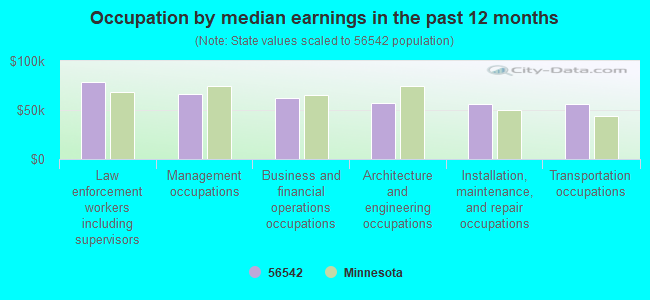
Occupation by median earnings in the past 12 months ($)
78,067Law enforcement workers including supervisors
65,938Management occupations
62,528Business and financial operations occupations
57,305Architecture and engineering occupations
56,598Installation, maintenance, and repair occupations
56,151Transportation occupations
Companies with federal contracts located in this zip code:
LE PIER OIL COMPANY INC (320 1ST ST E in FOSSTON, MN; small business) : $2,886,560 in 23 contractsfrom 2000 to 2006
Contracts for Liquid Propellants and Fuels, Petroleum Base, Fuel Oils, Waste Treatment and Storage, Fueling and Other Petroleum Services - Excluding Storage, and moreby Defense Logistics Agency, Air Force Signed by year:2000: $307,115; 2001: $281,174; 2002: $204,380; 2003: $190,970; 2004: $1,247,923; 2005: $638,258; 2006: $16,740.
Biggest contracts:
$661,572 with Defense Logistics Agency for Liquid Propellants and Fuels, Petroleum Base. Signed on 2004-11-29. Completion date: 2005-06-30.
$451,932, same as above.Signed on 2005-04-01. Completion date: 2007-06-30.
$257,693 with Defense Logistics Agency for Fuel Oils. Signed on 2004-08-10. Completion date: 2009-06-30.
$171,626 with Air Force for Waste Treatment and Storage. Taking place in ND. Signed on 2005-10-01. Completion date: 2006-09-30.
Top industries in this zip code by the number of employees in 2005:
Health Care and Social Assistance: General Medical and Surgical Hospitals (100-249 employees: 1 establishment)
Health Care and Social Assistance: Residential Mental Retardation Facilities (10-19: 2, 5-9: 3)
Health Care and Social Assistance: Offices of Physicians (except Mental Health Specialists) (20-49: 1)
Health Care and Social Assistance: Nursing Care Facilities (20-49: 1)
People in group quarters in 2010:
66 people in nursing facilities/skilled-nursing facilities
25 people in group homes intended for adults
People in group quarters in 2000:
75 people in nursing homes
14 people in homes for the mentally retarded
9 people in homes for the mentally ill
9 people in other noninstitutional group quarters
Fatal accident statistics in 2011:
Fatal accident count: 1
Vehicles involved in fatal accidents: 1
Fatal accidents caused by drunken drivers: 0
Fatalities: 1
Persons involved in fatal accidents: 1
Pedestrians involved in fatal accidents: 0
Fatal accident statistics in 2010:
Fatal accident count: 2
Vehicles involved in fatal accidents: 3
Fatal accidents caused by drunken drivers: 0
Fatalities: 3
Persons involved in fatal accidents: 6
Pedestrians involved in fatal accidents: 0
Home Mortgage Disclosure Act Aggregated Statistics For Year 2009 (Based on 2 partial tracts)
A) FHA, FSA/RHS & VA Home Purchase Loans
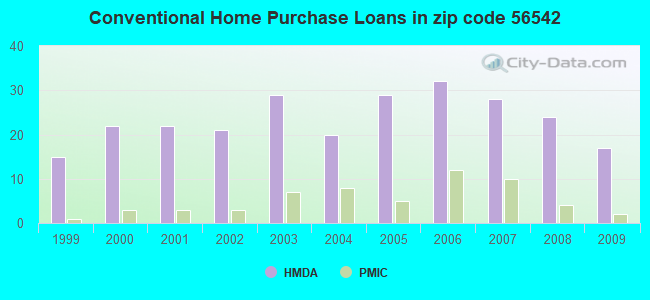
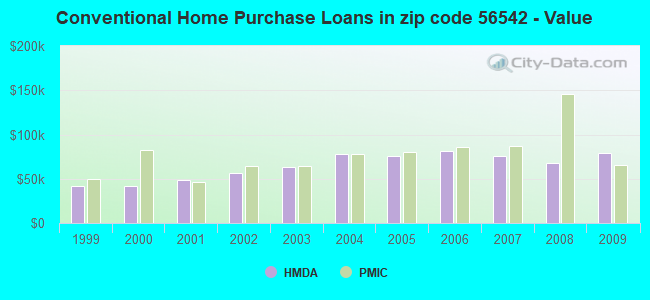
B) Conventional Home Purchase Loans
C) Refinancings
D) Home Improvement Loans
E) Loans on Dwellings For 5+ Families
F) Non-occupant Loans on < 5 Family Dwellings (A B C & D)
G) Loans On Manufactured Home Dwelling (A B C & D)
Number
Average Value
Number
Average Value
Number
Average Value
Number
Average Value
Number
Average Value
Number
Average Value
Number
Average Value
LOANS ORIGINATED
3
$106,373
17
$79,633
54
$127,152
10
$50,724
1
$8,400
14
$123,031
6
$92,098
APPLICATIONS APPROVED, NOT ACCEPTED
0
$0
2
$56,685
3
$115,053
1
$10,080
0
$0
1
$101,620
3
$41,150
APPLICATIONS DENIED
2
$175,520
2
$47,870
24
$120,441
1
$3,360
0
$0
3
$132,967
2
$63,825
APPLICATIONS WITHDRAWN
0
$0
2
$110,435
11
$132,917
1
$30,230
0
$0
0
$0
1
$115,890
FILES CLOSED FOR INCOMPLETENESS
0
$0
0
$0
3
$61,587
0
$0
0
$0
0
$0
0
$0
Aggregated Statistics For Year 2008 (Based on 2 partial tracts)
A) FHA, FSA/RHS & VA Home Purchase Loans
B) Conventional Home Purchase Loans
C) Refinancings
D) Home Improvement Loans
E) Loans on Dwellings For 5+ Families
F) Non-occupant Loans on < 5 Family Dwellings (A B C & D)
G) Loans On Manufactured Home Dwelling (A B C & D)
Number
Average Value
Number
Average Value
Number
Average Value
Number
Average Value
Number
Average Value
Number
Average Value
Number
Average Value
LOANS ORIGINATED
1
$26,030
24
$67,464
29
$94,318
19
$35,493
2
$173,840
14
$46,669
8
$63,510
APPLICATIONS APPROVED, NOT ACCEPTED
0
$0
1
$100,780
4
$148,225
0
$0
0
$0
0
$0
1
$77,260
APPLICATIONS DENIED
1
$26,030
6
$102,875
24
$79,641
14
$31,672
0
$0
1
$112,530
3
$91,257
APPLICATIONS WITHDRAWN
0
$0
3
$112,253
7
$132,209
3
$71,663
0
$0
1
$50,390
2
$50,810
FILES CLOSED FOR INCOMPLETENESS
0
$0
0
$0
3
$95,737
0
$0
0
$0
0
$0
0
$0
Aggregated Statistics For Year 2007 (Based on 2 partial tracts)
B) Conventional Home Purchase Loans
C) Refinancings
D) Home Improvement Loans
E) Loans on Dwellings For 5+ Families
F) Non-occupant Loans on < 5 Family Dwellings (A B C & D)
G) Loans On Manufactured Home Dwelling (A B C & D)
Number
Average Value
Number
Average Value
Number
Average Value
Number
Average Value
Number
Average Value
Number
Average Value
LOANS ORIGINATED
28
$76,062
32
$77,708
14
$33,652
2
$14,695
11
$68,635
8
$59,521
APPLICATIONS APPROVED, NOT ACCEPTED
3
$91,257
4
$93,848
1
$78,100
0
$0
0
$0
1
$78,100
APPLICATIONS DENIED
6
$89,018
37
$98,302
3
$59,347
0
$0
3
$84,820
3
$99,097
APPLICATIONS WITHDRAWN
6
$93,078
10
$115,808
2
$77,260
0
$0
1
$80,620
1
$75,580
FILES CLOSED FOR INCOMPLETENESS
0
$0
4
$151,375
1
$33,590
0
$0
0
$0
0
$0
Aggregated Statistics For Year 2006 (Based on 2 partial tracts)
A) FHA, FSA/RHS & VA Home Purchase Loans
B) Conventional Home Purchase Loans
C) Refinancings
D) Home Improvement Loans
F) Non-occupant Loans on < 5 Family Dwellings (A B C & D)
G) Loans On Manufactured Home Dwelling (A B C & D)
Number
Average Value
Number
Average Value
Number
Average Value
Number
Average Value
Number
Average Value
Number
Average Value
LOANS ORIGINATED
1
$62,980
32
$81,356
45
$80,061
13
$37,985
17
$78,249
9
$43,950
APPLICATIONS APPROVED, NOT ACCEPTED
1
$117,570
5
$76,422
10
$104,891
2
$18,895
0
$0
1
$15,960
APPLICATIONS DENIED
0
$0
12
$100,426
34
$82,869
7
$57,706
3
$85,100
2
$134,790
APPLICATIONS WITHDRAWN
0
$0
7
$104,256
26
$83,334
2
$16,795
3
$109,453
1
$20,160
FILES CLOSED FOR INCOMPLETENESS
0
$0
0
$0
7
$96,217
0
$0
0
$0
0
$0
Aggregated Statistics For Year 2005 (Based on 2 partial tracts)
B) Conventional Home Purchase Loans
C) Refinancings
D) Home Improvement Loans
E) Loans on Dwellings For 5+ Families
F) Non-occupant Loans on < 5 Family Dwellings (A B C & D)
G) Loans On Manufactured Home Dwelling (A B C & D)
Number
Average Value
Number
Average Value
Number
Average Value
Number
Average Value
Number
Average Value
Number
Average Value
LOANS ORIGINATED
29
$75,611
45
$93,031
28
$30,623
2
$77,680
11
$60,924
8
$33,592
APPLICATIONS APPROVED, NOT ACCEPTED
6
$51,648
11
$87,721
2
$35,270
0
$0
3
$54,587
1
$22,670
APPLICATIONS DENIED
8
$76,211
24
$77,472
5
$42,326
0
$0
3
$66,063
2
$35,690
APPLICATIONS WITHDRAWN
4
$60,465
11
$106,425
1
$50,390
0
$0
3
$79,220
1
$109,170
FILES CLOSED FOR INCOMPLETENESS
3
$43,390
8
$98,256
1
$29,390
0
$0
0
$0
0
$0
Aggregated Statistics For Year 2004 (Based on 2 partial tracts)
A) FHA, FSA/RHS & VA Home Purchase Loans
B) Conventional Home Purchase Loans
C) Refinancings
D) Home Improvement Loans
E) Loans on Dwellings For 5+ Families
F) Non-occupant Loans on < 5 Family Dwellings (A B C & D)
G) Loans On Manufactured Home Dwelling (A B C & D)
Number
Average Value
Number
Average Value
Number
Average Value
Number
Average Value
Number
Average Value
Number
Average Value
Number
Average Value
LOANS ORIGINATED
1
$120,090
20
$78,186
43
$73,434
8
$28,972
1
$1,007,760
9
$70,917
8
$65,505
APPLICATIONS APPROVED, NOT ACCEPTED
0
$0
11
$54,969
14
$108,994
2
$50,390
0
$0
0
$0
3
$72,223
APPLICATIONS DENIED
3
$64,943
8
$77,576
25
$89,422
6
$38,072
0
$0
0
$0
3
$64,943
APPLICATIONS WITHDRAWN
1
$128,490
3
$75,583
15
$85,268
1
$12,600
0
$0
0
$0
0
$0
FILES CLOSED FOR INCOMPLETENESS
0
$0
2
$66,765
13
$111,564
1
$12,600
0
$0
2
$63,405
2
$52,905
Aggregated Statistics For Year 2003 (Based on 2 partial tracts)
A) FHA, FSA/RHS & VA Home Purchase Loans
B) Conventional Home Purchase Loans
C) Refinancings
D) Home Improvement Loans
E) Loans on Dwellings For 5+ Families
F) Non-occupant Loans on < 5 Family Dwellings (A B C & D)
Number
Average Value
Number
Average Value
Number
Average Value
Number
Average Value
Number
Average Value
Number
Average Value
LOANS ORIGINATED
4
$77,052
29
$63,390
65
$74,768
9
$31,072
1
$25,190
7
$64,544
APPLICATIONS APPROVED, NOT ACCEPTED
0
$0
5
$49,548
7
$74,983
1
$75,580
0
$0
0
$0
APPLICATIONS DENIED
0
$0
11
$41,990
32
$68,706
3
$55,147
0
$0
2
$34,010
APPLICATIONS WITHDRAWN
0
$0
2
$44,930
11
$78,406
1
$16,800
0
$0
0
$0
FILES CLOSED FOR INCOMPLETENESS
0
$0
1
$33,590
2
$23,095
0
$0
0
$0
0
$0
Aggregated Statistics For Year 2002 (Based on 2 partial tracts)
A) FHA, FSA/RHS & VA Home Purchase Loans
B) Conventional Home Purchase Loans
C) Refinancings
D) Home Improvement Loans
F) Non-occupant Loans on < 5 Family Dwellings (A B C & D)
Number
Average Value
Number
Average Value
Number
Average Value
Number
Average Value
Number
Average Value
LOANS ORIGINATED
2
$69,285
21
$56,227
39
$56,999
3
$43,670
10
$37,707
APPLICATIONS APPROVED, NOT ACCEPTED
0
$0
0
$0
8
$56,791
1
$11,760
0
$0
APPLICATIONS DENIED
0
$0
14
$51,528
21
$69,223
3
$7,837
3
$75,583
APPLICATIONS WITHDRAWN
2
$56,265
2
$95,735
10
$59,206
0
$0
1
$36,110
FILES CLOSED FOR INCOMPLETENESS
1
$96,580
0
$0
4
$81,670
0
$0
0
$0
Aggregated Statistics For Year 2001 (Based on 2 partial tracts)
A) FHA, FSA/RHS & VA Home Purchase Loans
B) Conventional Home Purchase Loans
C) Refinancings
D) Home Improvement Loans
E) Loans on Dwellings For 5+ Families
F) Non-occupant Loans on < 5 Family Dwellings (A B C & D)
Number
Average Value
Number
Average Value
Number
Average Value
Number
Average Value
Number
Average Value
Number
Average Value
LOANS ORIGINATED
6
$62,425
22
$48,861
38
$71,074
3
$11,757
1
$87,340
8
$46,714
APPLICATIONS APPROVED, NOT ACCEPTED
0
$0
1
$27,710
11
$55,579
0
$0
0
$0
2
$28,135
APPLICATIONS DENIED
0
$0
13
$49,936
13
$42,701
8
$13,961
0
$0
2
$10,500
APPLICATIONS WITHDRAWN
0
$0
2
$49,970
8
$60,465
1
$12,600
0
$0
2
$82,300
FILES CLOSED FOR INCOMPLETENESS
0
$0
0
$0
3
$68,023
1
$31,070
0
$0
1
$53,750
Aggregated Statistics For Year 2000 (Based on 2 partial tracts)
A) FHA, FSA/RHS & VA Home Purchase Loans
B) Conventional Home Purchase Loans
C) Refinancings
D) Home Improvement Loans
E) Loans on Dwellings For 5+ Families
F) Non-occupant Loans on < 5 Family Dwellings (A B C & D)
Number
Average Value
Number
Average Value
Number
Average Value
Number
Average Value
Number
Average Value
Number
Average Value
LOANS ORIGINATED
1
$49,550
22
$41,341
17
$56,316
3
$8,117
2
$14,695
8
$33,068
APPLICATIONS APPROVED, NOT ACCEPTED
0
$0
9
$38,538
9
$44,696
1
$96,580
0
$0
1
$12,600
APPLICATIONS DENIED
1
$57,110
34
$49,054
20
$46,945
4
$25,825
0
$0
4
$28,762
APPLICATIONS WITHDRAWN
0
$0
3
$91,817
6
$46,608
0
$0
0
$0
0
$0
FILES CLOSED FOR INCOMPLETENESS
0
$0
0
$0
1
$43,670
0
$0
0
$0
0
$0
Aggregated Statistics For Year 1999 (Based on 1 partial tract)
A) FHA, FSA/RHS & VA Home Purchase Loans
B) Conventional Home Purchase Loans
C) Refinancings
D) Home Improvement Loans
E) Loans on Dwellings For 5+ Families
F) Non-occupant Loans on < 5 Family Dwellings (A B C & D)
Detailed PMIC statistics for the following Tracts:0210.00
2002 - 2018 National Fire Incident Reporting System (NFIRS) incidents
Based on the data from the years 2002 - 2018 the average number of fires per year is 20. The highest number of reported fires - 40 took place in 2003, and the least - 8 in 2015. The data has a dropping trend.
When looking into fire subcategories, the most incidents belonged to: Outside Fires (54.0%), and Structure Fires (29.8%).
Fire incident types reported to NFIRS in Zip Code 56542


 Nearest zip codes: 56651, 56556, 56557, 56646, 56516, 56592.


 Based on the data from the years 2002 - 2018 the average number of fires per year is 20. The highest number of reported fires - 40 took place in 2003, and the least - 8 in 2015. The data has a dropping trend.
 When looking into fire subcategories, the most incidents belonged to: Outside Fires (54.0%), and Structure Fires (29.8%).