Estimated zip code population in 2022: 51,399 Zip code population in 2010: 39,852 Zip code population in 2000: 27,845
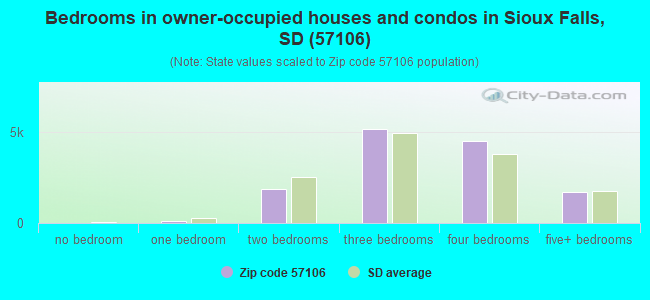
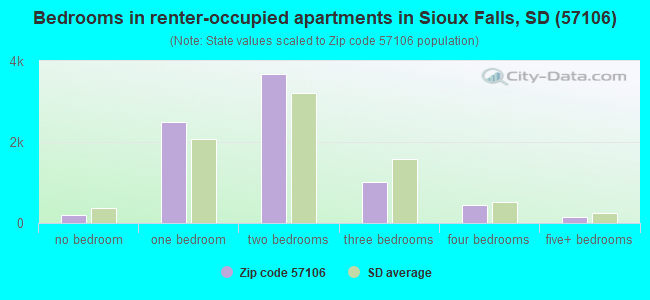
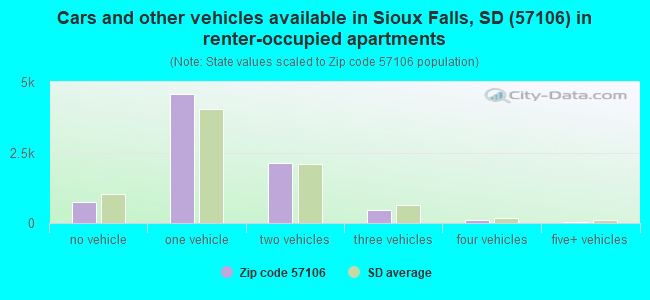
Houses and condos: 21,535 Renter-occupied apartments: 8,018
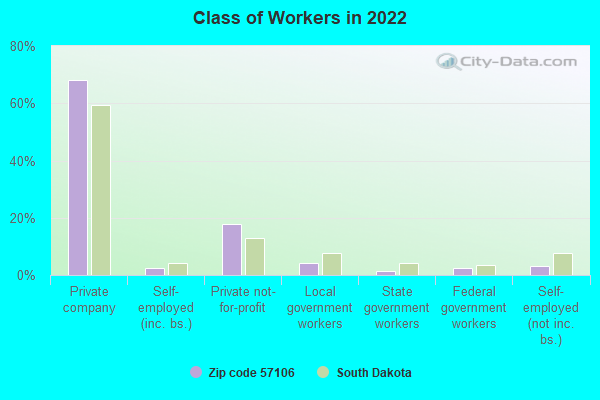
% of renters here:
37%
State:
30%
March 2022 cost of living index in zip code 57106: 81.7 (low, U.S. average is 100)
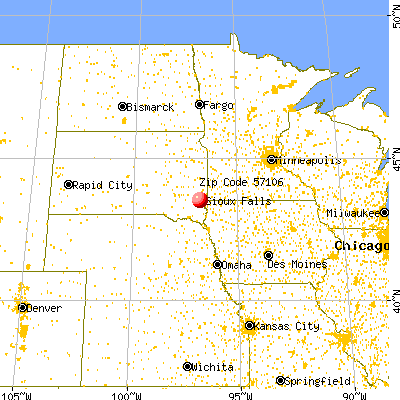
Land area: 30.1 sq. mi. Water area: 0.1 sq. mi.
Population density: 1,705 people per square mile
(low).
OSM Map
General Map
Google Map
MSN Map
OSM Map
General Map
Google Map
MSN Map
OSM Map
General Map
Google Map
MSN Map
OSM Map
General Map
Google Map
MSN Map
Please wait while loading the map...
Real estate property taxes paid for housing units in 2022:
This zip code:
1.1% ($2,952)
South Dakota:
1.0% ($2,481)
Median real estate property taxes paid for housing units with mortgages in 2022: $3,088 (1.1%) Median real estate property taxes paid for housing units with no mortgage in 2022: $2,706 (1.1%)
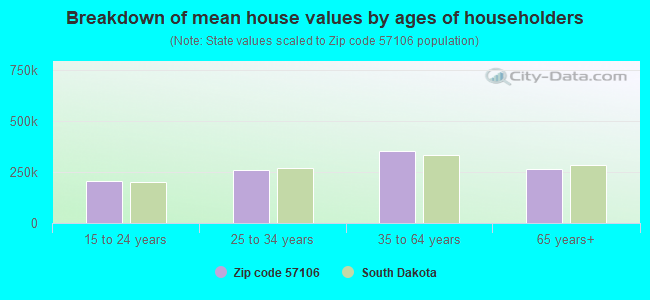
Estimated median house/condo value in 2022: $278,597
57106:
$278,597
South Dakota:
$245,000
According to our research of South Dakota and other state lists, there were 106 registered sex offenders living in 57106 zip code as of April 26, 2024. The ratio of all residents to sex offenders in zip code 57106 is 427 to 1. The ratio of registered sex offenders to all residents in this zip code is lower than the state average.
Median resident age:
This zip code:
34.8 years
South Dakota median age:
38.5 years
Average household size:
This zip code:
2.4 people
South Dakota:
2.4 people
Averages for the 2020 tax year for zip code 57106, filed in 2021:
Average Adjusted Gross Income (AGI) in 2020: $68,773 (Individual Income Tax Returns)
Here:
$68,773
State:
$75,230
Salary/wage: $56,424 (reported on 88.2% of returns)
Here:
$56,424
State:
$54,824
(% of AGI for various income ranges: 1241.8% for AGIs below $25k, 3725.6% for AGIs $25k-50k, 6572.1% for AGIs $50k-75k, 9606.7% for AGIs $75k-100k, 17085.4% for AGIs $100k-200k, 68923.6% for AGIs over 200k)
Taxable interest for individuals: $1,494 (reported on 26.9% of returns)
This zip code:
$1,494
South Dakota:
$2,207
(% of AGI for various income ranges: 14.3% for AGIs below $25k, 15.4% for AGIs $25k-50k, 32.5% for AGIs $50k-75k, 53.9% for AGIs $75k-100k, 91.6% for AGIs $100k-200k, 1805.5% for AGIs over 200k)
Ordinary dividends: $3,566 (reported on 18.2% of returns)
Here:
$3,566
State:
$6,303
(% of AGI for various income ranges: 20.7% for AGIs below $25k, 29.6% for AGIs $25k-50k, 47.2% for AGIs $50k-75k, 96.7% for AGIs $75k-100k, 185.9% for AGIs $100k-200k, 2423.6% for AGIs over 200k)
Net capital gain/loss in AGI: +$23,205 (reported on 16.3% of returns)
Here:
+$23,205
State:
+$27,098
(% of AGI for various income ranges: 12.3% for AGIs below $25k, 21.5% for AGIs $25k-50k, 56.2% for AGIs $50k-75k, 118.6% for AGIs $75k-100k, 414.0% for AGIs $100k-200k, 34395.9% for AGIs over 200k)
Profit/loss from business: +$13,320 (reported on 12.3% of returns)
Here:
+$13,320
State:
+$13,092
(% of AGI for various income ranges: 57.8% for AGIs below $25k, 99.7% for AGIs $25k-50k, 175.6% for AGIs $50k-75k, 274.3% for AGIs $75k-100k, 492.6% for AGIs $100k-200k, 4099.5% for AGIs over 200k)
Taxable individual retirement arrangement distribution: $15,898 (reported on 8.5% of returns)
57106:
$15,898
South Dakota:
$17,605
(% of AGI for various income ranges: 60.9% for AGIs below $25k, 78.2% for AGIs $25k-50k, 132.6% for AGIs $50k-75k, 256.7% for AGIs $75k-100k, 434.5% for AGIs $100k-200k, 2760.9% for AGIs over 200k)
Self-employed (Keogh) retirement plans: $22,771 (reported on 0.3% of returns)
57106:
$22,771
South Dakota:
$23,315
(% of AGI for various income ranges: 24.6% for AGIs $100k-200k, 460.9% for AGIs over 200k)
Total itemized deductions: $34,790 (reported on 4.1% of returns)
Here:
$34,790
State:
$43,941
(% of AGI for various income ranges: 31.8% for AGIs below $25k, 78.6% for AGIs $25k-50k, 163.3% for AGIs $50k-75k, 210.2% for AGIs $75k-100k, 324.2% for AGIs $100k-200k, 5268.2% for AGIs over 200k)
Charity contributions: $13,432 (reported on 3.3% of returns)
Here:
$13,432
State:
$21,682
(% of AGI for various income ranges: 1.3% for AGIs below $25k, 9.7% for AGIs $25k-50k, 29.5% for AGIs $50k-75k, 36.6% for AGIs $75k-100k, 100.7% for AGIs $100k-200k, 2750.0% for AGIs over 200k)
Taxes paid: $6,138 (reported on 4.0% of returns)
57106:
$6,138
State:
$6,525
(% of AGI for various income ranges: 3.2% for AGIs below $25k, 12.7% for AGIs $25k-50k, 27.3% for AGIs $50k-75k, 38.5% for AGIs $75k-100k, 70.5% for AGIs $100k-200k, 823.6% for AGIs over 200k)
Earned income credit: $2,083 (reported on 12.2% of returns)
Here:
$2,083
State:
$2,165
(% of AGI for various income ranges: 70.9% for AGIs below $25k, 45.8% for AGIs $25k-50k, 1.7% for AGIs $50k-75k)
Percentage of individuals using paid preparers for their 2020 taxes: 95.3%
Here:
95%
State:
95%
(% for various income ranges: 93.4% for AGIs below $25k, 95.8% for AGIs $25k-50k, 95.7% for AGIs $50k-75k, 95.8% for AGIs $75k-100k, 96.6% for AGIs $100k-200k, 97.1% for AGIs over 200k)
Averages for the 2012 tax year for zip code 57106, filed in 2013:
Average Adjusted Gross Income (AGI) in 2012: $54,290 (Individual Income Tax Returns)
Here:
$54,290
State:
$58,425
Salary/wage: $44,855 (reported on 85.6% of returns)
Here:
$44,855
State:
$41,676
(% of AGI for various income ranges: 81.5% for AGIs below $25k, 81.1% for AGIs $25k-50k, 75.9% for AGIs $50k-75k, 75.7% for AGIs $75k-100k, 72.8% for AGIs $100k-200k, 37.5% for AGIs over 200k)
Taxable interest for individuals: $1,473 (reported on 33.0% of returns)
This zip code:
$1,473
South Dakota:
$2,148
(% of AGI for various income ranges: 1.3% for AGIs below $25k, 0.7% for AGIs $25k-50k, 0.8% for AGIs $50k-75k, 0.8% for AGIs $75k-100k, 0.8% for AGIs $100k-200k, 1.3% for AGIs over 200k)
Ordinary dividends: $3,855 (reported on 20.4% of returns)
Here:
$3,855
State:
$6,197
(% of AGI for various income ranges: 2.5% for AGIs below $25k, 1.5% for AGIs $25k-50k, 1.3% for AGIs $50k-75k, 1.0% for AGIs $75k-100k, 1.2% for AGIs $100k-200k, 2.0% for AGIs over 200k)
Net capital gain/loss in AGI: +$9,526 (reported on 16.0% of returns)
Here:
+$9,526
State:
+$21,273
(% of AGI for various income ranges: 0.3% for AGIs $25k-50k, 0.4% for AGIs $50k-75k, 0.9% for AGIs $75k-100k, 1.8% for AGIs $100k-200k, 14.0% for AGIs over 200k)
Profit/loss from business: +$12,135 (reported on 12.2% of returns)
Here:
+$12,135
State:
+$11,552
(% of AGI for various income ranges: 4.2% for AGIs below $25k, 2.8% for AGIs $25k-50k, 2.3% for AGIs $50k-75k, 2.6% for AGIs $75k-100k, 2.8% for AGIs $100k-200k, 2.4% for AGIs over 200k)
Taxable individual retirement arrangement distribution: $15,200 (reported on 11.3% of returns)
57106:
$15,200
South Dakota:
$12,416
(% of AGI for various income ranges: 3.4% for AGIs below $25k, 2.6% for AGIs $25k-50k, 3.3% for AGIs $50k-75k, 3.1% for AGIs $75k-100k, 3.8% for AGIs $100k-200k, 2.7% for AGIs over 200k)
Self-employment retirement plans: $14,400 (reported on 0.3% of returns)
57106:
$14,400
South Dakota:
$19,291
Total itemized deductions: $18,431 (19% of AGI, reported on 24.7% of returns)
Here:
$18,431
State:
$21,763
Here:
18.7% of AGI
State:
16.0% of AGI
(% of AGI for various income ranges: 6.8% for AGIs below $25k, 7.4% for AGIs $25k-50k, 8.5% for AGIs $50k-75k, 8.5% for AGIs $75k-100k, 9.8% for AGIs $100k-200k, 7.9% for AGIs over 200k)
Charity contributions: $3,944 (reported on 19.7% of returns)
Here:
$3,944
State:
$5,927
(% of AGI for various income ranges: 0.6% for AGIs below $25k, 0.8% for AGIs $25k-50k, 1.1% for AGIs $50k-75k, 1.3% for AGIs $75k-100k, 2.1% for AGIs $100k-200k, 2.3% for AGIs over 200k)
Taxes paid: $4,393 (reported on 24.3% of returns)
57106:
$4,393
State:
$5,214
(% of AGI for various income ranges: 1.1% for AGIs below $25k, 1.5% for AGIs $25k-50k, 1.8% for AGIs $50k-75k, 2.0% for AGIs $75k-100k, 2.7% for AGIs $100k-200k, 2.1% for AGIs over 200k)
Earned income credit: $1,996 (reported on 12.4% of returns)
Here:
$1,996
State:
$2,081
(% of AGI for various income ranges: 4.1% for AGIs below $25k, 0.7% for AGIs $25k-50k)
Percentage of individuals using paid preparers for their 2012 taxes: 46.0%
Here:
46%
State:
55%
(% for various income ranges: 39.6% for AGIs below $25k, 42.0% for AGIs $25k-50k, 50.1% for AGIs $50k-75k, 51.9% for AGIs $75k-100k, 59.5% for AGIs $100k-200k, 82.9% for AGIs over 200k)
Averages for the 2004 tax year for zip code 57106, filed in 2005:
Average Adjusted Gross Income (AGI) in 2004: $44,537 (Individual Income Tax Returns)
Here:
$44,537
State:
$41,242
Salary/wage: $37,577 (reported on 87.0% of returns)
Here:
$37,577
State:
$32,969
(% of AGI for various income ranges: 115.9% for AGIs below $10k, 80.7% for AGIs $10k-25k, 81.2% for AGIs $25k-50k, 79.2% for AGIs $50k-75k, 79.4% for AGIs $75k-100k, 52.3% for AGIs over 100k)
Taxable interest for individuals: $1,749 (reported on 41.0% of returns)
This zip code:
$1,749
South Dakota:
$2,098
(% of AGI for various income ranges: 5.3% for AGIs below $10k, 2.5% for AGIs $10k-25k, 1.4% for AGIs $25k-50k, 1.3% for AGIs $50k-75k, 1.3% for AGIs $75k-100k, 1.7% for AGIs over 100k)
Taxable dividends: $1,861 (reported on 25.4% of returns)
Here:
$1,861
State:
$2,577
(% of AGI for various income ranges: 3.8% for AGIs below $10k, 1.3% for AGIs $10k-25k, 1.0% for AGIs $25k-50k, 0.8% for AGIs $50k-75k, 1.0% for AGIs $75k-100k, 1.2% for AGIs over 100k)
Net capital gain/loss: +$6,740 (reported on 20.5% of returns)
Here:
+$6,740
State:
+$11,418
(% of AGI for various income ranges: -1.2% for AGIs below $10k, -0.0% for AGIs $10k-25k, 0.4% for AGIs $25k-50k, 0.9% for AGIs $50k-75k, 1.7% for AGIs $75k-100k, 9.8% for AGIs over 100k)
Profit/loss from business: +$9,025 (reported on 12.8% of returns)
Here:
+$9,025
State:
+$9,138
(% of AGI for various income ranges: -0.9% for AGIs below $10k, 2.6% for AGIs $10k-25k, 2.6% for AGIs $25k-50k, 2.8% for AGIs $50k-75k, 2.6% for AGIs $75k-100k, 2.6% for AGIs over 100k)
Profit/loss from farming: +$2,246 (reported on 0.7% of returns)
Here:
+$2,246
State:
-$429
(% of AGI for various income ranges: -0.9% for AGIs below $10k, 0.0% for AGIs $10k-25k, -0.1% for AGIs $25k-50k, -0.0% for AGIs $50k-75k, -0.0% for AGIs $75k-100k, 0.3% for AGIs over 100k)
IRA payment deduction: $2,904 (reported on 2.5% of returns)
57106:
$2,904
South Dakota:
$3,029
(% of AGI for various income ranges: 0.2% for AGIs $10k-25k, 0.2% for AGIs $25k-50k, 0.2% for AGIs $50k-75k, 0.1% for AGIs $75k-100k, 0.1% for AGIs over 100k)
Self-employed pension: $9,737 (reported on 0.5% of returns)
Here:
$9,737
South Dakota:
$13,863
(% of AGI for various income ranges: 0.0% for AGIs $25k-50k, 0.1% for AGIs $50k-75k, 0.1% for AGIs $75k-100k, 0.3% for AGIs over 100k)
Total itemized deductions: $15,175 (20% of AGI, reported on 29.8% of returns)
Here:
$15,175
State:
$17,139
Here:
20.4% of AGI
State:
19.0% of AGI
(% of AGI for various income ranges: 12.5% for AGIs below $10k, 7.7% for AGIs $10k-25k, 9.7% for AGIs $25k-50k, 10.5% for AGIs $50k-75k, 12.4% for AGIs $75k-100k, 9.6% for AGIs over 100k)
Charity contributions deductions: $2,770 (4% of AGI, reported on 25.9% of returns)
Here:
$2,770
State:
$4,114
Here:
3.5% of AGI
State:
4.2% of AGI
(% of AGI for various income ranges: 0.6% for AGIs below $10k, 0.6% for AGIs $10k-25k, 1.1% for AGIs $25k-50k, 1.5% for AGIs $50k-75k, 2.0% for AGIs $75k-100k, 2.3% for AGIs over 100k)
Total tax: $6,044 (reported on 80.4% of returns)
57106:
$6,044
State:
$6,372
(% of AGI for various income ranges: 2.3% for AGIs below $10k, 4.4% for AGIs $10k-25k, 7.5% for AGIs $25k-50k, 8.5% for AGIs $50k-75k, 10.2% for AGIs $75k-100k, 19.4% for AGIs over 100k)
Earned income credit: $1,540 (reported on 9.8% of returns)
Here:
$1,540
State:
$1,607
Percentage of individuals using paid preparers for their 2004 taxes: 52.8%
Here:
53%
State:
63%
(% for various income ranges: 42.5% for AGIs below $10k, 53.3% for AGIs $10k-25k, 52.2% for AGIs $25k-50k, 55.0% for AGIs $50k-75k, 58.4% for AGIs $75k-100k, 67.5% for AGIs over 100k)
Likely homosexual households (counted as self-reported same-sex unmarried-partner households)
Lesbian couples: 0.2% of all households
Gay men: 0.0% of all households
Household received Food Stamps/SNAP in the past 12 months: 1,755 Household did not receive Food Stamps/SNAP in the past 12 months: 19,758
Women who had a birth in the past 12 months: 1,108 (774 now married, 319 unmarried) Women who did not have a birth in the past 12 months: 11,196 (5,665 now married, 5,561 unmarried)
Housing units in zip code 57106 with a mortgage: 9,100 (1,149 second mortgage, 1 home equity loan, 996 both second mortgage and home equity loan) Houses without a mortgage: 22
Median monthly owner costs for units with a mortgage: $1,615 Median monthly owner costs for units without a mortgage: $571
Residents with income below the poverty level in 2022:
This zip code:
7.2%
Whole state:
12.5%
Residents with income below 50% of the poverty level in 2022:
This zip code:
4.3%
Whole state:
6.8%
Median number of rooms in houses and condos:
Here:
7.1
State:
7.0
Median number of rooms in apartments:
Here:
4.0
State:
4.1
Notable locations in this zip code not listed on our city pages
Notable locations in zip code 57106: Sherman Park Mounds (A), Sioux Falls Fire Rescue Station 6 (B), Caille Branch Library (C). Display/hide their locations on the map
Tourist attractions (not listed on the city page) : Valley West Shooting Complex (Water Parks & Slides; 26767 466th Avenue) (1), Sertoma Butterfly House (Amusement & Theme Parks; 4320 South Oxbow Avenue) (2), Wild Water West Waterpark (26767 466th Avenue) (3). Display/hide their approximate locations on the map
9,856 married couples with children.
2,740 single-parent households (648 men, 2,092 women).
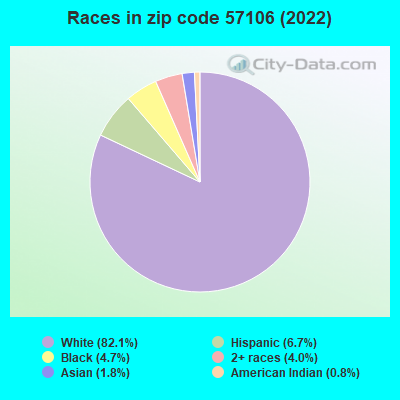
90.3% of residents of 57106 zip code speak English at home.
4.3% of residents speak Spanish at home (70% very well, 11% well, 15% not well, 4% not at all).
3.3% of residents speak other Indo-European language at home (75% very well, 19% well, 6% not well).
0.2% of residents speak Asian or Pacific Island language at home (85% very well, 15% well).
1.9% of residents speak other language at home (88% very well, 7% well, 1% not well, 4% not at all).
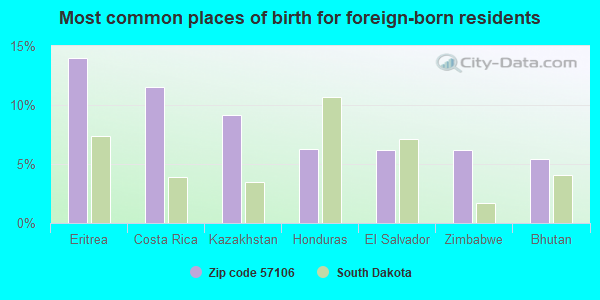
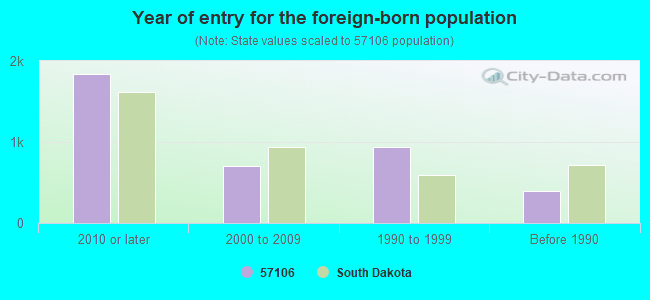
Foreign born population: 3,288 (6.4%) (53.8% of them are naturalized citizens)
Major facilities with environmental interests located in this zip code:
WAL-MART STORE NUMBER 1535 (3209 SOUTH LOUISE AVENUE in SIOUX FALLS, SD)
ENFORCEMENT/COMPLIANCE ACTIVITY (Integrated Compliance Information System) - ICIS-08-2004-0084, FORMAL ENFORCEMENT ACTION (Integrated Compliance Information System) - ICIS-08-2004-0084, FORMAL ENFORCEMENT ACTION Conditionally Exempt Small Quantity Generators, less than 100 kg/month of hazardous waste (Resource Conservation and Recovery Act (tracking hazardous waste)) - notification Business SIC classification: GENERAL CONTRACTORS-NONRESIDENTIAL BUILDINGS, OTHER THAN INDUSTRIAL BUILDINGS AND WAREHOUSES Organizations: WAL MART STORES INC (CONTACT/OWNER)
Alternative names: WAL-MART STORE NO. 1535-02, WAL-MART STORE # 1535-02
ROOSEVELT HI SCH (6600 W 41ST ST in SIOUX FALLS, SD)
(National Center for Education Statistics) - STATE ID-3 Organizations: SIOUX FALLS SCHOOL DISTRICT 49-5 (SCHOOL DISTRICT)
OSCAR HOWE ELEM (2801 VALLEY VIEW RD in SIOUX FALLS, SD)
(National Center for Education Statistics) - STATE ID-58 Organizations: SIOUX FALLS SCHOOL DISTRICT 49-5 (SCHOOL DISTRICT)
GAGE BROTHERS CONCRETE PRODUCTS INCORPORATED (4301 W. 12TH ST. in SIOUX FALLS, SD)
(Integrated Compliance Information System) - ICIS-08-2003-0034, FORMAL ENFORCEMENT ACTION TRI REPORTER (Tracking of toxic chemicals releasing facilities) Business SIC classification: CONCRETE PRODUCTS, EXCEPT BLOCK AND BRICK
JOHN F KENNEDY ELEM (4501 S HOLBROOK in SIOUX FALLS, SD)
(National Center for Education Statistics) - STATE ID-57 Organizations: SIOUX FALLS SCHOOL DISTRICT 49-5 (SCHOOL DISTRICT)
MEMORIAL MIDDLE SCH (1401 S SERTOMA in SIOUX FALLS, SD)
(National Center for Education Statistics) - STATE ID-4 Organizations: SIOUX FALLS SCHOOL DISTRICT 49-5 (SCHOOL DISTRICT)
TIRES PLUS SIOUX FALLS (3516 WEST 41ST STREET in SIOUX FALLS, SD)
(Resource Conservation and Recovery Act (tracking hazardous waste)) Organizations: TIRES PLUS GROUPE (CONTACT/OWNER)
ZABEL BATTERY SITE (400 E 10TH ST in SIOUX FALLS, SD)
(Integrated Compliance Information System) - ICIS-08-1996-0133, FORMAL ENFORCEMENT ACTION Business SIC classification: STORAGE BATTERIES
BUTLER MACHINERY COMPANY (3201 N LOUISE AVE in SIOUX FALLS, SD)
Conditionally Exempt Small Quantity Generators, less than 100 kg/month of hazardous waste (Resource Conservation and Recovery Act (tracking hazardous waste)) USED OIL PROGRAM (Resource Conservation and Recovery Act (tracking hazardous waste)) Organizations: JIM ROBERTS (CONTACT/OPERATOR)
, MATT BUTLER (CONTACT/OWNER)
, DAN BUTLER (CONTACT/OWNER)
DEA - CLANDESTINE METH LAB CLEANUPS (5801 WEST 12TH STREET in SIOUX FALLS, SD)
(Resource Conservation and Recovery Act (tracking hazardous waste))
ABACO CLEANERS #2 (3502 WEST 41ST STREET SUITE 2 in SIOUX FALLS, SD)
(Resource Conservation and Recovery Act (tracking hazardous waste)) Organizations: SCOTT, DON (CONTACT/OWNER)
BILLION MOTORS, INCORPORATED/CHRYSLER PLYMOUTH-NISSAN (3401 WEST 41ST STREET in SIOUX FALLS, SD)
(Resource Conservation and Recovery Act (tracking hazardous waste)) Organizations: BILLION CHRYSLER PLY DAT,HENRY BILLION (CONTACT/OWNER)
Alternative names: BILLION CHRYSLER PLYMOUTH & DATSUN
TARGET STORE #0076 - SIOUX FALLS (3600 SOUTH LOUISE AVENUE in SIOUX FALLS, SD)
Conditionally Exempt Small Quantity Generators, less than 100 kg/month of hazardous waste (Resource Conservation and Recovery Act (tracking hazardous waste)) Organizations: TARGET CORPORATION (CONTACT/OPERATOR)
Housing units lacking complete plumbing facilities: 0.2% Housing units lacking complete kitchen facilities: 0.3%
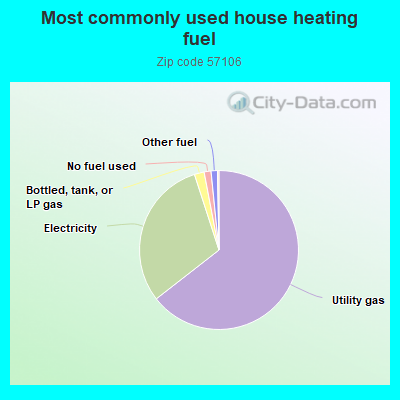
64.6%Utility gas
30.6%Electricity
2.0%Bottled, tank, or LP gas
1.4%No fuel used
1.3%Other fuel
Population in 1990: 16,823. Population change in the 1990s: +11,022 (+65.5%).
Place of birth for U.S.-born residents:
This state: 30,262
Northeast: 968
Midwest: 11,567
South: 1,559
West: 3,045
41% of the 57106 zip code residents lived in the same house 5 years ago. Out of people who lived in different houses, 50% lived in this county. Out of people who lived in different counties, 50% lived in South Dakota.
86% of the 57106 zip code residents lived in the same house 1 year ago. Out of people who lived in different houses, 48% moved from this county. Out of people who lived in different houses, 22% moved from different county within same state. Out of people who lived in different houses, 21% moved from different state. Out of people who lived in different houses, 7% moved from abroad.
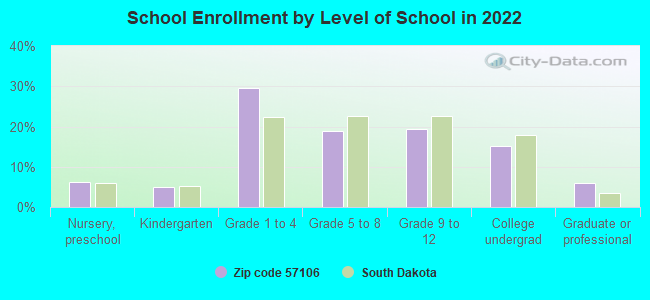
Private vs. public school enrollment:
Students in private schools in grades 1 to 8 (elementary and middle school): 818
Here:
13.2%
South Dakota:
11.9%
Students in private schools in grades 9 to 12 (high school): 327
Here:
13.6%
South Dakota:
7.2%
Students in private undergraduate colleges: 249
Here:
13.1%
South Dakota:
10.2%
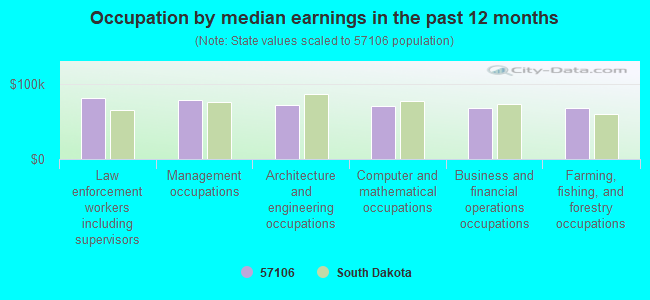
Occupation by median earnings in the past 12 months ($)
80,982Law enforcement workers including supervisors
78,704Management occupations
71,301Architecture and engineering occupations
70,633Computer and mathematical occupations
67,975Business and financial operations occupations
67,644Farming, fishing, and forestry occupations
Companies with biggest federal contracts located in this zip code (SIOUX FALLS, SD):
GOOD SAMARITAN CENTER (4800 W 57TH ST) 175 employees, $4400000 revenue: $379,178 in 16 contractsfrom 2001 to 2003
Contracts for Nursing Home Care Contracts by Department of Veterans Affairs Signed by year:2000: $0; 2001: $23,000; 2002: $42,000; 2003: $314,178; 2004: $0; 2005: $0; 2006: $0.
Biggest contracts:
$78,400 with Department of Veterans Affairs for Nursing Home Care Contracts. Taking place in KS. Signed on 2003-07-15. Completion date: 2003-09-15.
$51,595, same as above.Signed on 2003-07-15. Completion date: 2003-09-15.
$43,506, same as above.Signed on 2003-07-15. Completion date: 2003-09-15.
$39,000 with Department of Veterans Affairs for Nursing Home Care Contracts. Taking place in OR. Signed on 2002-01-15. Completion date: 2002-09-15.
GUARANTEE ROOFING OF SD, INC (500 SOUTH MARION ROAD; small business) : $295,039 in 4 contractsfrom 2003 to 2005
$134,538 with Army for Maintenance, Repair or Alteration of Real Property -- Other Airfield Structures. Signed on 2003-09-25. Completion date: 2003-12-15.
$61,882 with U.S. Army Corps of Engineers - civil program financing only for Construction of Structures and Facilities -- Recreational Buildings. Taking place in NE. Signed on 2004-09-01. Completion date: 2004-09-30.
$61,882 with Army for Construction of Structures and Facilities -- Recreational Buildings. Taking place in NE. Signed on 2004-09-01. Completion date: 2004-09-30.
$36,737 with Army for Maintenance, Repair or Alteration of Real Property -- Miscellaneous Buildings. Signed on 2005-10-21. Completion date: 2005-12-19.
SITA, INC (4545 WEST HOMEFIELD DR; small business)
$86,681 with Army for Lodging - Hotel/Motel. Signed on 2004-09-22. Completion date: 2004-10-01.
MCTIGHE INDUSTRIES: A DIVISION (3405 S WESTPORT AVE; small business)
$71,516 with U.S. Army Corps of Engineers - civil program financing only for Centrifugals, Separators, and Pressure and Vacuum Filters. Taking place in OR. Signed on 2003-01-31. Completion date: 2003-03-13.
DITCH WITCH OF SOUTH DAKOTA, I (27124 PARKLANE DRIVE; small business) : $55,062 in 3 contractsfrom 2002 to 2003
$32,062 with Army for Lease or Rental of Equipment -- Construction, Mining, Excavating, and Highway Maintenance Equipment. Signed on 2002-11-06. Completion date: 2002-07-19.
$13,400, same as above.Signed on 2002-07-16. Completion date: 2002-07-19.
$9,600 with Air Force for Lease or Rental of Equipment -- Construction, Mining, Excavating, and Highway Maintenance Equipment. Signed on 2003-07-28. Completion date: 2003-09-11.
PFEIFER IMPLEMENT CO INC (5301 W 12TH ST; small business) : $43,428 in 2 contractsin 2005
$21,714 with Army for Miscellaneous Items. Signed on 2005-08-18. Completion date: 2005-08-31.
$21,714 with U.S. Army Corps of Engineers - civil program financing only for Miscellaneous Items. Signed on 2005-08-18. Completion date: 2005-08-31.
CHARLES COLLINS (3700 S WESTPORT, #3454; small business) : $31,920 in 8 contractsfrom 2002 to 2006
Contracts for Other Housekeeping Services by Army, U.S. Army Corps of Engineers - civil program financing only Signed by year:2000: $0; 2001: $0; 2002: $12,160; 2003: $1,120; 2004: $14,640; 2005: $320; 2006: $3,680.
Biggest contracts:
$7,320 with Army for Other Housekeeping Services. Taking place in MO. Signed on 2004-12-03. Completion date: 2005-09-30.
$7,320 with U.S. Army Corps of Engineers - civil program financing only for Other Housekeeping Services. Taking place in MO. Signed on 2004-12-03. Completion date: 2005-09-30.
$6,360, same as above.Signed on 2002-10-01. Completion date: 2002-09-30.
$5,800, same as above.Signed on 2002-02-25. Completion date: 2002-09-30.
KASEY WILLIAM ABBOTT (3211 SOUTH CAROLYN AVENUE; small business)
$31,264 with Air Force for Hand Tools, Nonedged, Nonpowered. Signed on 2001-04-24. Completion date: 2001-06-30.
NELSON ARLENE (3700 S WESTPORT #1304; small business) : $29,520 in 2 contractsin 2004
$14,760 with Army for Surveillance Services. Taking place in TN. Signed on 2004-02-04. Completion date: 2004-02-04.
$14,760 with U.S. Army Corps of Engineers - civil program financing only for Surveillance Services. Taking place in TN. Signed on 2004-02-04. Completion date: 2004-02-04.
ROBERT E EATON (3700 S WESTPORT AVE # 1296) : $23,800 in 2 contractsin 2005
$11,900 with U.S. Army Corps of Engineers - civil program financing only for Trash/Garbage Collection Services - Including Portable Sanitation Services. Taking place in TX. Signed on 2005-03-30. Completion date: 2005-03-31.
$11,900 with Army for Trash/Garbage Collection Services - Including Portable Sanitation Services. Taking place in TX. Signed on 2005-03-30. Completion date: 2005-03-31.
Top industries in this zip code by the number of employees in 2005:
2002 - 2018 National Fire Incident Reporting System (NFIRS) incidents
According to the data from the years 2002 - 2018 the average number of fires per year is 66. The highest number of fire incidents - 143 took place in 2002, and the least - 38 in 2016. The data has a decreasing trend.
When looking into fire subcategories, the most incidents belonged to: Structure Fires (36.1%), and Outside Fires (23.2%).
Fire incident types reported to NFIRS in Zip Code 57106


+$2,246
-$429
(% of AGI for various income ranges: -0.9% for AGIs below $10k, 0.0% for AGIs $10k-25k, -0.1% for AGIs $25k-50k, -0.0% for AGIs $50k-75k, -0.0% for AGIs $75k-100k, 0.3% for AGIs over 100k)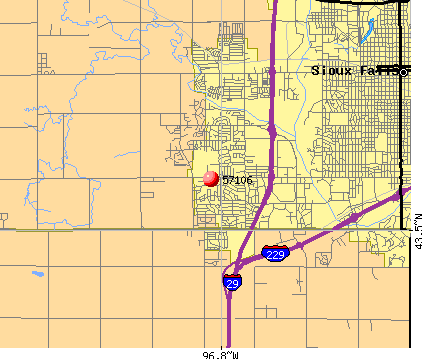 Nearest zip codes: 57064, 57117, 57107, 57197, 57105, 57108.


 According to the data from the years 2002 - 2018 the average number of fires per year is 66. The highest number of fire incidents - 143 took place in 2002, and the least - 38 in 2016. The data has a decreasing trend.
 When looking into fire subcategories, the most incidents belonged to: Structure Fires (36.1%), and Outside Fires (23.2%).