Estimated zip code population in 2022: 2,036 Zip code population in 2010: 2,370 Zip code population in 2000: 2,301
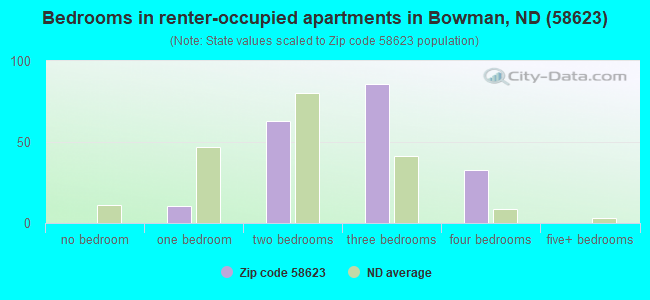
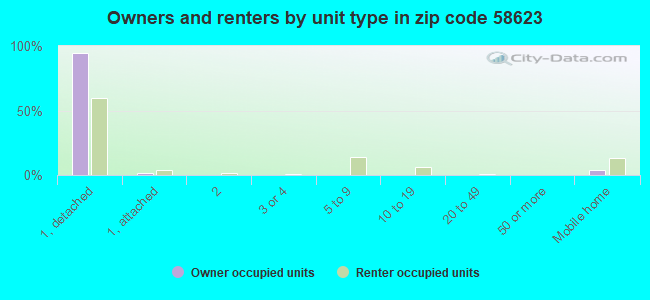
Houses and condos: 1,094 Renter-occupied apartments: 194
% of renters here:
24%
State:
35%
March 2022 cost of living index in zip code 58623: 80.3 (low, U.S. average is 100)
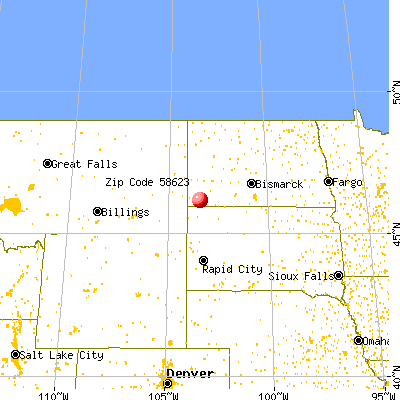
Land area: 582.4 sq. mi. Water area: 2.8 sq. mi.
Population density: 3 people per square mile
(very low).
OSM Map
General Map
Google Map
MSN Map
OSM Map
General Map
Google Map
MSN Map
OSM Map
General Map
Google Map
MSN Map
OSM Map
General Map
Google Map
MSN Map
Please wait while loading the map...
Real estate property taxes paid for housing units in 2022:
This zip code:
0.8% ($1,537)
North Dakota:
1.0% ($2,347)
Median real estate property taxes paid for housing units with mortgages in 2022: $1,466 (0.8%) Median real estate property taxes paid for housing units with no mortgage in 2022: $1,614 (0.9%)
Business Search- 14 Million verified businesses
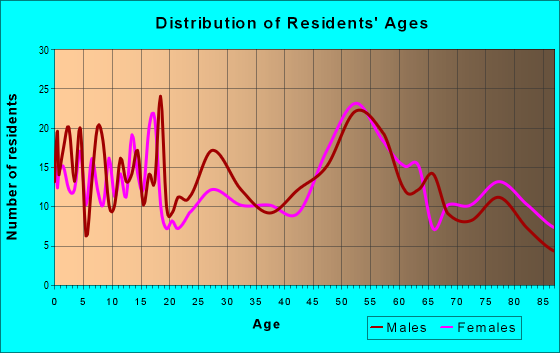
Males: 1,005
(49.4%)
Females: 1,030
(50.6%)
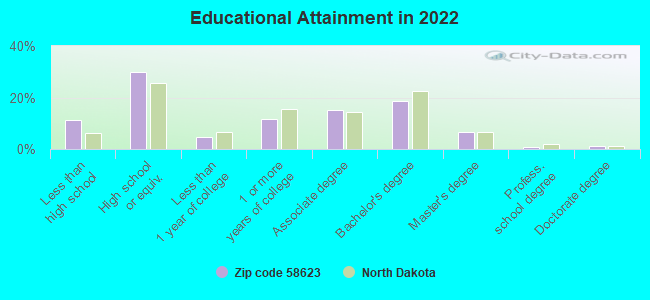
For population 25 years and over in 58623:
High school or higher: 87.2%
Bachelor's degree or higher: 27.0%
Graduate or professional degree: 8.6%
Unemployed: 3.9%
Mean travel time to work (commute): 13.3 minutes
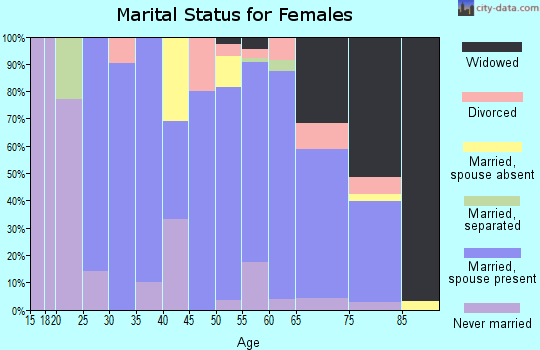
For population 15 years and over in 58623:
Never married: 28.4%
Now married: 51.5%
Separated: 0.0%
Widowed: 8.8%
Divorced: 11.3%
Zip code 58623 compared to state average:
Unemployed percentage above state average.
Black race population percentage significantly below state average.
Hispanic race population percentage above state average.
Median age above state average.
Foreign-born population percentage significantly below state average.
Length of stay since moving in significantly above state average.
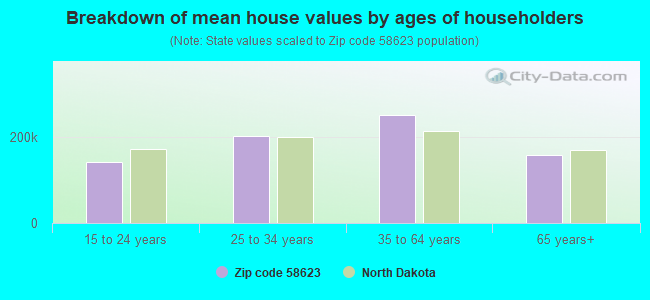
Estimated median house/condo value in 2022: $189,566
58623:
$189,566
North Dakota:
$243,100
Median resident age:
This zip code:
41.5 years
North Dakota median age:
36.2 years
Average household size:
This zip code:
2.4 people
North Dakota:
2.3 people
Averages for the 2020 tax year for zip code 58623, filed in 2021:
Average Adjusted Gross Income (AGI) in 2020: $77,350 (Individual Income Tax Returns)
Here:
$77,350
State:
$77,891
Salary/wage: $52,680 (reported on 81.3% of returns)
Here:
$52,680
State:
$59,202
(% of AGI for various income ranges: 1306.5% for AGIs below $25k, 4091.5% for AGIs $25k-50k, 7822.5% for AGIs $50k-75k, 11094.3% for AGIs $75k-100k, 20453.3% for AGIs $100k-200k)
Taxable interest for individuals: $2,177 (reported on 44.9% of returns)
This zip code:
$2,177
North Dakota:
$2,112
(% of AGI for various income ranges: 47.6% for AGIs below $25k, 56.2% for AGIs $25k-50k, 57.5% for AGIs $50k-75k, 197.1% for AGIs $75k-100k, 470.0% for AGIs $100k-200k)
Ordinary dividends: $8,053 (reported on 29.9% of returns)
Here:
$8,053
State:
$5,239
(% of AGI for various income ranges: 66.5% for AGIs below $25k, 78.5% for AGIs $25k-50k, 215.0% for AGIs $50k-75k, 261.4% for AGIs $75k-100k, 501.1% for AGIs $100k-200k)
Net capital gain/loss in AGI: +$19,806 (reported on 33.6% of returns)
Here:
+$19,806
State:
+$17,618
(% of AGI for various income ranges: 134.1% for AGIs below $25k, 143.8% for AGIs $25k-50k, 812.5% for AGIs $50k-75k, 932.9% for AGIs $75k-100k, 1757.8% for AGIs $100k-200k)
Profit/loss from business: +$18,867 (reported on 16.8% of returns)
Here:
+$18,867
State:
+$12,375
(% of AGI for various income ranges: 99.4% for AGIs below $25k, 200.0% for AGIs $25k-50k, 228.8% for AGIs $50k-75k, 350.0% for AGIs $75k-100k, 2821.1% for AGIs $100k-200k)
Taxable individual retirement arrangement distribution: $13,157 (reported on 13.1% of returns)
58623:
$13,157
North Dakota:
$19,361
(% of AGI for various income ranges: 75.9% for AGIs below $25k, 503.1% for AGIs $25k-50k, 580.0% for AGIs $75k-100k, 725.6% for AGIs $100k-200k)
Total itemized deductions: $29,133 (reported on 5.6% of returns)
Here:
$29,133
State:
$41,689
(% of AGI for various income ranges: 672.3% for AGIs $25k-50k, 971.1% for AGIs $100k-200k)
Charity contributions: $17,300 (reported on 2.8% of returns)
Here:
$17,300
State:
$18,168
(% of AGI for various income ranges: 576.7% for AGIs $100k-200k)
Taxes paid: $4,520 (reported on 4.7% of returns)
58623:
$4,520
State:
$6,420
(% of AGI for various income ranges: 50.8% for AGIs $25k-50k, 177.8% for AGIs $100k-200k)
Earned income credit: $1,827 (reported on 10.3% of returns)
Here:
$1,827
State:
$2,120
(% of AGI for various income ranges: 75.9% for AGIs below $25k, 55.4% for AGIs $25k-50k)
Percentage of individuals using paid preparers for their 2020 taxes: 92.5%
Here:
93%
State:
95%
(% for various income ranges: 86.7% for AGIs below $25k, 90.9% for AGIs $25k-50k, 93.3% for AGIs $50k-75k, 100.0% for AGIs $75k-100k, 95.2% for AGIs $100k-200k, 100.0% for AGIs over 200k)
Averages for the 2012 tax year for zip code 58623, filed in 2013:
Average Adjusted Gross Income (AGI) in 2012: $79,904 (Individual Income Tax Returns)
Here:
$79,904
State:
$70,683
Salary/wage: $47,592 (reported on 82.5% of returns)
Here:
$47,592
State:
$48,615
(% of AGI for various income ranges: 74.7% for AGIs below $25k, 73.0% for AGIs $25k-50k, 66.7% for AGIs $50k-75k, 74.2% for AGIs $75k-100k, 54.6% for AGIs $100k-200k, 19.5% for AGIs over 200k)
Taxable interest for individuals: $2,429 (reported on 42.5% of returns)
This zip code:
$2,429
North Dakota:
$1,659
(% of AGI for various income ranges: 2.6% for AGIs below $25k, 1.9% for AGIs $25k-50k, 2.3% for AGIs $50k-75k, 0.7% for AGIs $75k-100k, 1.2% for AGIs $100k-200k, 0.9% for AGIs over 200k)
Ordinary dividends: $3,062 (reported on 28.3% of returns)
Here:
$3,062
State:
$4,855
(% of AGI for various income ranges: 2.3% for AGIs below $25k, 2.0% for AGIs $25k-50k, 1.5% for AGIs $50k-75k, 0.3% for AGIs $75k-100k, 1.3% for AGIs $100k-200k, 0.8% for AGIs over 200k)
Net capital gain/loss in AGI: +$25,538 (reported on 28.3% of returns)
Here:
+$25,538
State:
+$26,078
(% of AGI for various income ranges: 2.2% for AGIs below $25k, 3.0% for AGIs $25k-50k, 4.9% for AGIs $50k-75k, 5.8% for AGIs $75k-100k, 11.2% for AGIs $100k-200k, 12.9% for AGIs over 200k)
Profit/loss from business: +$27,359 (reported on 18.3% of returns)
Here:
+$27,359
State:
+$14,112
(% of AGI for various income ranges: 4.1% for AGIs below $25k, 5.2% for AGIs $25k-50k, 6.5% for AGIs $50k-75k, 3.6% for AGIs $75k-100k, 8.5% for AGIs $100k-200k, 6.4% for AGIs over 200k)
Taxable individual retirement arrangement distribution: $10,100 (reported on 10.0% of returns)
58623:
$10,100
North Dakota:
$12,079
(% of AGI for various income ranges: 3.4% for AGIs below $25k, 1.8% for AGIs $25k-50k, 3.8% for AGIs $50k-75k, 2.0% for AGIs $100k-200k)
Total itemized deductions: $25,017 (12% of AGI, reported on 15.0% of returns)
Here:
$25,017
State:
$22,515
Here:
12.0% of AGI
State:
13.2% of AGI
(% of AGI for various income ranges: 9.1% for AGIs $25k-50k, 6.0% for AGIs $50k-75k, 3.5% for AGIs $75k-100k, 4.3% for AGIs $100k-200k, 4.4% for AGIs over 200k)
Charity contributions: $8,057 (reported on 11.7% of returns)
Here:
$8,057
State:
$5,593
(% of AGI for various income ranges: 1.6% for AGIs below $25k, 1.3% for AGIs $50k-75k, 1.7% for AGIs $100k-200k, 1.5% for AGIs over 200k)
Taxes paid: $6,500 (reported on 15.0% of returns)
58623:
$6,500
State:
$6,844
(% of AGI for various income ranges: 1.0% for AGIs $25k-50k, 0.6% for AGIs $50k-75k, 0.5% for AGIs $75k-100k, 0.7% for AGIs $100k-200k, 2.2% for AGIs over 200k)
Earned income credit: $1,700 (reported on 7.5% of returns)
Here:
$1,700
State:
$1,989
(% of AGI for various income ranges: 2.2% for AGIs below $25k, 0.7% for AGIs $25k-50k)
Percentage of individuals using paid preparers for their 2012 taxes: 75.8%
Here:
76%
State:
59%
(% for various income ranges: 66.7% for AGIs below $25k, 70.8% for AGIs $25k-50k, 84.2% for AGIs $50k-75k, 82.4% for AGIs $75k-100k, 82.4% for AGIs $100k-200k, 85.7% for AGIs over 200k)
Averages for the 2004 tax year for zip code 58623, filed in 2005:
Average Adjusted Gross Income (AGI) in 2004: $37,904 (Individual Income Tax Returns)
Here:
$37,904
State:
$40,108
Salary/wage: $27,781 (reported on 79.3% of returns)
Here:
$27,781
State:
$33,868
(% of AGI for various income ranges: 146.6% for AGIs below $10k, 64.0% for AGIs $10k-25k, 71.4% for AGIs $25k-50k, 67.4% for AGIs $50k-75k, 48.1% for AGIs $75k-100k, 32.9% for AGIs over 100k)
Taxable interest for individuals: $2,490 (reported on 55.8% of returns)
This zip code:
$2,490
North Dakota:
$1,652
(% of AGI for various income ranges: 17.8% for AGIs below $10k, 5.8% for AGIs $10k-25k, 3.1% for AGIs $25k-50k, 2.1% for AGIs $50k-75k, 5.9% for AGIs $75k-100k, 3.0% for AGIs over 100k)
Taxable dividends: $1,977 (reported on 35.3% of returns)
Here:
$1,977
State:
$2,207
(% of AGI for various income ranges: 7.3% for AGIs below $10k, 1.9% for AGIs $10k-25k, 1.2% for AGIs $25k-50k, 1.8% for AGIs $50k-75k, 1.3% for AGIs $75k-100k, 2.4% for AGIs over 100k)
Net capital gain/loss: +$8,702 (reported on 38.1% of returns)
Here:
+$8,702
State:
+$6,573
(% of AGI for various income ranges: 13.0% for AGIs below $10k, 6.0% for AGIs $10k-25k, 4.3% for AGIs $25k-50k, 4.8% for AGIs $50k-75k, 12.1% for AGIs $75k-100k, 16.0% for AGIs over 100k)
Profit/loss from business: +$16,044 (reported on 20.1% of returns)
Here:
+$16,044
State:
+$8,636
(% of AGI for various income ranges: 14.0% for AGIs below $10k, 6.9% for AGIs $10k-25k, 4.4% for AGIs $25k-50k, 7.1% for AGIs $50k-75k, 9.1% for AGIs $75k-100k, 13.9% for AGIs over 100k)
IRA payment deduction: $3,061 (reported on 4.3% of returns)
58623:
$3,061
North Dakota:
$2,969
Total itemized deductions: $16,703 (23% of AGI, reported on 12.8% of returns)
Here:
$16,703
State:
$16,683
Here:
23.0% of AGI
State:
18.6% of AGI
(% of AGI for various income ranges: 11.1% for AGIs $10k-25k, 4.5% for AGIs $25k-50k, 4.3% for AGIs $50k-75k, 7.2% for AGIs $75k-100k, 5.7% for AGIs over 100k)
Charity contributions deductions: $3,831 (5% of AGI, reported on 10.5% of returns)
Here:
$3,831
State:
$3,523
Here:
5.0% of AGI
State:
3.6% of AGI
(% of AGI for various income ranges: 0.6% for AGIs $10k-25k, 0.7% for AGIs $25k-50k, 0.6% for AGIs $50k-75k, 1.4% for AGIs $75k-100k, 1.9% for AGIs over 100k)
Total tax: $5,261 (reported on 77.2% of returns)
58623:
$5,261
State:
$5,748
(% of AGI for various income ranges: 4.9% for AGIs below $10k, 5.1% for AGIs $10k-25k, 6.7% for AGIs $25k-50k, 8.6% for AGIs $50k-75k, 11.7% for AGIs $75k-100k, 18.8% for AGIs over 100k)
Earned income credit: $1,168 (reported on 9.5% of returns)
Here:
$1,168
State:
$1,558
Percentage of individuals using paid preparers for their 2004 taxes: 81.1%
Here:
81%
State:
63%
(% for various income ranges: 74.4% for AGIs below $10k, 76.7% for AGIs $10k-25k, 81.8% for AGIs $25k-50k, 87.4% for AGIs $50k-75k, 96.8% for AGIs $75k-100k, 91.2% for AGIs over 100k)
Household received Food Stamps/SNAP in the past 12 months: 56 Household did not receive Food Stamps/SNAP in the past 12 months: 756
Women who had a birth in the past 12 months: 15 (14 now married, 2 unmarried) Women who did not have a birth in the past 12 months: 378 (180 now married, 198 unmarried)
Housing units in zip code 58623 with a mortgage: 227 Houses without a mortgage: 8
Median monthly owner costs for units with a mortgage: $1,109 Median monthly owner costs for units without a mortgage: $459
Residents with income below the poverty level in 2022:
This zip code:
11.8%
Whole state:
11.5%
Residents with income below 50% of the poverty level in 2022:
This zip code:
3.8%
Whole state:
5.9%
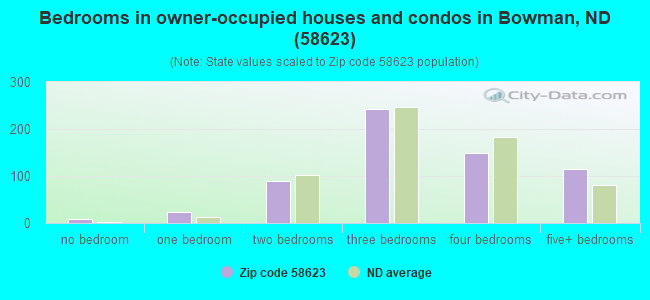
Median number of rooms in houses and condos:
Here:
7.0
State:
7.0
Median number of rooms in apartments:
Here:
5.6
State:
4.0
Notable locations in this zip code not listed on our city pages
Notable locations in zip code 58623: Stuber Ranch (A), Logging Camp Ranch (B), Old Deep Creek Guard Station (C), H T Ranch (D), K Hafele Ranch (E), Jacobson Ranch (F), Butte View State Campground (G), Ponderosa Pine Area (H), Bowman Fire Department (I). Display/hide their locations on the map
Streams, rivers, and creeks: Lone Tree Creek (A), Cold Turkey Creek (B), Spring Coulee (C), South Fork Cedar Creek (D), Sand Creek (E), Deep Creek (F), Stage Creek (G). Display/hide their locations on the map
In group quarters: 82 (-1 institutionalized population)
Size of family households: 216 2-persons, 112 3-persons, 80 4-persons, 54 5-persons, 13 6-persons, 4 7-or-more-persons
Size of nonfamily households: 297 1-person, 34 2-persons
336 married couples with children.
95 single-parent households (95 women).
93.4% of residents of 58623 zip code speak English at home.
4.4% of residents speak Spanish at home (16% very well, 7% well, 72% not well, 5% not at all).
2.1% of residents speak other Indo-European language at home (90% very well, 10% well).
0.7% of residents speak other language at home (100% very well).
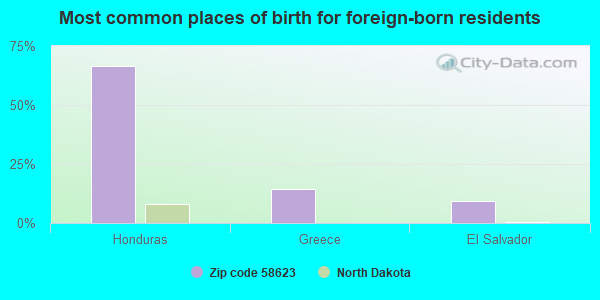
Foreign born population: 22 (1.1%) (61.2% of them are naturalized citizens)
This zip code:
1.1%
Whole state:
4.9%
67%Honduras
14%Greece
10%El Salvador
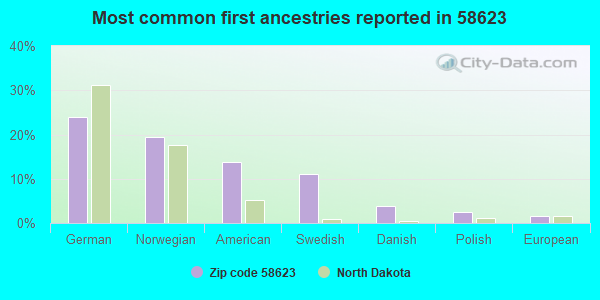
24%German
20%Norwegian
14%American
11%Swedish
4%Danish
3%Polish
2%European
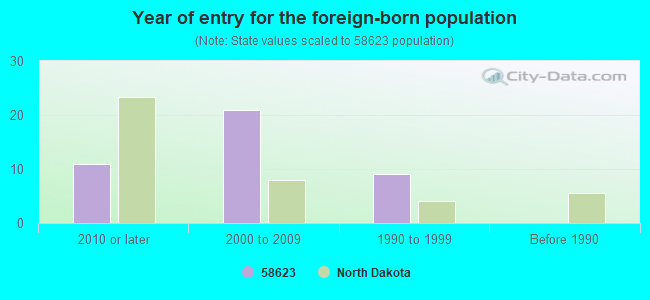
Year of entry for the foreign-born population
112010 or later
212000 to 2009
91990 to 1999
0Before 1990
Major facilities with environmental interests located in this zip code:
BOWMAN HIGH SCHOOL (102 8TH AVENUE SOUTHWEST in BOWMAN, ND)
COMPLIANCE ACTIVITY (Tracking inspections of insecticide, fungicide, and rodenticide, and toxic substances) (National Center for Education Statistics) - STATE ID-10432 Organizations: BOWMAN 1 (SCHOOL DISTRICT)
Alternative names: BOWMAN SCH DIST
COTTAGE SCHOOL (14602 76TH ST SW in BOWMAN, ND)
(Geographic Names Information System) (National Center for Education Statistics) - STATE ID-15781 Organizations: SHEETS 14 (SCHOOL DISTRICT)
BOWMAN ELEMENTARY SCHOOL (102 8TH AVE SW in BOWMAN, ND)
(National Center for Education Statistics) - STATE ID-10431 Organizations: BOWMAN 1 (SCHOOL DISTRICT)
BOWMAN TRUCK STOP (14606 HWY 12 in BOWMAN, ND)
Conditionally Exempt Small Quantity Generators, less than 100 kg/month of hazardous waste (Resource Conservation and Recovery Act (tracking hazardous waste)) - notification Organizations: LINK ENERGY LIMITED PARTNERSHIP (CONTACT/OPERATOR)
, PLAINS MARKETING LP (CONTACT/OPERATOR)
, PLAINS MARKETING LP (CONTACT/OWNER)
Alternative names: KOCH - BOWMAN TRUCK STOP
HOME BASE AUCTION INC (NORTH MAIN in BOWMAN, ND)
(Resource Conservation and Recovery Act (tracking hazardous waste)) Organizations: LEO HEINRICH AND TED UECKER (CONTACT/OWNER)
PROJECT SAFE SEND (1 MI W ON US12, SOUTH SIDE in BOWMAN, ND)
Conditionally Exempt Small Quantity Generators, less than 100 kg/month of hazardous waste (Resource Conservation and Recovery Act (tracking hazardous waste)) - notification Business NAICS classification: AUTOMOTIVE TRANSMISSION REPAIR.; AUTOMOTIVE OIL CHANGE AND LUBRICATION SHOPS. Organizations: WAYNE BERGQUIST (CONTACT/OPERATOR)
BOWMAN, CITY OF (101 1ST STREET SOUTHWEST in BOWMAN, ND)
National Pollutant Discharge Elimination System NON-MAJOR (Tracking pollutant discharge elimination systems) - permit Business SIC classification: SEWERAGE SYSTEMS
BOWMAN CLEANERS (107 NORTH MAIN in BOWMAN, ND)
Conditionally Exempt Small Quantity Generators, less than 100 kg/month of hazardous waste (Resource Conservation and Recovery Act (tracking hazardous waste)) - notification Organizations: THOMAS AND LENOTA BOUSHELE (CONTACT/OWNER)
CONTINENTAL RESOURCES INC. (MEDICINE POLE HILLS 15-130-104 in BOWMAN, ND)
AIR MAJOR (AIRS/AFS) CRITERIA AND HAZARDOUS AIR POLLUTANT INVENTORY (Inventory of air pollution sources) Business SIC and NAICS classification: CRUDE PETROLEUM AND NATURAL GAS Alternative names: CONTINENTAL RESOURCES INC. MEDICINE POLE HILLS
JIMS BODY SHOP (205 1ST AVE SOUTHEAST in BOWMAN, ND)
Conditionally Exempt Small Quantity Generators, less than 100 kg/month of hazardous waste (Resource Conservation and Recovery Act (tracking hazardous waste)) - notification Organizations: STUBER LAND CO (CONTACT/OWNER)
PRAIRIE MTN. ELECTRIC MOTOR INC (202 HIGHWAY 12 W in BOWMAN, ND)
Conditionally Exempt Small Quantity Generators, less than 100 kg/month of hazardous waste (Resource Conservation and Recovery Act (tracking hazardous waste)) - notification Organizations: LOIS AND DENNIS SCHMALZ (CONTACT/OWNER)
SCHLUMBERGER WELL SERVICES - BOWMAN (8512 147TH AVE SW HWY 85-12 in BOWMAN, ND)
Conditionally Exempt Small Quantity Generators, less than 100 kg/month of hazardous waste (Resource Conservation and Recovery Act (tracking hazardous waste)) - notification Business NAICS classification: SUPPORT ACTIVITIES FOR OIL AND GAS OPERATIONS. Organizations: SCHLUMBERGER TECHNOLOGIES CORP (CONTACT/OWNER)
Alternative names: DOWELL SCHLUMBERGER - BOWMAN
Housing units lacking complete plumbing facilities: 5.5% Housing units lacking complete kitchen facilities: 2.2%
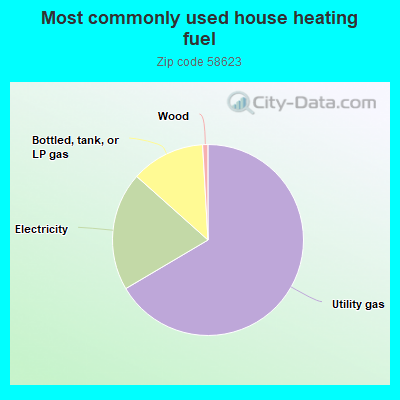
66.5%Utility gas
20.1%Electricity
12.5%Bottled, tank, or LP gas
0.9%Wood
Population in 1990: 2,432.
Place of birth for U.S.-born residents:
This state: 1,416
Northeast: 4
Midwest: 365
South: 22
West: 174
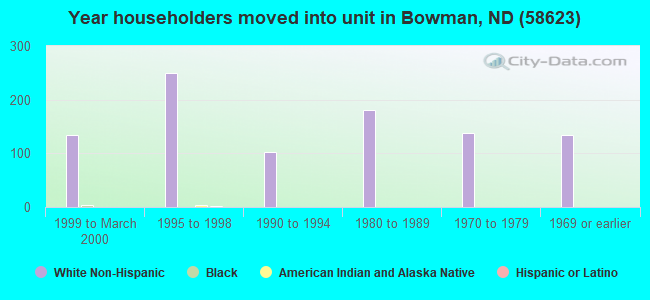
59% of the 58623 zip code residents lived in the same house 5 years ago. Out of people who lived in different houses, 49% lived in this county. Out of people who lived in different counties, 50% lived in North Dakota.
92% of the 58623 zip code residents lived in the same house 1 year ago. Out of people who lived in different houses, 38% moved from this county. Out of people who lived in different houses, 54% moved from different county within same state. Out of people who lived in different houses, 16% moved from abroad.
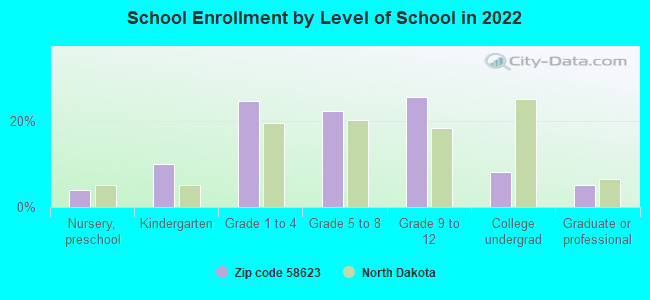
Private vs. public school enrollment:
Students in private schools in grades 1 to 8 (elementary and middle school): 1
Here:
0.9%
North Dakota:
8.4%
Students in private schools in grades 9 to 12 (high school):
Here:
0.0%
North Dakota:
8.2%
Students in private undergraduate colleges:
Here:
0.0%
North Dakota:
14.3%
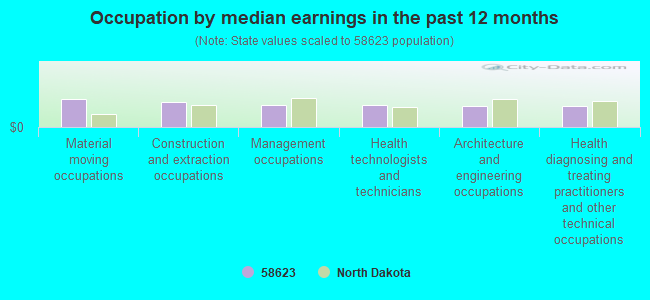
Occupation by median earnings in the past 12 months ($)
78,161Material moving occupations
69,397Construction and extraction occupations
61,984Management occupations
61,650Health technologists and technicians
59,911Architecture and engineering occupations
58,567Health diagnosing and treating practitioners and other technical occupations
Companies with federal contracts located in this zip code:
BOWMAN-SLOPE SOIL CONSERVATION (111 2ND AVE NW in BOWMAN, ND; small business) : $19,904 in 5 contractsfrom 2004 to 2006
Contracts for Landscaping/Groundskeeping Services by Army, U.S. Army Corps of Engineers - civil program financing only Signed by year:2000: $0; 2001: $0; 2002: $0; 2003: $0; 2004: $7,786; 2005: $7,858; 2006: $4,260.
Biggest contracts:
$4,260 with Army for Landscaping/Groundskeeping Services. Signed on 2006-05-22. Completion date: 2006-06-30.
$3,929, same as above.Signed on 2005-04-22. Completion date: 2005-06-30.
$3,929 with U.S. Army Corps of Engineers - civil program financing only for Landscaping/Groundskeeping Services. Signed on 2005-04-22. Completion date: 2005-06-30.
$3,893 with Army for Landscaping/Groundskeeping Services. Signed on 2004-03-09. Completion date: 2004-06-30.
Top industries in this zip code by the number of employees in 2005:
Health Care and Social Assistance: General Medical and Surgical Hospitals (100-249 employees: 1 establishment)
Finance and Insurance: Commercial Banking (10-19: 3, 5-9: 2)
Wholesale Trade: Farm and Garden Machinery and Equipment Merchant Wholesalers (20-49: 1, 1-4: 1)
Accommodation and Food Services: Limited-Service Restaurants (20-49: 1)
Accommodation and Food Services: Hotels (except Casino Hotels) and Motels (5-9: 3, 1-4: 1)
Construction: New Single-Family Housing Construction (except Operative Builders) (10-19: 1, 5-9: 1)
Health Care and Social Assistance: Offices of Dentists (10-19: 1, 5-9: 1)
People in group quarters in 2010:
68 people in nursing facilities/skilled-nursing facilities
8 people in group homes intended for adults
6 people in hospitals with patients who have no usual home elsewhere
People in group quarters in 2000:
82 people in nursing homes
8 people in homes for the mentally retarded
Fatal accident statistics in 2013:
Fatal accident count: 1
Vehicles involved in fatal accidents: 1
Fatal accidents caused by drunken drivers: 0
Fatalities: 1
Persons involved in fatal accidents: 5
Pedestrians involved in fatal accidents: 0
Fatal accident statistics in 2012:
Fatal accident count: 1
Vehicles involved in fatal accidents: 2
Fatal accidents caused by drunken drivers: 0
Fatalities: 1
Persons involved in fatal accidents: 5
Pedestrians involved in fatal accidents: 0
2002 - 2018 National Fire Incident Reporting System (NFIRS) incidents
According to the data from the years 2002 - 2018 the average number of fires per year is 19. The highest number of fire incidents - 32 took place in 2003, and the least - 5 in 2011. The data has a declining trend.
When looking into fire subcategories, the most reports belonged to: Outside Fires (67.5%), and Structure Fires (18.8%).
Fire incident types reported to NFIRS in Zip Code 58623


 Nearest zip codes: 58651, 58653, 57755, 58620, 58649, 58643.


 According to the data from the years 2002 - 2018 the average number of fires per year is 19. The highest number of fire incidents - 32 took place in 2003, and the least - 5 in 2011. The data has a declining trend.
 When looking into fire subcategories, the most reports belonged to: Outside Fires (67.5%), and Structure Fires (18.8%).