Estimated zip code population in 2022: 17,595 Zip code population in 2010: 16,203 Zip code population in 2000: 13,991
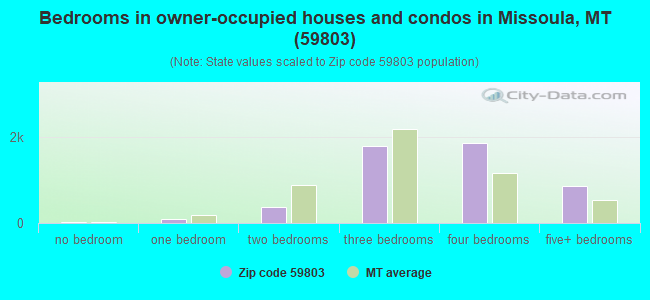
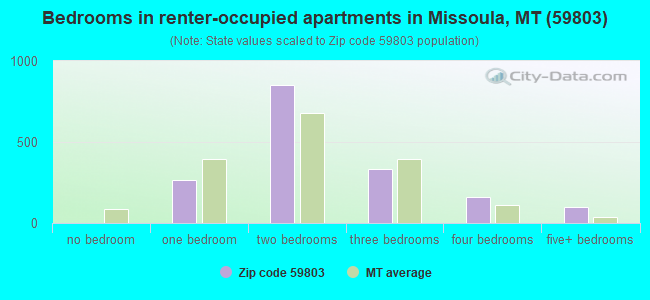
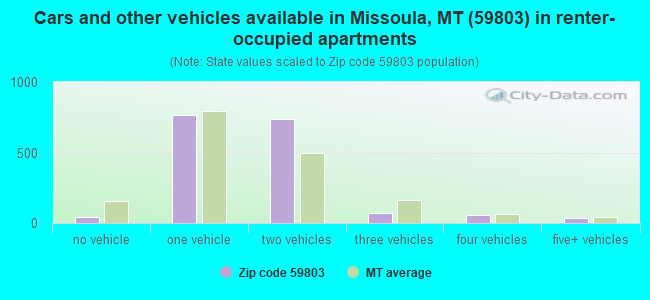
Houses and condos: 6,878 Renter-occupied apartments: 1,708
% of renters here:
26%
State:
31%
March 2022 cost of living index in zip code 59803: 93.6 (less than average, U.S. average is 100)
Land area: 79.8 sq. mi. Water area: 0.3 sq. mi.
Population density: 220 people per square mile
(very low).
OSM Map
General Map
Google Map
MSN Map
OSM Map
General Map
Google Map
MSN Map
OSM Map
General Map
Google Map
MSN Map
OSM Map
General Map
Google Map
MSN Map
Please wait while loading the map...
Real estate property taxes paid for housing units in 2022:
This zip code:
0.8% ($4,397)
Montana:
0.7% ($2,498)
Median real estate property taxes paid for housing units with mortgages in 2022: $4,442 (0.8%) Median real estate property taxes paid for housing units with no mortgage in 2022: $4,252 (0.8%)
Business Search- 14 Million verified businesses
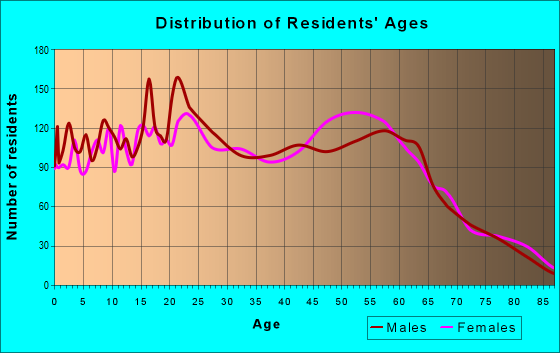
Males: 8,906
(50.6%)
Females: 8,688
(49.4%)
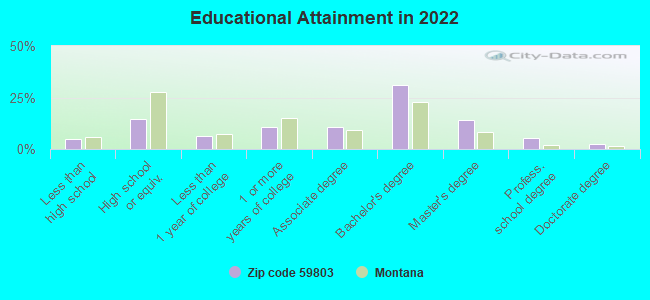
For population 25 years and over in 59803:
High school or higher: 95.9%
Bachelor's degree or higher: 53.1%
Graduate or professional degree: 21.7%
Unemployed: 2.2%
Mean travel time to work (commute): 20.1 minutes
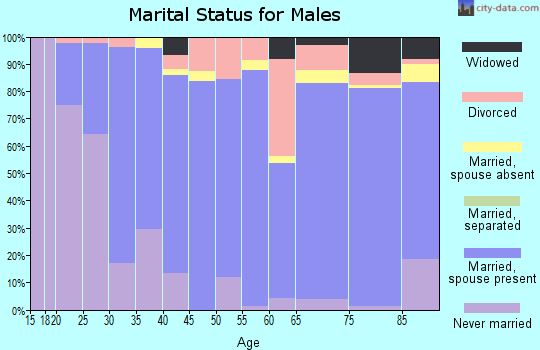
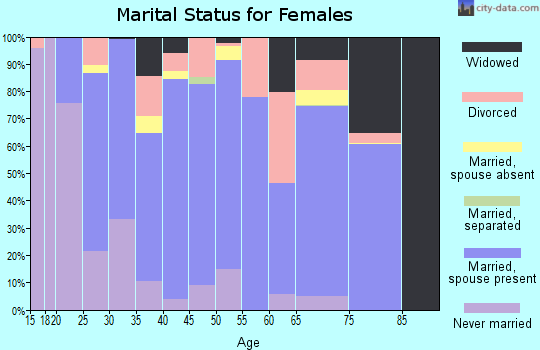
For population 15 years and over in 59803:
Never married: 27.7%
Now married: 57.8%
Separated: 0.3%
Widowed: 2.4%
Divorced: 11.7%
Zip code 59803 compared to state average:
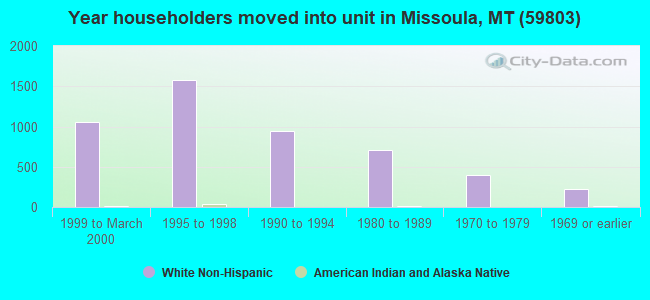
Length of stay since moving in above state average.
Number of rooms per house above state average.
Percentage of population with a bachelor's degree or higher above state average.
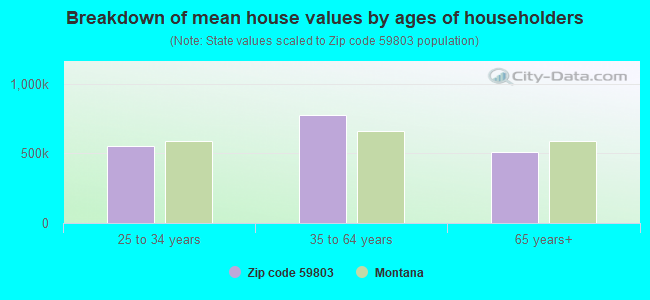
Estimated median house/condo value in 2022: $539,952
59803:
$539,952
Montana:
$366,400
According to our research of Montana and other state lists, there were 20 registered sex offenders living in 59803 zip code as of April 27, 2024. The ratio of all residents to sex offenders in zip code 59803 is 862 to 1. The ratio of registered sex offenders to all residents in this zip code is much lower than the state average.
Median resident age:
This zip code:
42.4 years
Montana median age:
40.2 years
Average household size:
This zip code:
2.6 people
Montana:
2.4 people
Averages for the 2020 tax year for zip code 59803, filed in 2021:
Average Adjusted Gross Income (AGI) in 2020: $91,874 (Individual Income Tax Returns)
Here:
$91,874
State:
$70,533
Salary/wage: $65,249 (reported on 80.6% of returns)
Here:
$65,249
State:
$52,258
(% of AGI for various income ranges: 1262.3% for AGIs below $25k, 3616.2% for AGIs $25k-50k, 6482.5% for AGIs $50k-75k, 9289.3% for AGIs $75k-100k, 18636.5% for AGIs $100k-200k, 72897.1% for AGIs over 200k)
Taxable interest for individuals: $2,190 (reported on 39.2% of returns)
This zip code:
$2,190
Montana:
$1,928
(% of AGI for various income ranges: 28.3% for AGIs below $25k, 37.4% for AGIs $25k-50k, 66.4% for AGIs $50k-75k, 87.9% for AGIs $75k-100k, 176.7% for AGIs $100k-200k, 2267.6% for AGIs over 200k)
Ordinary dividends: $6,919 (reported on 28.4% of returns)
Here:
$6,919
State:
$7,554
(% of AGI for various income ranges: 39.5% for AGIs below $25k, 62.1% for AGIs $25k-50k, 175.5% for AGIs $50k-75k, 288.8% for AGIs $75k-100k, 562.3% for AGIs $100k-200k, 4471.8% for AGIs over 200k)
Net capital gain/loss in AGI: +$32,448 (reported on 27.4% of returns)
Here:
+$32,448
State:
+$26,730
(% of AGI for various income ranges: 24.5% for AGIs below $25k, 60.3% for AGIs $25k-50k, 165.1% for AGIs $50k-75k, 379.3% for AGIs $75k-100k, 1077.9% for AGIs $100k-200k, 35902.4% for AGIs over 200k)
Profit/loss from business: +$16,226 (reported on 17.9% of returns)
Here:
+$16,226
State:
+$13,757
(% of AGI for various income ranges: 88.9% for AGIs below $25k, 183.3% for AGIs $25k-50k, 416.1% for AGIs $50k-75k, 445.4% for AGIs $75k-100k, 969.6% for AGIs $100k-200k, 4261.2% for AGIs over 200k)
Taxable individual retirement arrangement distribution: $24,246 (reported on 12.1% of returns)
59803:
$24,246
Montana:
$19,575
(% of AGI for various income ranges: 62.6% for AGIs below $25k, 107.6% for AGIs $25k-50k, 342.8% for AGIs $50k-75k, 455.0% for AGIs $75k-100k, 1088.4% for AGIs $100k-200k, 4864.1% for AGIs over 200k)
Self-employed (Keogh) retirement plans: $25,100 (reported on 0.8% of returns)
59803:
$25,100
Montana:
$23,886
(% of AGI for various income ranges: 61.3% for AGIs $100k-200k, 737.6% for AGIs over 200k)
Total itemized deductions: $33,952 (reported on 13.0% of returns)
Here:
$33,952
State:
$33,125
(% of AGI for various income ranges: 76.8% for AGIs below $25k, 133.4% for AGIs $25k-50k, 473.5% for AGIs $50k-75k, 705.0% for AGIs $75k-100k, 1272.3% for AGIs $100k-200k, 9659.4% for AGIs over 200k)
Charity contributions: $13,359 (reported on 10.5% of returns)
Here:
$13,359
State:
$12,481
(% of AGI for various income ranges: 6.4% for AGIs below $25k, 12.8% for AGIs $25k-50k, 64.2% for AGIs $50k-75k, 123.2% for AGIs $75k-100k, 292.7% for AGIs $100k-200k, 4680.0% for AGIs over 200k)
Taxes paid: $8,394 (reported on 13.0% of returns)
59803:
$8,394
State:
$7,689
(% of AGI for various income ranges: 11.6% for AGIs below $25k, 34.2% for AGIs $25k-50k, 129.3% for AGIs $50k-75k, 222.3% for AGIs $75k-100k, 402.1% for AGIs $100k-200k, 1816.5% for AGIs over 200k)
Earned income credit: $1,920 (reported on 9.4% of returns)
Here:
$1,920
State:
$2,035
(% of AGI for various income ranges: 58.3% for AGIs below $25k, 46.9% for AGIs $25k-50k)
Percentage of individuals using paid preparers for their 2020 taxes: 94.0%
Here:
94%
State:
94%
(% for various income ranges: 92.5% for AGIs below $25k, 94.9% for AGIs $25k-50k, 92.8% for AGIs $50k-75k, 94.5% for AGIs $75k-100k, 95.2% for AGIs $100k-200k, 95.5% for AGIs over 200k)
Averages for the 2012 tax year for zip code 59803, filed in 2013:
Average Adjusted Gross Income (AGI) in 2012: $66,098 (Individual Income Tax Returns)
Here:
$66,098
State:
$53,401
Salary/wage: $49,819 (reported on 83.5% of returns)
Here:
$49,819
State:
$40,976
(% of AGI for various income ranges: 79.7% for AGIs below $25k, 72.7% for AGIs $25k-50k, 65.0% for AGIs $50k-75k, 70.1% for AGIs $75k-100k, 68.9% for AGIs $100k-200k, 43.6% for AGIs over 200k)
Taxable interest for individuals: $2,102 (reported on 48.0% of returns)
This zip code:
$2,102
Montana:
$1,689
(% of AGI for various income ranges: 1.1% for AGIs below $25k, 0.9% for AGIs $25k-50k, 3.2% for AGIs $50k-75k, 1.0% for AGIs $75k-100k, 1.0% for AGIs $100k-200k, 1.9% for AGIs over 200k)
Ordinary dividends: $6,228 (reported on 28.6% of returns)
Here:
$6,228
State:
$5,585
(% of AGI for various income ranges: 2.2% for AGIs below $25k, 2.0% for AGIs $25k-50k, 3.6% for AGIs $50k-75k, 1.5% for AGIs $75k-100k, 1.9% for AGIs $100k-200k, 4.1% for AGIs over 200k)
Net capital gain/loss in AGI: +$11,676 (reported on 24.6% of returns)
Here:
+$11,676
State:
+$14,401
(% of AGI for various income ranges: 0.3% for AGIs below $25k, 0.7% for AGIs $25k-50k, 2.7% for AGIs $50k-75k, 1.0% for AGIs $75k-100k, 2.2% for AGIs $100k-200k, 11.7% for AGIs over 200k)
Profit/loss from business: +$12,808 (reported on 16.8% of returns)
Here:
+$12,808
State:
+$10,980
(% of AGI for various income ranges: 4.9% for AGIs below $25k, 4.6% for AGIs $25k-50k, 3.0% for AGIs $50k-75k, 4.0% for AGIs $75k-100k, 3.1% for AGIs $100k-200k, 2.1% for AGIs over 200k)
Taxable individual retirement arrangement distribution: $15,563 (reported on 12.1% of returns)
59803:
$15,563
Montana:
$13,434
(% of AGI for various income ranges: 2.5% for AGIs below $25k, 2.7% for AGIs $25k-50k, 2.8% for AGIs $50k-75k, 4.0% for AGIs $75k-100k, 3.5% for AGIs $100k-200k, 1.8% for AGIs over 200k)
Self-employment retirement plans: $16,814 (reported on 0.9% of returns)
59803:
$16,814
Montana:
$18,233
(% of AGI for various income ranges: 0.4% for AGIs $25k-50k, 0.2% for AGIs $100k-200k, 0.5% for AGIs over 200k)
Total itemized deductions: $23,577 (20% of AGI, reported on 43.0% of returns)
Here:
$23,577
State:
$21,750
Here:
20.5% of AGI
State:
20.5% of AGI
(% of AGI for various income ranges: 10.9% for AGIs below $25k, 14.0% for AGIs $25k-50k, 15.8% for AGIs $50k-75k, 17.3% for AGIs $75k-100k, 17.4% for AGIs $100k-200k, 13.5% for AGIs over 200k)
Charity contributions: $4,118 (reported on 36.8% of returns)
Here:
$4,118
State:
$3,989
(% of AGI for various income ranges: 0.7% for AGIs below $25k, 1.3% for AGIs $25k-50k, 1.7% for AGIs $50k-75k, 2.2% for AGIs $75k-100k, 2.4% for AGIs $100k-200k, 3.4% for AGIs over 200k)
Taxes paid: $9,006 (reported on 42.7% of returns)
59803:
$9,006
State:
$7,640
(% of AGI for various income ranges: 2.0% for AGIs below $25k, 3.8% for AGIs $25k-50k, 4.9% for AGIs $50k-75k, 6.1% for AGIs $75k-100k, 7.1% for AGIs $100k-200k, 6.5% for AGIs over 200k)
Earned income credit: $1,852 (reported on 12.1% of returns)
Here:
$1,852
State:
$2,015
(% of AGI for various income ranges: 3.9% for AGIs below $25k, 0.9% for AGIs $25k-50k)
Percentage of individuals using paid preparers for their 2012 taxes: 50.4%
Here:
50%
State:
57%
(% for various income ranges: 40.7% for AGIs below $25k, 47.1% for AGIs $25k-50k, 54.7% for AGIs $50k-75k, 54.0% for AGIs $75k-100k, 63.0% for AGIs $100k-200k, 84.4% for AGIs over 200k)
Averages for the 2004 tax year for zip code 59803, filed in 2005:
Average Adjusted Gross Income (AGI) in 2004: $54,527 (Individual Income Tax Returns)
Here:
$54,527
State:
$37,845
Salary/wage: $42,996 (reported on 85.4% of returns)
Here:
$42,996
State:
$31,190
(% of AGI for various income ranges: 205.2% for AGIs below $10k, 77.0% for AGIs $10k-25k, 75.3% for AGIs $25k-50k, 76.5% for AGIs $50k-75k, 78.8% for AGIs $75k-100k, 52.7% for AGIs over 100k)
Taxable interest for individuals: $2,332 (reported on 58.5% of returns)
This zip code:
$2,332
Montana:
$1,879
(% of AGI for various income ranges: 18.6% for AGIs below $10k, 3.0% for AGIs $10k-25k, 2.1% for AGIs $25k-50k, 1.7% for AGIs $50k-75k, 1.5% for AGIs $75k-100k, 3.0% for AGIs over 100k)
Taxable dividends: $2,708 (reported on 33.1% of returns)
Here:
$2,708
State:
$3,070
(% of AGI for various income ranges: 7.5% for AGIs below $10k, 2.1% for AGIs $10k-25k, 1.8% for AGIs $25k-50k, 1.3% for AGIs $50k-75k, 1.0% for AGIs $75k-100k, 1.8% for AGIs over 100k)
Net capital gain/loss: +$15,532 (reported on 27.4% of returns)
Here:
+$15,532
State:
+$10,237
(% of AGI for various income ranges: 8.2% for AGIs below $10k, 0.7% for AGIs $10k-25k, 1.2% for AGIs $25k-50k, 1.4% for AGIs $50k-75k, 2.4% for AGIs $75k-100k, 15.5% for AGIs over 100k)
Profit/loss from business: +$12,643 (reported on 18.5% of returns)
Here:
+$12,643
State:
+$8,849
(% of AGI for various income ranges: 2.9% for AGIs below $10k, 4.7% for AGIs $10k-25k, 4.9% for AGIs $25k-50k, 3.7% for AGIs $50k-75k, 3.3% for AGIs $75k-100k, 4.7% for AGIs over 100k)
IRA payment deduction: $2,943 (reported on 5.2% of returns)
59803:
$2,943
Montana:
$2,958
(% of AGI for various income ranges: 0.6% for AGIs below $10k, 0.5% for AGIs $10k-25k, 0.6% for AGIs $25k-50k, 0.3% for AGIs $50k-75k, 0.2% for AGIs $75k-100k, 0.2% for AGIs over 100k)
Self-employed pension: $13,286 (reported on 1.6% of returns)
Here:
$13,286
Montana:
$13,795
(% of AGI for various income ranges: 0.1% for AGIs $25k-50k, 0.3% for AGIs $50k-75k, 0.3% for AGIs $75k-100k, 0.6% for AGIs over 100k)
Total itemized deductions: $19,793 (22% of AGI, reported on 49.6% of returns)
Here:
$19,793
State:
$17,258
Here:
22.0% of AGI
State:
23.1% of AGI
(% of AGI for various income ranges: 25.6% for AGIs below $10k, 14.6% for AGIs $10k-25k, 20.5% for AGIs $25k-50k, 21.3% for AGIs $50k-75k, 19.3% for AGIs $75k-100k, 15.7% for AGIs over 100k)
Charity contributions deductions: $3,083 (3% of AGI, reported on 45.4% of returns)
Here:
$3,083
State:
$2,921
Here:
3.3% of AGI
State:
3.7% of AGI
(% of AGI for various income ranges: 1.2% for AGIs below $10k, 1.4% for AGIs $10k-25k, 1.9% for AGIs $25k-50k, 2.5% for AGIs $50k-75k, 2.5% for AGIs $75k-100k, 3.0% for AGIs over 100k)
Total tax: $8,672 (reported on 77.4% of returns)
59803:
$8,672
State:
$5,485
(% of AGI for various income ranges: 4.5% for AGIs below $10k, 4.3% for AGIs $10k-25k, 6.7% for AGIs $25k-50k, 8.1% for AGIs $50k-75k, 9.5% for AGIs $75k-100k, 18.1% for AGIs over 100k)
Earned income credit: $1,464 (reported on 9.7% of returns)
Here:
$1,464
State:
$1,604
Percentage of individuals using paid preparers for their 2004 taxes: 53.8%
Here:
54%
State:
63%
(% for various income ranges: 45.4% for AGIs below $10k, 49.4% for AGIs $10k-25k, 54.5% for AGIs $25k-50k, 53.8% for AGIs $50k-75k, 55.8% for AGIs $75k-100k, 73.6% for AGIs over 100k)
Household received Food Stamps/SNAP in the past 12 months: 273 Household did not receive Food Stamps/SNAP in the past 12 months: 6,427
Women who had a birth in the past 12 months: 194 (178 now married, 19 unmarried) Women who did not have a birth in the past 12 months: 3,577 (1,641 now married, 1,935 unmarried)
Housing units in zip code 59803 with a mortgage: 3,223 (359 second mortgage, 319 both second mortgage and home equity loan) Houses without a mortgage: 312
Median monthly owner costs for units with a mortgage: $2,058 Median monthly owner costs for units without a mortgage: $708
Residents with income below the poverty level in 2022:
This zip code:
3.2%
Whole state:
12.1%
Residents with income below 50% of the poverty level in 2022:
This zip code:
2.6%
Whole state:
6.3%
Median number of rooms in houses and condos:
Here:
7.5
State:
6.4
Median number of rooms in apartments:
Here:
4.3
State:
4.2
Notable locations in this zip code not listed on our city pages
Notable locations in zip code 59803: University Beacon (A), Linda Vista Public Golf Course (B), Highlands Golf Club (C), University of Montana Police Department (D), Missoula Fire Department Station 5 (E), Physical Plant (F), Missoula Fire Department Station 3 (G). Display/hide their locations on the map
Churches in zip code 59803 include: Jehovahs Witnesses (A), First Church of Christ Scientist (B), Christian Life Center (C), Christian and Missionary Alliance Church (D), Garden City Chapel (E), Holy Family Catholic Church (F), First Evangelical Church (G), Unity Church of Missoula (H), New Life Community Church (I). Display/hide their locations on the map
Creeks: Bear Run Creek (A), Spooner Creek (B), Dagret Creek (C), Davis Creek (D), East Fork Deer Creek (E), West Fork Deer Creek (F), Holloman Creek (G), Limestone Creek (H), Middle Fork Deer Creek (I). Display/hide their locations on the map
Parks in zip code 59803 include: Garland Park (1), Wapikiya Park (2), Pheasant Run Park (3), Skyview Park (4), Whitaker Park (5), K Williams Natural Trail Area (6), Pattee Canyon Picnic Area (7), High Park (8). Display/hide their locations on the map
2,568 married couples with children.
620 single-parent households (229 men, 391 women).
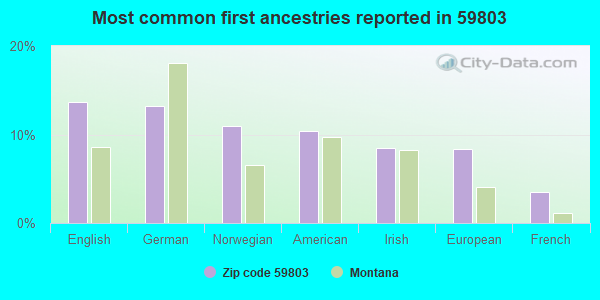
95.6% of residents of 59803 zip code speak English at home.
1.1% of residents speak Spanish at home (89% very well, 11% well).
1.9% of residents speak other Indo-European language at home (89% very well, 11% not well).
1.1% of residents speak Asian or Pacific Island language at home (40% very well, 27% well, 25% not well, 8% not at all).
0.2% of residents speak other language at home (100% very well).
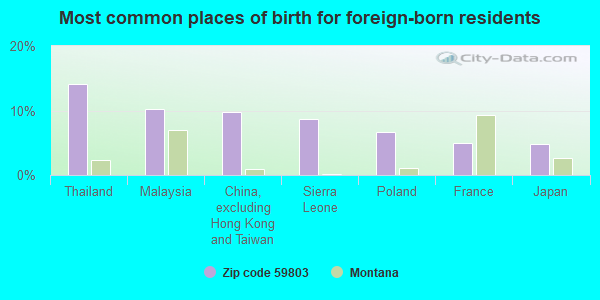
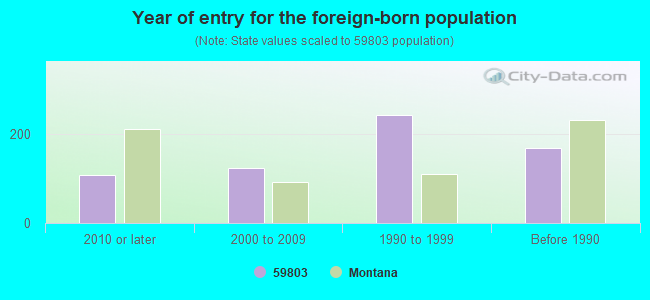
Foreign born population: 445 (2.5%) (68.9% of them are naturalized citizens)
Major facilities with environmental interests located in this zip code:
BRADY NELSON (3376 TRAILS END ROAD in MISSOULA, MT)
AIR MINOR (AIRS/AFS) STATE MASTER (Montana air and water quality tracking) - MT-CEDARS-100021, AIR PROGRAM CRITERIA AND HAZARDOUS AIR POLLUTANT INVENTORY (Inventory of air pollution sources) Business SIC classification: CONSTRUCTION SAND AND GRAVEL Alternative names: MISSOULA COUNTY
KARL TYLER CHEVROLET W BROADWAY (1900 W BROADWAY in MISSOULA, MT)
STATE MASTER (Montana air and water quality tracking) - MT-CEDARS-100051, UNDERGROUND STORAGE TANK PROGRAM (Resource Conservation and Recovery Act (tracking hazardous waste)) Organizations: GARDEN CITY PARTNERS (CONTACT/OWNER)
Alternative names: KARL TYLER CHEVROLET INC
SUTTON CONSTRUCTION SERVICES, INC. (1979 EL-JAY CONE CRUSHER in PORTABLE, MT)
AIR SYNTHETIC MINOR (AIRS/AFS) STATE MASTER (Montana air and water quality tracking) - MT-CEDARS-100021, AIR PROGRAM Business SIC classification: CONSTRUCTION SAND AND GRAVEL Organizations: SUTTON CONSTRUCTION SERVICES INC (CONTACT/APPLICANT)
COLD SPRINGS SCHOOL (2625 BRIGGS STREET in MISSOULA, MT)
(Geographic Names Information System) (National Center for Education Statistics) - STATE ID-1443 Organizations: MISSOULA ELEM (SCHOOL DISTRICT)
MEADOW HILL MIDDLE SCHOOL (4210 RESERVE in MISSOULA, MT)
(Geographic Names Information System) (National Center for Education Statistics) - STATE ID-1491 Organizations: MISSOULA ELEM (SCHOOL DISTRICT)
TWITE FAMILY PARTNERSHIP (T13 R20W SECTION 13 in MISSOULA, MT)
STATE MASTER (Montana air and water quality tracking) - MT-CEDARS-100021, AIR PROGRAM CRITERIA AND HAZARDOUS AIR POLLUTANT INVENTORY (Inventory of air pollution sources) Business SIC classification: CONSTRUCTION SAND AND GRAVEL
CHIEF CHARLO SCHOOL (5600 LONGVIEW DR in MISSOULA, MT)
(National Center for Education Statistics) - STATE ID-1819 Organizations: MISSOULA ELEM (SCHOOL DISTRICT)
JTL GROUP PATTEE CANYON PIT (750 PATTEE CANYON DR in MISSOULA, MT)
National Pollutant Discharge Elimination System NON-MAJOR (Tracking pollutant discharge elimination systems) - permit Business SIC classification: CONSTRUCTION SAND AND GRAVEL Alternative names: JTL GROUP INC.
TWITE FAMILY PARTNERSHIP (300 ELDORA LANE in MISSOULA, MT)
AIR MINOR (AIRS/AFS) Business SIC classification: CONSTRUCTION SAND AND GRAVEL
A D E A PROPERTY MANAGEMENT (725 SOUTHWEST HIGGINS AVENUE SUITE C in MISSOULA, MT)
COMPLIANCE ACTIVITY (Tracking inspections of insecticide, fungicide, and rodenticide, and toxic substances) Alternative names: ADEA PROPERTY MGMT.
ADEA PROPERTY MANAGEMENT (321 SOUTHWEST HIGGINS in MISSOULA, MT)
ENFORCEMENT/COMPLIANCE ACTIVITY (Integrated Compliance Information System)
ENFORCEMENT/COMPLIANCE ACTIVITY (Integrated Compliance Information System)
EAGEN REAL ESTATE (1001 SOUTHWEST HIGGINS SUITE 105 in MISSOULA, MT)
ENFORCEMENT/COMPLIANCE ACTIVITY (Integrated Compliance Information System)
Housing units lacking complete plumbing facilities: 0.3% Housing units lacking complete kitchen facilities: 0.3%
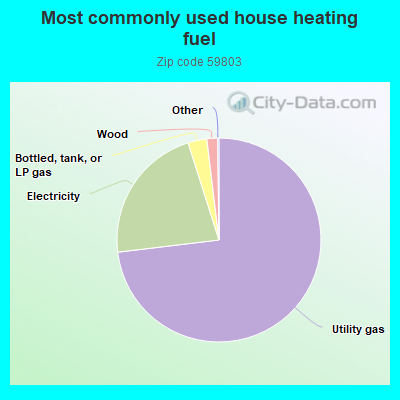
73.1%Utility gas
22.0%Electricity
3.0%Bottled, tank, or LP gas
1.7%Wood
Population in 1990: 10,444. Population change in the 1990s: +3,547 (+34.0%).
Place of birth for U.S.-born residents:
This state: 8,397
Northeast: 911
Midwest: 2,379
South: 920
West: 4,363
48% of the 59803 zip code residents lived in the same house 5 years ago. Out of people who lived in different houses, 55% lived in this county. Out of people who lived in different counties, 50% lived in Montana.
90% of the 59803 zip code residents lived in the same house 1 year ago. Out of people who lived in different houses, 47% moved from this county. Out of people who lived in different houses, 13% moved from different county within same state. Out of people who lived in different houses, 40% moved from different state. Out of people who lived in different houses, 1% moved from abroad.
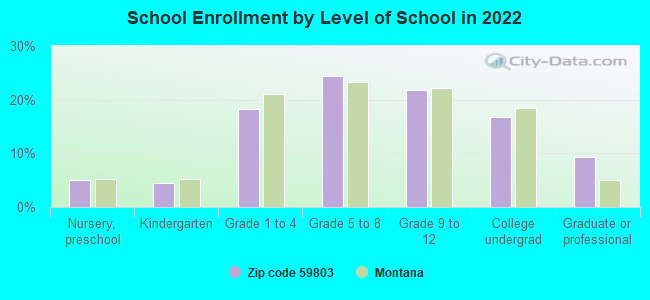
Private vs. public school enrollment:
Students in private schools in grades 1 to 8 (elementary and middle school): 403
Here:
21.4%
Montana:
15.3%
Students in private schools in grades 9 to 12 (high school): 14
Here:
1.6%
Montana:
12.2%
Students in private undergraduate colleges: 120
Here:
16.2%
Montana:
15.0%
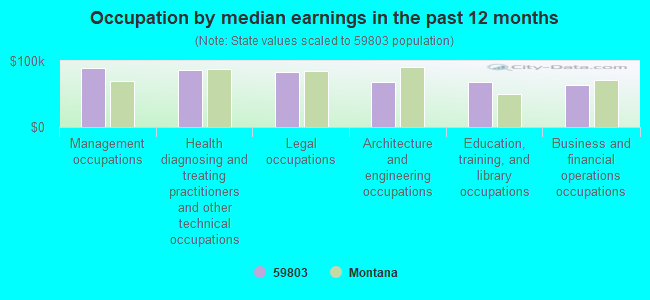
Occupation by median earnings in the past 12 months ($)
88,793Management occupations
85,652Health diagnosing and treating practitioners and other technical occupations
82,599Legal occupations
68,317Architecture and engineering occupations
67,904Education, training, and library occupations
63,181Business and financial operations occupations
Companies with federal contracts located in this zip code (MISSOULA, MT):
BEE ALERT TECHNOLOGY, INC (200 RIMROCK WAY; small business) : $464,635 in 3 contractsfrom 2003 to 2004
$344,635 with Army for Other Medical -- Basic Research (R&D). Taking place in MD. Signed on 2004-12-08. Completion date: 2004-07-14.
$70,000, same as above.Signed on 2003-12-08. Completion date: 2004-07-14.
$50,000, same as above.Signed on 2004-08-17. Completion date: 2004-07-14.
BRADY G NELSON (3376 TRAILS END RD; small business) : $284,040 in 8 contractsfrom 2001 to 2006
Contracts for Maintenance, Repair or Alteration of Real Property -- Highways, Roads, Streets, Bridges, and Railways (includes resurfacing), Snow Removal/Salt Service (also spreading aggregate or other snow melting material) by Forest Service (disused code: now 12C2), Army Signed by year:2000: $0; 2001: $243,000; 2002: $24,000; 2003: $5,720; 2004: $7,520; 2005: $2,860; 2006: $940.
Biggest contracts:
$243,000 with Forest Service (disused code: now 12C2) for Maintenance, Repair or Alteration of Real Property -- Highways, Roads, Streets, Bridges, and Railways (includes resurfacing). Signed on 2001-07-15. Completion date: 2001-10-15.
$24,000, same as above.Signed on 2002-06-15. Completion date: 2002-06-15.
$5,720 with Army for Snow Removal/Salt Service (also spreading aggregate or other snow melting material). Signed on 2004-11-19. Completion date: 2005-09-30.
$5,720, same as above.Signed on 2003-10-08. Completion date: 2004-09-30.
LORI E CUMMINGS (3324 ELDORA LN; small business) : $94,272 in 9 contractsfrom 2002 to 2006
Contracts for , Custodial Janitorial Services by National Institutes of Health, Army Signed by year:2000: $0; 2001: $0; 2002: $8,800; 2003: $22,240; 2004: $13,320; 2005: $37,102; 2006: $12,810.
Biggest contracts:
$24,292 with National Institutes of Health for . Taking place in MD. Signed on 2005-08-03. Completion date: 2005-12-02.
$13,320 with Army for Custodial Janitorial Services. Signed on 2004-02-25. Completion date: 2005-03-31.
$13,080, same as above.Signed on 2003-02-14. Completion date: 2004-03-31.
$12,810, same as above.Signed on 2006-03-15. Completion date: 2006-03-31.
ALETHEIA COUNSELING AND STRESS (2870 ST. MICHAEL DR)
$65,000 with Air Force for Lectures For Training. Signed on 2000-04-28. Completion date: 2001-05-31.
Top industries in this zip code by the number of employees in 2005:
Health Care and Social Assistance: Services for the Elderly and Persons with Disabilities (100-249 employees: 1 establishment)
Accommodation and Food Services: Limited-Service Restaurants (20-49: 4, 10-19: 1)
Health Care and Social Assistance: Offices of Dentists (10-19: 3, 5-9: 10, 1-4: 6)
2002 - 2018 National Fire Incident Reporting System (NFIRS) incidents
Based on the data from the years 2002 - 2018 the average number of fire incidents per year is 19. The highest number of reported fires - 30 took place in 2003, and the least - 7 in 2005. The data has a growing trend.
When looking into fire subcategories, the most reports belonged to: Outside Fires (48.3%), and Structure Fires (36.8%).
Fire incident types reported to NFIRS in Zip Code 59803
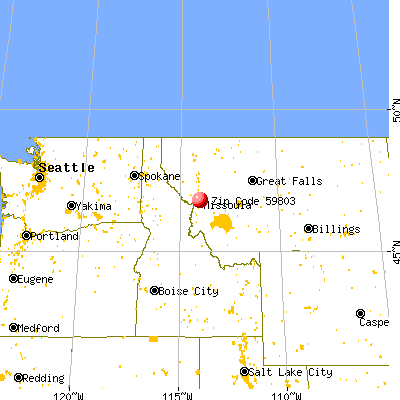


 Nearest zip codes: 59801, 59851, 59802, 59833, 59808, 59825.
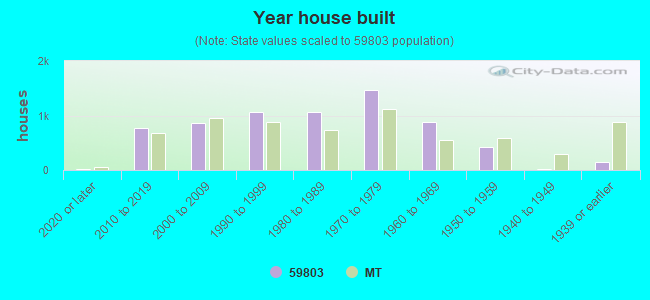


 Based on the data from the years 2002 - 2018 the average number of fire incidents per year is 19. The highest number of reported fires - 30 took place in 2003, and the least - 7 in 2005. The data has a growing trend.
 When looking into fire subcategories, the most reports belonged to: Outside Fires (48.3%), and Structure Fires (36.8%).