Missoula, Montana Submit your own pictures of this city and show them to the world
OSM Map
General Map
Google Map
MSN Map
OSM Map
General Map
Google Map
MSN Map
OSM Map
General Map
Google Map
MSN Map
OSM Map
General Map
Google Map
MSN Map
Please wait while loading the map...
Population in 2022: 76,955 (99% urban, 1% rural). Population change since 2000: +34.9%Males: 38,641 Females: 38,314
March 2022 cost of living index in Missoula: 94.9 (less than average, U.S. average is 100) Percentage of residents living in poverty in 2022: 9.2%for White Non-Hispanic residents , 3.2% for Black residents , 13.0% for Hispanic or Latino residents , 36.0% for American Indian residents , 13.6% for other race residents , 26.2% for two or more races residents )
Profiles of local businesses
Business Search - 14 Million verified businesses
Data:
Median household income ($)
Median household income (% change since 2000)
Household income diversity
Ratio of average income to average house value (%)
Ratio of average income to average rent
Median household income ($) - White
Median household income ($) - Black or African American
Median household income ($) - Asian
Median household income ($) - Hispanic or Latino
Median household income ($) - American Indian and Alaska Native
Median household income ($) - Multirace
Median household income ($) - Other Race
Median household income for houses/condos with a mortgage ($)
Median household income for apartments without a mortgage ($)
Races - White alone (%)
Races - White alone (% change since 2000)
Races - Black alone (%)
Races - Black alone (% change since 2000)
Races - American Indian alone (%)
Races - American Indian alone (% change since 2000)
Races - Asian alone (%)
Races - Asian alone (% change since 2000)
Races - Hispanic (%)
Races - Hispanic (% change since 2000)
Races - Native Hawaiian and Other Pacific Islander alone (%)
Races - Native Hawaiian and Other Pacific Islander alone (% change since 2000)
Races - Two or more races (%)
Races - Two or more races (% change since 2000)
Races - Other race alone (%)
Races - Other race alone (% change since 2000)
Racial diversity
Unemployment (%)
Unemployment (% change since 2000)
Unemployment (%) - White
Unemployment (%) - Black or African American
Unemployment (%) - Asian
Unemployment (%) - Hispanic or Latino
Unemployment (%) - American Indian and Alaska Native
Unemployment (%) - Multirace
Unemployment (%) - Other Race
Population density (people per square mile)
Population - Males (%)
Population - Females (%)
Population - Males (%) - White
Population - Males (%) - Black or African American
Population - Males (%) - Asian
Population - Males (%) - Hispanic or Latino
Population - Males (%) - American Indian and Alaska Native
Population - Males (%) - Multirace
Population - Males (%) - Other Race
Population - Females (%) - White
Population - Females (%) - Black or African American
Population - Females (%) - Asian
Population - Females (%) - Hispanic or Latino
Population - Females (%) - American Indian and Alaska Native
Population - Females (%) - Multirace
Population - Females (%) - Other Race
Coronavirus confirmed cases (Apr 27, 2024)
Deaths caused by coronavirus (Apr 27, 2024)
Coronavirus confirmed cases (per 100k population) (Apr 27, 2024)
Deaths caused by coronavirus (per 100k population) (Apr 27, 2024)
Daily increase in number of cases (Apr 27, 2024)
Weekly increase in number of cases (Apr 27, 2024)
Cases doubled (in days) (Apr 27, 2024)
Hospitalized patients (Apr 18, 2022)
Negative test results (Apr 18, 2022)
Total test results (Apr 18, 2022)
COVID Vaccine doses distributed (per 100k population) (Sep 19, 2023)
COVID Vaccine doses administered (per 100k population) (Sep 19, 2023)
COVID Vaccine doses distributed (Sep 19, 2023)
COVID Vaccine doses administered (Sep 19, 2023)
Likely homosexual households (%)
Likely homosexual households (% change since 2000)
Likely homosexual households - Lesbian couples (%)
Likely homosexual households - Lesbian couples (% change since 2000)
Likely homosexual households - Gay men (%)
Likely homosexual households - Gay men (% change since 2000)
Cost of living index
Median gross rent ($)
Median contract rent ($)
Median monthly housing costs ($)
Median house or condo value ($)
Median house or condo value ($ change since 2000)
Mean house or condo value by units in structure - 1, detached ($)
Mean house or condo value by units in structure - 1, attached ($)
Mean house or condo value by units in structure - 2 ($)
Mean house or condo value by units in structure by units in structure - 3 or 4 ($)
Mean house or condo value by units in structure - 5 or more ($)
Mean house or condo value by units in structure - Boat, RV, van, etc. ($)
Mean house or condo value by units in structure - Mobile home ($)
Median house or condo value ($) - White
Median house or condo value ($) - Black or African American
Median house or condo value ($) - Asian
Median house or condo value ($) - Hispanic or Latino
Median house or condo value ($) - American Indian and Alaska Native
Median house or condo value ($) - Multirace
Median house or condo value ($) - Other Race
Median resident age
Resident age diversity
Median resident age - Males
Median resident age - Females
Median resident age - White
Median resident age - Black or African American
Median resident age - Asian
Median resident age - Hispanic or Latino
Median resident age - American Indian and Alaska Native
Median resident age - Multirace
Median resident age - Other Race
Median resident age - Males - White
Median resident age - Males - Black or African American
Median resident age - Males - Asian
Median resident age - Males - Hispanic or Latino
Median resident age - Males - American Indian and Alaska Native
Median resident age - Males - Multirace
Median resident age - Males - Other Race
Median resident age - Females - White
Median resident age - Females - Black or African American
Median resident age - Females - Asian
Median resident age - Females - Hispanic or Latino
Median resident age - Females - American Indian and Alaska Native
Median resident age - Females - Multirace
Median resident age - Females - Other Race
Commute - mean travel time to work (minutes)
Travel time to work - Less than 5 minutes (%)
Travel time to work - Less than 5 minutes (% change since 2000)
Travel time to work - 5 to 9 minutes (%)
Travel time to work - 5 to 9 minutes (% change since 2000)
Travel time to work - 10 to 19 minutes (%)
Travel time to work - 10 to 19 minutes (% change since 2000)
Travel time to work - 20 to 29 minutes (%)
Travel time to work - 20 to 29 minutes (% change since 2000)
Travel time to work - 30 to 39 minutes (%)
Travel time to work - 30 to 39 minutes (% change since 2000)
Travel time to work - 40 to 59 minutes (%)
Travel time to work - 40 to 59 minutes (% change since 2000)
Travel time to work - 60 to 89 minutes (%)
Travel time to work - 60 to 89 minutes (% change since 2000)
Travel time to work - 90 or more minutes (%)
Travel time to work - 90 or more minutes (% change since 2000)
Marital status - Never married (%)
Marital status - Now married (%)
Marital status - Separated (%)
Marital status - Widowed (%)
Marital status - Divorced (%)
Median family income ($)
Median family income (% change since 2000)
Median non-family income ($)
Median non-family income (% change since 2000)
Median per capita income ($)
Median per capita income (% change since 2000)
Median family income ($) - White
Median family income ($) - Black or African American
Median family income ($) - Asian
Median family income ($) - Hispanic or Latino
Median family income ($) - American Indian and Alaska Native
Median family income ($) - Multirace
Median family income ($) - Other Race
Median year house/condo built
Median year apartment built
Year house built - Built 2005 or later (%)
Year house built - Built 2000 to 2004 (%)
Year house built - Built 1990 to 1999 (%)
Year house built - Built 1980 to 1989 (%)
Year house built - Built 1970 to 1979 (%)
Year house built - Built 1960 to 1969 (%)
Year house built - Built 1950 to 1959 (%)
Year house built - Built 1940 to 1949 (%)
Year house built - Built 1939 or earlier (%)
Average household size
Household density (households per square mile)
Average household size - White
Average household size - Black or African American
Average household size - Asian
Average household size - Hispanic or Latino
Average household size - American Indian and Alaska Native
Average household size - Multirace
Average household size - Other Race
Occupied housing units (%)
Vacant housing units (%)
Owner occupied housing units (%)
Renter occupied housing units (%)
Vacancy status - For rent (%)
Vacancy status - For sale only (%)
Vacancy status - Rented or sold, not occupied (%)
Vacancy status - For seasonal, recreational, or occasional use (%)
Vacancy status - For migrant workers (%)
Vacancy status - Other vacant (%)
Residents with income below the poverty level (%)
Residents with income below 50% of the poverty level (%)
Children below poverty level (%)
Poor families by family type - Married-couple family (%)
Poor families by family type - Male, no wife present (%)
Poor families by family type - Female, no husband present (%)
Poverty status for native-born residents (%)
Poverty status for foreign-born residents (%)
Poverty among high school graduates not in families (%)
Poverty among people who did not graduate high school not in families (%)
Residents with income below the poverty level (%) - White
Residents with income below the poverty level (%) - Black or African American
Residents with income below the poverty level (%) - Asian
Residents with income below the poverty level (%) - Hispanic or Latino
Residents with income below the poverty level (%) - American Indian and Alaska Native
Residents with income below the poverty level (%) - Multirace
Residents with income below the poverty level (%) - Other Race
Air pollution - Air Quality Index (AQI)
Air pollution - CO
Air pollution - NO2
Air pollution - SO2
Air pollution - Ozone
Air pollution - PM10
Air pollution - PM25
Air pollution - Pb
Crime - Murders per 100,000 population
Crime - Rapes per 100,000 population
Crime - Robberies per 100,000 population
Crime - Assaults per 100,000 population
Crime - Burglaries per 100,000 population
Crime - Thefts per 100,000 population
Crime - Auto thefts per 100,000 population
Crime - Arson per 100,000 population
Crime - City-data.com crime index
Crime - Violent crime index
Crime - Property crime index
Crime - Murders per 100,000 population (5 year average)
Crime - Rapes per 100,000 population (5 year average)
Crime - Robberies per 100,000 population (5 year average)
Crime - Assaults per 100,000 population (5 year average)
Crime - Burglaries per 100,000 population (5 year average)
Crime - Thefts per 100,000 population (5 year average)
Crime - Auto thefts per 100,000 population (5 year average)
Crime - Arson per 100,000 population (5 year average)
Crime - City-data.com crime index (5 year average)
Crime - Violent crime index (5 year average)
Crime - Property crime index (5 year average)
1996 Presidential Elections Results (%) - Democratic Party (Clinton)
1996 Presidential Elections Results (%) - Republican Party (Dole)
1996 Presidential Elections Results (%) - Other
2000 Presidential Elections Results (%) - Democratic Party (Gore)
2000 Presidential Elections Results (%) - Republican Party (Bush)
2000 Presidential Elections Results (%) - Other
2004 Presidential Elections Results (%) - Democratic Party (Kerry)
2004 Presidential Elections Results (%) - Republican Party (Bush)
2004 Presidential Elections Results (%) - Other
2008 Presidential Elections Results (%) - Democratic Party (Obama)
2008 Presidential Elections Results (%) - Republican Party (McCain)
2008 Presidential Elections Results (%) - Other
2012 Presidential Elections Results (%) - Democratic Party (Obama)
2012 Presidential Elections Results (%) - Republican Party (Romney)
2012 Presidential Elections Results (%) - Other
2016 Presidential Elections Results (%) - Democratic Party (Clinton)
2016 Presidential Elections Results (%) - Republican Party (Trump)
2016 Presidential Elections Results (%) - Other
2020 Presidential Elections Results (%) - Democratic Party (Biden)
2020 Presidential Elections Results (%) - Republican Party (Trump)
2020 Presidential Elections Results (%) - Other
Ancestries Reported - Arab (%)
Ancestries Reported - Czech (%)
Ancestries Reported - Danish (%)
Ancestries Reported - Dutch (%)
Ancestries Reported - English (%)
Ancestries Reported - French (%)
Ancestries Reported - French Canadian (%)
Ancestries Reported - German (%)
Ancestries Reported - Greek (%)
Ancestries Reported - Hungarian (%)
Ancestries Reported - Irish (%)
Ancestries Reported - Italian (%)
Ancestries Reported - Lithuanian (%)
Ancestries Reported - Norwegian (%)
Ancestries Reported - Polish (%)
Ancestries Reported - Portuguese (%)
Ancestries Reported - Russian (%)
Ancestries Reported - Scotch-Irish (%)
Ancestries Reported - Scottish (%)
Ancestries Reported - Slovak (%)
Ancestries Reported - Subsaharan African (%)
Ancestries Reported - Swedish (%)
Ancestries Reported - Swiss (%)
Ancestries Reported - Ukrainian (%)
Ancestries Reported - United States (%)
Ancestries Reported - Welsh (%)
Ancestries Reported - West Indian (%)
Ancestries Reported - Other (%)
Educational Attainment - No schooling completed (%)
Educational Attainment - Less than high school (%)
Educational Attainment - High school or equivalent (%)
Educational Attainment - Less than 1 year of college (%)
Educational Attainment - 1 or more years of college (%)
Educational Attainment - Associate degree (%)
Educational Attainment - Bachelor's degree (%)
Educational Attainment - Master's degree (%)
Educational Attainment - Professional school degree (%)
Educational Attainment - Doctorate degree (%)
School Enrollment - Nursery, preschool (%)
School Enrollment - Kindergarten (%)
School Enrollment - Grade 1 to 4 (%)
School Enrollment - Grade 5 to 8 (%)
School Enrollment - Grade 9 to 12 (%)
School Enrollment - College undergrad (%)
School Enrollment - Graduate or professional (%)
School Enrollment - Not enrolled in school (%)
School enrollment - Public schools (%)
School enrollment - Private schools (%)
School enrollment - Not enrolled (%)
Median number of rooms in houses and condos
Median number of rooms in apartments
Housing units lacking complete plumbing facilities (%)
Housing units lacking complete kitchen facilities (%)
Density of houses
Urban houses (%)
Rural houses (%)
Households with people 60 years and over (%)
Households with people 65 years and over (%)
Households with people 75 years and over (%)
Households with one or more nonrelatives (%)
Households with no nonrelatives (%)
Population in households (%)
Family households (%)
Nonfamily households (%)
Population in families (%)
Family households with own children (%)
Median number of bedrooms in owner occupied houses
Mean number of bedrooms in owner occupied houses
Median number of bedrooms in renter occupied houses
Mean number of bedrooms in renter occupied houses
Median number of vehichles in owner occupied houses
Mean number of vehichles in owner occupied houses
Median number of vehichles in renter occupied houses
Mean number of vehichles in renter occupied houses
Mortgage status - with mortgage (%)
Mortgage status - with second mortgage (%)
Mortgage status - with home equity loan (%)
Mortgage status - with both second mortgage and home equity loan (%)
Mortgage status - without a mortgage (%)
Average family size
Average family size - White
Average family size - Black or African American
Average family size - Asian
Average family size - Hispanic or Latino
Average family size - American Indian and Alaska Native
Average family size - Multirace
Average family size - Other Race
Geographical mobility - Same house 1 year ago (%)
Geographical mobility - Moved within same county (%)
Geographical mobility - Moved from different county within same state (%)
Geographical mobility - Moved from different state (%)
Geographical mobility - Moved from abroad (%)
Place of birth - Born in state of residence (%)
Place of birth - Born in other state (%)
Place of birth - Native, outside of US (%)
Place of birth - Foreign born (%)
Housing units in structures - 1, detached (%)
Housing units in structures - 1, attached (%)
Housing units in structures - 2 (%)
Housing units in structures - 3 or 4 (%)
Housing units in structures - 5 to 9 (%)
Housing units in structures - 10 to 19 (%)
Housing units in structures - 20 to 49 (%)
Housing units in structures - 50 or more (%)
Housing units in structures - Mobile home (%)
Housing units in structures - Boat, RV, van, etc. (%)
House/condo owner moved in on average (years ago)
Renter moved in on average (years ago)
Year householder moved into unit - Moved in 1999 to March 2000 (%)
Year householder moved into unit - Moved in 1995 to 1998 (%)
Year householder moved into unit - Moved in 1990 to 1994 (%)
Year householder moved into unit - Moved in 1980 to 1989 (%)
Year householder moved into unit - Moved in 1970 to 1979 (%)
Year householder moved into unit - Moved in 1969 or earlier (%)
Means of transportation to work - Drove car alone (%)
Means of transportation to work - Carpooled (%)
Means of transportation to work - Public transportation (%)
Means of transportation to work - Bus or trolley bus (%)
Means of transportation to work - Streetcar or trolley car (%)
Means of transportation to work - Subway or elevated (%)
Means of transportation to work - Railroad (%)
Means of transportation to work - Ferryboat (%)
Means of transportation to work - Taxicab (%)
Means of transportation to work - Motorcycle (%)
Means of transportation to work - Bicycle (%)
Means of transportation to work - Walked (%)
Means of transportation to work - Other means (%)
Working at home (%)
Industry diversity
Most Common Industries - Agriculture, forestry, fishing and hunting, and mining (%)
Most Common Industries - Agriculture, forestry, fishing and hunting (%)
Most Common Industries - Mining, quarrying, and oil and gas extraction (%)
Most Common Industries - Construction (%)
Most Common Industries - Manufacturing (%)
Most Common Industries - Wholesale trade (%)
Most Common Industries - Retail trade (%)
Most Common Industries - Transportation and warehousing, and utilities (%)
Most Common Industries - Transportation and warehousing (%)
Most Common Industries - Utilities (%)
Most Common Industries - Information (%)
Most Common Industries - Finance and insurance, and real estate and rental and leasing (%)
Most Common Industries - Finance and insurance (%)
Most Common Industries - Real estate and rental and leasing (%)
Most Common Industries - Professional, scientific, and management, and administrative and waste management services (%)
Most Common Industries - Professional, scientific, and technical services (%)
Most Common Industries - Management of companies and enterprises (%)
Most Common Industries - Administrative and support and waste management services (%)
Most Common Industries - Educational services, and health care and social assistance (%)
Most Common Industries - Educational services (%)
Most Common Industries - Health care and social assistance (%)
Most Common Industries - Arts, entertainment, and recreation, and accommodation and food services (%)
Most Common Industries - Arts, entertainment, and recreation (%)
Most Common Industries - Accommodation and food services (%)
Most Common Industries - Other services, except public administration (%)
Most Common Industries - Public administration (%)
Occupation diversity
Most Common Occupations - Management, business, science, and arts occupations (%)
Most Common Occupations - Management, business, and financial occupations (%)
Most Common Occupations - Management occupations (%)
Most Common Occupations - Business and financial operations occupations (%)
Most Common Occupations - Computer, engineering, and science occupations (%)
Most Common Occupations - Computer and mathematical occupations (%)
Most Common Occupations - Architecture and engineering occupations (%)
Most Common Occupations - Life, physical, and social science occupations (%)
Most Common Occupations - Education, legal, community service, arts, and media occupations (%)
Most Common Occupations - Community and social service occupations (%)
Most Common Occupations - Legal occupations (%)
Most Common Occupations - Education, training, and library occupations (%)
Most Common Occupations - Arts, design, entertainment, sports, and media occupations (%)
Most Common Occupations - Healthcare practitioners and technical occupations (%)
Most Common Occupations - Health diagnosing and treating practitioners and other technical occupations (%)
Most Common Occupations - Health technologists and technicians (%)
Most Common Occupations - Service occupations (%)
Most Common Occupations - Healthcare support occupations (%)
Most Common Occupations - Protective service occupations (%)
Most Common Occupations - Fire fighting and prevention, and other protective service workers including supervisors (%)
Most Common Occupations - Law enforcement workers including supervisors (%)
Most Common Occupations - Food preparation and serving related occupations (%)
Most Common Occupations - Building and grounds cleaning and maintenance occupations (%)
Most Common Occupations - Personal care and service occupations (%)
Most Common Occupations - Sales and office occupations (%)
Most Common Occupations - Sales and related occupations (%)
Most Common Occupations - Office and administrative support occupations (%)
Most Common Occupations - Natural resources, construction, and maintenance occupations (%)
Most Common Occupations - Farming, fishing, and forestry occupations (%)
Most Common Occupations - Construction and extraction occupations (%)
Most Common Occupations - Installation, maintenance, and repair occupations (%)
Most Common Occupations - Production, transportation, and material moving occupations (%)
Most Common Occupations - Production occupations (%)
Most Common Occupations - Transportation occupations (%)
Most Common Occupations - Material moving occupations (%)
People in Group quarters - Institutionalized population (%)
People in Group quarters - Correctional institutions (%)
People in Group quarters - Federal prisons and detention centers (%)
People in Group quarters - Halfway houses (%)
People in Group quarters - Local jails and other confinement facilities (including police lockups) (%)
People in Group quarters - Military disciplinary barracks (%)
People in Group quarters - State prisons (%)
People in Group quarters - Other types of correctional institutions (%)
People in Group quarters - Nursing homes (%)
People in Group quarters - Hospitals/wards, hospices, and schools for the handicapped (%)
People in Group quarters - Hospitals/wards and hospices for chronically ill (%)
People in Group quarters - Hospices or homes for chronically ill (%)
People in Group quarters - Military hospitals or wards for chronically ill (%)
People in Group quarters - Other hospitals or wards for chronically ill (%)
People in Group quarters - Hospitals or wards for drug/alcohol abuse (%)
People in Group quarters - Mental (Psychiatric) hospitals or wards (%)
People in Group quarters - Schools, hospitals, or wards for the mentally retarded (%)
People in Group quarters - Schools, hospitals, or wards for the physically handicapped (%)
People in Group quarters - Institutions for the deaf (%)
People in Group quarters - Institutions for the blind (%)
People in Group quarters - Orthopedic wards and institutions for the physically handicapped (%)
People in Group quarters - Wards in general hospitals for patients who have no usual home elsewhere (%)
People in Group quarters - Wards in military hospitals for patients who have no usual home elsewhere (%)
People in Group quarters - Juvenile institutions (%)
People in Group quarters - Long-term care (%)
People in Group quarters - Homes for abused, dependent, and neglected children (%)
People in Group quarters - Residential treatment centers for emotionally disturbed children (%)
People in Group quarters - Training schools for juvenile delinquents (%)
People in Group quarters - Short-term care, detention or diagnostic centers for delinquent children (%)
People in Group quarters - Type of juvenile institution unknown (%)
People in Group quarters - Noninstitutionalized population (%)
People in Group quarters - College dormitories (includes college quarters off campus) (%)
People in Group quarters - Military quarters (%)
People in Group quarters - On base (%)
People in Group quarters - Barracks, unaccompanied personnel housing (UPH), (Enlisted/Officer), ;and similar group living quarters for military personnel (%)
People in Group quarters - Transient quarters for temporary residents (%)
People in Group quarters - Military ships (%)
People in Group quarters - Group homes (%)
People in Group quarters - Homes or halfway houses for drug/alcohol abuse (%)
People in Group quarters - Homes for the mentally ill (%)
People in Group quarters - Homes for the mentally retarded (%)
People in Group quarters - Homes for the physically handicapped (%)
People in Group quarters - Other group homes (%)
People in Group quarters - Religious group quarters (%)
People in Group quarters - Dormitories (%)
People in Group quarters - Agriculture workers' dormitories on farms (%)
People in Group quarters - Job Corps and vocational training facilities (%)
People in Group quarters - Other workers' dormitories (%)
People in Group quarters - Crews of maritime vessels (%)
People in Group quarters - Other nonhousehold living situations (%)
People in Group quarters - Other noninstitutional group quarters (%)
Residents speaking English at home (%)
Residents speaking English at home - Born in the United States (%)
Residents speaking English at home - Native, born elsewhere (%)
Residents speaking English at home - Foreign born (%)
Residents speaking Spanish at home (%)
Residents speaking Spanish at home - Born in the United States (%)
Residents speaking Spanish at home - Native, born elsewhere (%)
Residents speaking Spanish at home - Foreign born (%)
Residents speaking other language at home (%)
Residents speaking other language at home - Born in the United States (%)
Residents speaking other language at home - Native, born elsewhere (%)
Residents speaking other language at home - Foreign born (%)
Class of Workers - Employee of private company (%)
Class of Workers - Self-employed in own incorporated business (%)
Class of Workers - Private not-for-profit wage and salary workers (%)
Class of Workers - Local government workers (%)
Class of Workers - State government workers (%)
Class of Workers - Federal government workers (%)
Class of Workers - Self-employed workers in own not incorporated business and Unpaid family workers (%)
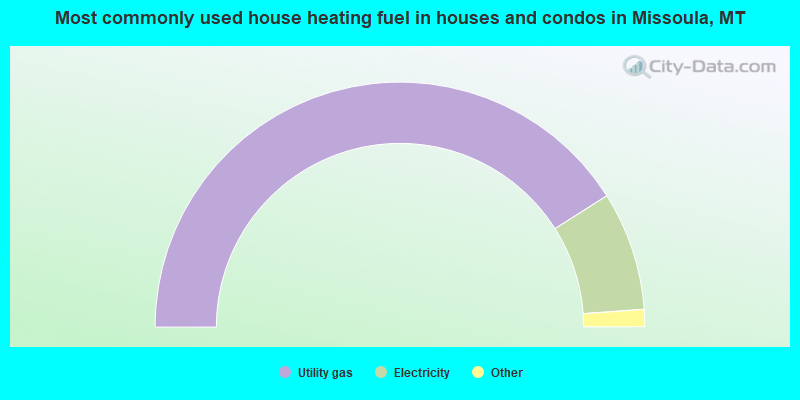
House heating fuel used in houses and condos - Utility gas (%)
House heating fuel used in houses and condos - Bottled, tank, or LP gas (%)
House heating fuel used in houses and condos - Electricity (%)
House heating fuel used in houses and condos - Fuel oil, kerosene, etc. (%)
House heating fuel used in houses and condos - Coal or coke (%)
House heating fuel used in houses and condos - Wood (%)
House heating fuel used in houses and condos - Solar energy (%)
House heating fuel used in houses and condos - Other fuel (%)
House heating fuel used in houses and condos - No fuel used (%)
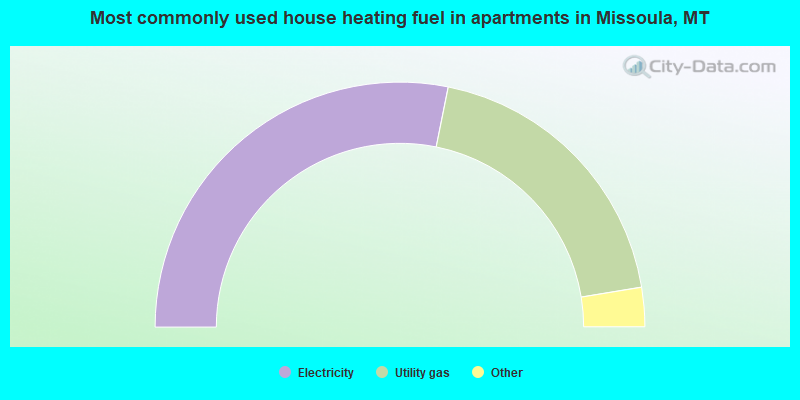
House heating fuel used in apartments - Utility gas (%)
House heating fuel used in apartments - Bottled, tank, or LP gas (%)
House heating fuel used in apartments - Electricity (%)
House heating fuel used in apartments - Fuel oil, kerosene, etc. (%)
House heating fuel used in apartments - Coal or coke (%)
House heating fuel used in apartments - Wood (%)
House heating fuel used in apartments - Solar energy (%)
House heating fuel used in apartments - Other fuel (%)
House heating fuel used in apartments - No fuel used (%)
Armed forces status - In Armed Forces (%)
Armed forces status - Civilian (%)
Armed forces status - Civilian - Veteran (%)
Armed forces status - Civilian - Nonveteran (%)
Fatal accidents locations in years 2005-2021
Fatal accidents locations in 2005
Fatal accidents locations in 2006
Fatal accidents locations in 2007
Fatal accidents locations in 2008
Fatal accidents locations in 2009
Fatal accidents locations in 2010
Fatal accidents locations in 2011
Fatal accidents locations in 2012
Fatal accidents locations in 2013
Fatal accidents locations in 2014
Fatal accidents locations in 2015
Fatal accidents locations in 2016
Fatal accidents locations in 2017
Fatal accidents locations in 2018
Fatal accidents locations in 2019
Fatal accidents locations in 2020
Fatal accidents locations in 2021
Alcohol use - People drinking some alcohol every month (%)
Alcohol use - People not drinking at all (%)
Alcohol use - Average days/month drinking alcohol
Alcohol use - Average drinks/week
Alcohol use - Average days/year people drink much
Audiometry - Average condition of hearing (%)
Audiometry - People that can hear a whisper from across a quiet room (%)
Audiometry - People that can hear normal voice from across a quiet room (%)
Audiometry - Ears ringing, roaring, buzzing (%)
Audiometry - Had a job exposure to loud noise (%)
Audiometry - Had off-work exposure to loud noise (%)
Blood Pressure & Cholesterol - Has high blood pressure (%)
Blood Pressure & Cholesterol - Checking blood pressure at home (%)
Blood Pressure & Cholesterol - Frequently checking blood cholesterol (%)
Blood Pressure & Cholesterol - Has high cholesterol level (%)
Consumer Behavior - Money monthly spent on food at supermarket/grocery store
Consumer Behavior - Money monthly spent on food at other stores
Consumer Behavior - Money monthly spent on eating out
Consumer Behavior - Money monthly spent on carryout/delivered foods
Consumer Behavior - Income spent on food at supermarket/grocery store (%)
Consumer Behavior - Income spent on food at other stores (%)
Consumer Behavior - Income spent on eating out (%)
Consumer Behavior - Income spent on carryout/delivered foods (%)
Current Health Status - General health condition (%)
Current Health Status - Blood donors (%)
Current Health Status - Has blood ever tested for HIV virus (%)
Current Health Status - Left-handed people (%)
Dermatology - People using sunscreen (%)
Diabetes - Diabetics (%)
Diabetes - Had a blood test for high blood sugar (%)
Diabetes - People taking insulin (%)
Diet Behavior & Nutrition - Diet health (%)
Diet Behavior & Nutrition - Milk product consumption (# of products/month)
Diet Behavior & Nutrition - Meals not home prepared (#/week)
Diet Behavior & Nutrition - Meals from fast food or pizza place (#/week)
Diet Behavior & Nutrition - Ready-to-eat foods (#/month)
Diet Behavior & Nutrition - Frozen meals/pizza (#/month)
Drug Use - People that ever used marijuana or hashish (%)
Drug Use - Ever used hard drugs (%)
Drug Use - Ever used any form of cocaine (%)
Drug Use - Ever used heroin (%)
Drug Use - Ever used methamphetamine (%)
Health Insurance - People covered by health insurance (%)
Kidney Conditions-Urology - Avg. # of times urinating at night
Medical Conditions - People with asthma (%)
Medical Conditions - People with anemia (%)
Medical Conditions - People with psoriasis (%)
Medical Conditions - People with overweight (%)
Medical Conditions - Elderly people having difficulties in thinking or remembering (%)
Medical Conditions - People who ever received blood transfusion (%)
Medical Conditions - People having trouble seeing even with glass/contacts (%)
Medical Conditions - People with arthritis (%)
Medical Conditions - People with gout (%)
Medical Conditions - People with congestive heart failure (%)
Medical Conditions - People with coronary heart disease (%)
Medical Conditions - People with angina pectoris (%)
Medical Conditions - People who ever had heart attack (%)
Medical Conditions - People who ever had stroke (%)
Medical Conditions - People with emphysema (%)
Medical Conditions - People with thyroid problem (%)
Medical Conditions - People with chronic bronchitis (%)
Medical Conditions - People with any liver condition (%)
Medical Conditions - People who ever had cancer or malignancy (%)
Mental Health - People who have little interest in doing things (%)
Mental Health - People feeling down, depressed, or hopeless (%)
Mental Health - People who have trouble sleeping or sleeping too much (%)
Mental Health - People feeling tired or having little energy (%)
Mental Health - People with poor appetite or overeating (%)
Mental Health - People feeling bad about themself (%)
Mental Health - People who have trouble concentrating on things (%)
Mental Health - People moving or speaking slowly or too fast (%)
Mental Health - People having thoughts they would be better off dead (%)
Oral Health - Average years since last visit a dentist
Oral Health - People embarrassed because of mouth (%)
Oral Health - People with gum disease (%)
Oral Health - General health of teeth and gums (%)
Oral Health - Average days a week using dental floss/device
Oral Health - Average days a week using mouthwash for dental problem
Oral Health - Average number of teeth
Pesticide Use - Households using pesticides to control insects (%)
Pesticide Use - Households using pesticides to kill weeds (%)
Physical Activity - People doing vigorous-intensity work activities (%)
Physical Activity - People doing moderate-intensity work activities (%)
Physical Activity - People walking or bicycling (%)
Physical Activity - People doing vigorous-intensity recreational activities (%)
Physical Activity - People doing moderate-intensity recreational activities (%)
Physical Activity - Average hours a day doing sedentary activities
Physical Activity - Average hours a day watching TV or videos
Physical Activity - Average hours a day using computer
Physical Functioning - People having limitations keeping them from working (%)
Physical Functioning - People limited in amount of work they can do (%)
Physical Functioning - People that need special equipment to walk (%)
Physical Functioning - People experiencing confusion/memory problems (%)
Physical Functioning - People requiring special healthcare equipment (%)
Prescription Medications - Average number of prescription medicines taking
Preventive Aspirin Use - Adults 40+ taking low-dose aspirin (%)
Reproductive Health - Vaginal deliveries (%)
Reproductive Health - Cesarean deliveries (%)
Reproductive Health - Deliveries resulted in a live birth (%)
Reproductive Health - Pregnancies resulted in a delivery (%)
Reproductive Health - Women breastfeeding newborns (%)
Reproductive Health - Women that had a hysterectomy (%)
Reproductive Health - Women that had both ovaries removed (%)
Reproductive Health - Women that have ever taken birth control pills (%)
Reproductive Health - Women taking birth control pills (%)
Reproductive Health - Women that have ever used Depo-Provera or injectables (%)
Reproductive Health - Women that have ever used female hormones (%)
Sexual Behavior - People 18+ that ever had sex (vaginal, anal, or oral) (%)
Sexual Behavior - Males 18+ that ever had vaginal sex with a woman (%)
Sexual Behavior - Males 18+ that ever performed oral sex on a woman (%)
Sexual Behavior - Males 18+ that ever had anal sex with a woman (%)
Sexual Behavior - Males 18+ that ever had any sex with a man (%)
Sexual Behavior - Females 18+ that ever had vaginal sex with a man (%)
Sexual Behavior - Females 18+ that ever performed oral sex on a man (%)
Sexual Behavior - Females 18+ that ever had anal sex with a man (%)
Sexual Behavior - Females 18+ that ever had any kind of sex with a woman (%)
Sexual Behavior - Average age people first had sex
Sexual Behavior - Average number of female sex partners in lifetime (males 18+)
Sexual Behavior - Average number of female vaginal sex partners in lifetime (males 18+)
Sexual Behavior - Average age people first performed oral sex on a woman (18+)
Sexual Behavior - Average number of woman performed oral sex on in lifetime (18+)
Sexual Behavior - Average number of male sex partners in lifetime (males 18+)
Sexual Behavior - Average number of male anal sex partners in lifetime (males 18+)
Sexual Behavior - Average age people first performed oral sex on a man (18+)
Sexual Behavior - Average number of male oral sex partners in lifetime (18+)
Sexual Behavior - People using protection when performing oral sex (%)
Sexual Behavior - Average number of times people have vaginal or anal sex a year
Sexual Behavior - People having sex without condom (%)
Sexual Behavior - Average number of male sex partners in lifetime (females 18+)
Sexual Behavior - Average number of male vaginal sex partners in lifetime (females 18+)
Sexual Behavior - Average number of female sex partners in lifetime (females 18+)
Sexual Behavior - Circumcised males 18+ (%)
Sleep Disorders - Average hours sleeping at night
Sleep Disorders - People that has trouble sleeping (%)
Smoking-Cigarette Use - People smoking cigarettes (%)
Taste & Smell - People 40+ having problems with smell (%)
Taste & Smell - People 40+ having problems with taste (%)
Taste & Smell - People 40+ that ever had wisdom teeth removed (%)
Taste & Smell - People 40+ that ever had tonsils teeth removed (%)
Taste & Smell - People 40+ that ever had a loss of consciousness because of a head injury (%)
Taste & Smell - People 40+ that ever had a broken nose or other serious injury to face or skull (%)
Taste & Smell - People 40+ that ever had two or more sinus infections (%)
Weight - Average height (inches)
Weight - Average weight (pounds)
Weight - Average BMI
Weight - People that are obese (%)
Weight - People that ever were obese (%)
Weight - People trying to lose weight (%)
The City-Data.com crime index weighs serious crimes and violent crimes more heavily. Higher means more crime, U.S. average is 246.1. It adjusts for the number of visitors and daily workers commuting into cities.
- means the value is smaller than the state average.
- means the value is about the same as the state average.
- means the value is bigger than the state average.
- means the value is much bigger than the state average.
Crime rate in Missoula detailed stats: murders, rapes, robberies, assaults, burglaries, thefts, arson Officers per 1,000 residents here:
1.45Montana average:
1.96
Latest news from Missoula, MT collected exclusively by city-data.com from local newspapers, TV, and radio stations
Ancestries: German (14.5%), Irish (11.0%), English (9.1%), European (8.0%), American (7.2%), Norwegian (6.8%).
Current Local Time:
Incorporated on 03/08/1883
Land area: 23.8 square miles.
Population density: 3,233 people per square mile (average).
2,790 residents are foreign born (1.4% Asia , 1.3% Europe , 0.5% Latin America ).
This city:
3.7%Montana:
2.3%
Median real estate property taxes paid for housing units with mortgages in 2022: $3,780 (0.8%)Median real estate property taxes paid for housing units with no mortgage in 2022: $3,625 (0.9%)
Nearest city with pop. 200,000+: East Seattle, WA (386.3 miles
Nearest city with pop. 1,000,000+: Los Angeles, CA
Nearest cities:
Latitude: 46.86 N, Longitude: 114.01 W
Nickname or alias (official or unofficial): The Garden City
Daytime population change due to commuting: +11,632 (+15.1%)Workers who live and work in this city: 40,701 (86.6%)
Missoula tourist attractions:
Single-family new house construction building permits:
2022: 171 buildings , average cost: $353,8002021: 213 buildings , average cost: $244,0002020: 227 buildings , average cost: $268,1002019: 253 buildings , average cost: $272,7002018: 275 buildings , average cost: $255,8002017: 236 buildings , average cost: $226,4002016: 223 buildings , average cost: $142,1002015: 187 buildings , average cost: $101,9002014: 155 buildings , average cost: $105,7002013: 149 buildings , average cost: $108,4002012: 115 buildings , average cost: $88,5002011: 83 buildings , average cost: $96,1002010: 119 buildings , average cost: $91,5002009: 134 buildings , average cost: $86,2002008: 186 buildings , average cost: $89,9002007: 293 buildings , average cost: $94,8002006: 310 buildings , average cost: $103,4002005: 451 buildings , average cost: $93,0002004: 396 buildings , average cost: $80,2002003: 428 buildings , average cost: $94,8002002: 396 buildings , average cost: $98,9002001: 280 buildings , average cost: $93,5002000: 298 buildings , average cost: $96,4001999: 290 buildings , average cost: $111,6001998: 270 buildings , average cost: $106,9001997: 242 buildings , average cost: $100,700Unemployment in December 2023:
Population change in the 1990s: +8,473 (+17.4%).
Most common occupations in Missoula, MT (%)
Both Males Females
Cooks and food preparation workers (11.3%)
Other management occupations, except farmers and farm managers (5.5%)
Building and grounds cleaning and maintenance occupations (5.0%)
Waiters and waitresses (4.0%)
Postsecondary teachers (2.9%)
Retail sales workers, except cashiers (2.8%)
Cashiers (2.6%)
Cooks and food preparation workers (9.5%)
Building and grounds cleaning and maintenance occupations (6.5%)
Other management occupations, except farmers and farm managers (4.7%)
Laborers and material movers, hand (3.7%)
Construction traders workers except carpenters, electricians, painters, plumbers, and construction laborers (3.3%)
Life and physical scientists (3.0%)
Retail sales workers, except cashiers (2.9%)
Cooks and food preparation workers (13.1%)
Waiters and waitresses (6.9%)
Other management occupations, except farmers and farm managers (6.2%)
Secretaries and administrative assistants (4.0%)
Registered nurses (3.9%)
Information and record clerks, except customer service representatives (3.8%)
Building and grounds cleaning and maintenance occupations (3.5%)
Earthquake activity:
Missoula-area historical earthquake activity is significantly above Montana state average. It is 931% greater than the overall U.S. average. On 8/18/1959 at 06:37:13, a magnitude 7.7 (7.7 UK, Class: Major, Intensity: VIII - XII) earthquake occurred 226.9 miles away from Missoula center, causing $26,000,000 total damage On 10/28/1983 at 14:06:06, a magnitude 7.3 (6.2 MB, 7.3 MS, 7.0 MW) earthquake occurred 192.9 miles away from Missoula center, causing 2 deaths ( 2 shaking deaths) and 3 injuries, causing $15,000,000 total damage On 3/31/2020 at 23:52:30, a magnitude 6.5 (6.5 MW, Depth: 7.5 mi, Class: Strong, Intensity: VII - IX) earthquake occurred 174.3 miles away from the city center On 7/6/2017 at 06:30:17, a magnitude 5.8 (5.8 MW, Depth: 7.6 mi, Class: Moderate, Intensity: VI - VII) earthquake occurred 67.9 miles away from the city center On 10/3/1915 at 06:52:48, a magnitude 7.6 (7.6 UK) earthquake occurred 473.3 miles away from Missoula center On 7/26/2005 at 04:08:37, a magnitude 5.7 (5.7 MB, 5.2 MS, 5.6 MW) earthquake occurred 122.6 miles away from the city center Magnitude types: body-wave magnitude (MB), surface-wave magnitude (MS), moment magnitude (MW) Natural disasters: The number of natural disasters in Missoula County (14) is near the US average (15).Major Disasters (Presidential) Declared: 6Emergencies Declared: 2Fires: 5, Floods: 5, Storms: 5, Drought: 1, Hurricane: 1, Landslide: 1, Snow: 1, Other: 1 (Note: some incidents may be assigned to more than one category). Hospitals in Missoula: COMMUNITY MEDICAL CENTER INC (Voluntary non-profit - Private, provides emergency services, 2827 FORT MISSOULA RD) HOSPICE OF MISSOULA LLC (800 KENSINGTON AVE STE 209) MISSOULA GENERAL HOSPITAL (900 NORTH ORANGE STREET) ST PATRICK HOSPITAL (Voluntary non-profit - Church, 500 W BROADWAY) Nursing Homes in Missoula: HILLSIDE HEALTH CARE CENTER (4720 23RD AVE) MISSOULA HEALTH AND REHABILITATION CENTER (3018 RATTLESNAKE DR) RIVERSIDE HEALTH CARE CENTER (1301 E BROADWAY) VILLAGE HEALTH CARE CENTER (2651 SOUTH AVE W) WAYSIDE NH (2222 RATTLESNAKE DR) WAYSIDE NURSING HOME (2222 RATTLESNAKE DRIVE) Dialysis Facilities in Missoula: FMC MISSOULA (615 W ALDER) Home Health Centers in Missoula: HOME HEALTH OF MONTANA (1903 SO RUSSELL ST #1) PARTNERS IN HOME CARE INC (2687 PALMER ST STE B)
Colleges/Universities in Missoula: The University of Montana Full-time enrollment: 13,602; Location: Missoula, Montana; Public; Website: www.umt.edu; Offers Doctor's degree )
Modern Beauty School Inc Full-time enrollment: 51; Location: 2700 Paxson Street #G; Private, for-profit; Website: modernbeautyschool.org)
Other colleges/universities with over 2000 students near Missoula:
North Idaho College (about 143 miles; Coeur d'Alene, ID ; Full-time enrollment: 4,684)
University of Idaho (about 143 miles; Moscow, ID ; FT enrollment: 10,416)
Lewis-Clark State College (about 147 miles; Lewiston, ID ; FT enrollment: 3,199)
Washington State University (about 150 miles; Pullman, WA ; FT enrollment: 25,055)
Montana State University (about 164 miles; Bozeman, MT ; FT enrollment: 12,942)
Spokane Community College (about 167 miles; Spokane, WA ; FT enrollment: 6,482)
Gonzaga University (about 169 miles; Spokane, WA ; FT enrollment: 6,780)
Public high schools in Missoula:
Private high schools in Missoula: VALLEY CHRISTIAN SCHOOL Students: 227, Location: 2526 SUNSET LN, Grades: PK-12)
LIGHTHOUSE BAPTIST ACADEMY Students: 13, Location: 5425 GHARRETT AVE, Grades: 1-9)
Biggest public elementary/middle schools in Missoula: LOWER GRADE HELLGATE Students: 810, Location: 2385 FLYNN LANE, Grades: PK-5)PORTER MIDDLE SCHOOL Students: 546, Location: 2510 CENTRAL AVENUE, Grades: 6-8)MEADOW HILL MIDDLE SCHOOL Students: 507, Location: 4210 RESERVE, Grades: 6-8)CHIEF CHARLO SCHOOL Students: 466, Location: 5600 LONGVIEW DR, Grades: PK-5)COLD SPRINGS SCHOOL Students: 465, Location: 2625 BRIGGS STREET, Grades: PK-5)PAXSON SCHOOL Students: 394, Location: 101 EVANS, Grades: PK-5)HELLGATE MIDDLE SCHOOL Students: 393, Location: 2385 FLYNN LANE, Grades: 6-8)RATTLESNAKE ELEMENTARY SCHOOL Students: 353, Location: 1220 PINEVIEW DRIVE, Grades: PK-5)RUSSELL SCHOOL Students: 299, Location: 3216 RUSSELL STREET, Grades: PK-5)FRANKLIN SCHOOL Students: 294, Location: 1901 SOUTH 10TH WEST, Grades: PK-5)Private elementary/middle schools in Missoula: ST JOSEPH SCHOOL Students: 299, Location: 503 EDITH ST, Grades: PK-8)
MISSOULA INT'L SCHOOL Students: 173, Location: 1100 HARRISON ST, Grades: PK-8)
SUSSEX SCHOOL Students: 116, Location: 1800 S 2ND ST W, Grades: KG-8)
CLARK FORK SCHOOL Students: 87, Location: 2525 RATTLESNAKE DR, Grades: PK-4)
See full list of schools located in Missoula Library in Missoula: MISSOULA PUBLIC LIBRARY Operating income: $2,592,484; Location: 301 E MAIN; 217,030 books ; 9,111 e-books ; 12,709 audio materials ; 8,006 video materials ; 14 local licensed databases ; 56 state licensed databases ; 519 print serial subscriptions ; 1 electronic serial subscriptions )
User-submitted facts and corrections:
The Downtown School no longer exists. Several new private schools have since opened, including the Missoula International School, Kinderhaus Montessori, and Missoula Community School.
Notable locations in Missoula: (A) , Highlands Golf Club (B) , University of Montana Golf Course (C) , KOA El-Mar Kampground (D) , Missoula County Fairgrounds (E) , Missoula (F) , Northgate Plaza (G) , South Center (H) , Caras Plaza (I) , Post (J) , Missoula County Detention Facility (K) , Montana Highway Patrol District I Office (L) , University of Montana Police Department (M) , United States Marshal's Service Missoula Office (N) , Missoula Fire Department Station 2 (O) , Missoula Fire Department Station 1 (P) , Saint Patrick Hosptal Emergency Services (Q) , Saint Patrick Hospital Life Flight (R) , Rocky Mountain Elk Foundation Wildlife Visitor Center (S) , Missoula Museum of the Arts (T) . Display/hide their locations on the map
Shopping Centers: (1) , Town and Country Shopping Center (2) , Lewis and Clark Shopping Center (3) , Holiday Village Shopping Center (4) , Fairway Shopping Center (5) , Trempers Shopping Center (6) , Southgate Mall (7) . Display/hide their locations on the map
Churches in Missoula include: (A) , Glad Tidings Assembly of God Church (B) , Community Covenant Church (C) , Missoula Free Methodist Church (D) , Seventh Day Adventist Church (E) , Immanuel Lutheran Church (F) , Baha'i Center (G) , Emmanuel Baptist Church (H) , Spirit of Peace Alternative Church (I) . Display/hide their locations on the map
Cemeteries: (1) , Saint Mary Cemetery (2) . Display/hide their locations on the map
Creeks: (A) , Rattlesnake Creek (B) . Display/hide their locations on the map
Parks in Missoula include: (1) , Bonner Park (2) , Boyd Park (3) , Rankin Park (4) , Jacobs Island Park (5) , Caras Park (6) , Bess Reed Park (7) , Toole Park (8) , Burlington Northern Plaza (9) . Display/hide their locations on the map
Tourist attractions: (1) , Historical Museum at Fort Missoula (Fort Missoula) (2) , Missoula Art Museum (111 North Higgins Avenue Suite 500) (3) , National Museum of Forest Service History (1615 South Catlin Street) (4) , Montana Natural History Center (Museums; Post Headqurtrs Boulevard) (5) , Museum of Mountain Flying (5525 Highway 10 West) (6) , University of Montana - Montana Museum of Art & Culture (Um Par Tv Building) (7) , Fleetwood Gaming Inc (Amusement & Theme Parks; 2104 South Reserve Street) (8) , Century Gaming Inc (Amusement & Theme Parks; 3101 South Russell Street) (9) . Display/hide their approximate locations on the map
Hotels: (1) , Comfort Inn Missoula (4545 North Reserve Street) (2) , Sleepy Inn Motel (1427 West Broadway Street) (3) , Thunderbird Motel (1009 East Broadway Street) (4) , Brownies Plus Motel (1540 West Broadway Street) (5) , City Center Motel (338 East Broadway Street) (6) , WM Watt Inc (3333 Brooks Street) (7) , Southgate Inn (3530 Brooks Street) (8) , Best Inn - South (3803 Brooks Street) (9) . Display/hide their approximate locations on the map
Court: (1) . Display/hide its approximate location on the map
Birthplace of: Tye Fields - Basketball player, David Lynch - (born 1946), film director, Bobby Hauck - College football coach, Dana Carvey - Comedian, Hubert Zemke - World War II officer, Larry Krystkowiak - Basketball player and coach, Jim McElwain - Football player and coach, Jesse Tyler Ferguson - Film actor, Tommy Moe - Alpine skier, Brad Pelo - Chief executive.
Missoula County has a predicted average indoor radon screening level greater than 4 pCi/L (pico curies per liter) - Highest Potential Drinking water stations with addresses in Missoula and their reported violations in the past:
MOUNTAIN WATER COMPANY (Population served: 56,335, Groundwater):
Past monitoring violations:
One regular monitoring violation
Population served: 1,350, Groundwater):
Past monitoring violations:
One routine major monitoring violation
One regular monitoring violation
Population served: 550, Surface water):
Past monitoring violations:
Monitoring of Treatment (SWTR-Filter) - In DEC-2005. Follow-up actions: St Compliance achieved (MAY-08-2006)
Monitoring of Treatment (SWTR-Filter) - In DEC-2005. Follow-up actions: St Compliance achieved (MAY-08-2006)
Monitoring of Treatment (SWTR-Filter) - In NOV-2005. Follow-up actions: St Violation/Reminder Notice (FEB-08-2006), St Compliance achieved (MAY-08-2006), St Public Notif requested (MAY-08-2006)
Monitoring of Treatment (SWTR-Filter) - In OCT-2005. Follow-up actions: St Violation/Reminder Notice (FEB-08-2006), St Compliance achieved (MAY-08-2006), St Public Notif requested (MAY-08-2006)
Monitoring of Treatment (SWTR-Filter) - In OCT-2005. Follow-up actions: St Violation/Reminder Notice (FEB-08-2006), St Compliance achieved (MAY-08-2006), St Public Notif requested (MAY-08-2006)
One other older monitoring violation
Population served: 504, Groundwater):
Past health violations:
MCL, Monthly (TCR) - In OCT-2008, Contaminant: Coliform. Follow-up actions: St Violation/Reminder Notice (2 times from OCT-07-2008 to OCT-07-2008), St Public Notif requested (OCT-07-2008), St Public Notif received (NOV-07-2008), St Other (MAR-18-2009), St AO (w/penalty) issued (APR-30-2009), St Compliance achieved (DEC-29-2009)
MCL, Monthly (TCR) - In SEP-2008, Contaminant: Coliform. Follow-up actions: St Violation/Reminder Notice (2 times from OCT-03-2008 to OCT-03-2008), St Public Notif requested (OCT-03-2008), St Other (MAR-18-2009), St AO (w/penalty) issued (APR-30-2009), St Compliance achieved (DEC-29-2009)
Past monitoring violations:
4 routine major monitoring violations
2 regular monitoring violations
Population served: 501, Groundwater):
Past monitoring violations:
2 routine major monitoring violations
2 minor monitoring violations
Population served: 453, Groundwater):
Past health violations:
MCL, Monthly (TCR) - In SEP-2005, Contaminant: Coliform. Follow-up actions: St Violation/Reminder Notice (2 times from OCT-01-2005 to OCT-01-2005), St Public Notif requested (OCT-01-2005), St Public Notif received (OCT-05-2005), St Compliance achieved (MAY-15-2009)
MCL, Monthly (TCR) - In JUL-2005, Contaminant: Coliform. Follow-up actions: St Violation/Reminder Notice (2 times from JUL-07-2005 to JUL-07-2005), St Public Notif requested (JUL-07-2005), St Public Notif received (JUL-08-2005), St Compliance achieved (SEP-27-2005)
Past monitoring violations:
Monitoring and Reporting (DBP) - Between JAN-2012 and MAR-2012, Contaminant: Chlorine. Follow-up actions: St Public Notif requested (APR-13-2012), St Violation/Reminder Notice (APR-13-2012), St Public Notif received (APR-24-2012), St Compliance achieved (FEB-19-2013)
Follow-up Or Routine LCR Tap M/R - In OCT-01-2008, Contaminant: Lead and Copper Rule. Follow-up actions: St Compliance achieved (SEP-18-2008), St Public Notif requested (NOV-01-2008), St Violation/Reminder Notice (NOV-01-2008)
One routine major monitoring violation
22 regular monitoring violations
Address: BUILDING 24 FORT MISSOULA RD Population served: 404, Groundwater):
Past monitoring violations:
One routine major monitoring violation
Population served: 345, Groundwater):
Past monitoring violations:
Monitoring and Reporting (DBP) - Between JAN-2012 and MAR-2012, Contaminant: Chlorine. Follow-up actions: St Public Notif requested (APR-13-2012), St Violation/Reminder Notice (APR-13-2012), St Public Notif received (APR-24-2012), St Compliance achieved (FEB-19-2013)
Water Quality Parameter M/R - Between JAN-2006 and DEC-2006, Contaminant: Lead and Copper Rule. Follow-up actions: St Public Notif requested (AUG-02-2007), St Violation/Reminder Notice (AUG-02-2007), St Compliance achieved (SEP-06-2007)
Water Quality Parameter M/R - Between JAN-2005 and DEC-2005, Contaminant: Lead and Copper Rule. Follow-up actions: St Public Notif requested (AUG-02-2007), St Violation/Reminder Notice (AUG-02-2007), St Compliance achieved (SEP-06-2007)
One minor monitoring violation
Drinking water stations with addresses in Missoula that have no violations reported:
CATRINA WATER COMPANY (Population served: 168, Primary Water Source Type: Groundwater)
SALMON LAKE STATE PARK CG (Population served: 102, Primary Water Source Type: Groundwater)
BUENA VISTA TR CT (Population served: 90, Primary Water Source Type: Groundwater)
CAROLS TRAILER COURT (Population served: 46, Primary Water Source Type: Groundwater)
Average household size: This city:
2.2 peopleMontana:
2.4 people
Percentage of family households: This city:
48.1%Whole state:
62.8%
Percentage of households with unmarried partners: This city:
9.2%Whole state:
6.7%
Likely homosexual households (counted as self-reported same-sex unmarried-partner households)
Lesbian couples: 0.5% of all households Gay men: 0.2% of all households
People in group quarters in Missoula in 2010:
2,284 people in college/university student housing
374 people in nursing facilities/skilled-nursing facilities
292 people in correctional residential facilities
249 people in other noninstitutional facilities
111 people in emergency and transitional shelters (with sleeping facilities) for people experiencing homelessness
78 people in group homes intended for adults
49 people in residential treatment centers for juveniles (non-correctional)
26 people in group homes for juveniles (non-correctional)
20 people in residential treatment centers for adults
14 people in correctional facilities intended for juveniles
11 people in local jails and other municipal confinement facilities
11 people in workers' group living quarters and job corps centers
People in group quarters in Missoula in 2000:
2,049 people in college dormitories (includes college quarters off campus)
274 people in local jails and other confinement facilities (including police lockups)
248 people in other group homes
232 people in other noninstitutional group quarters
178 people in other workers' dormitories
108 people in nursing homes
88 people in other types of correctional institutions
57 people in homes for the physically handicapped
25 people in homes for the mentally ill
12 people in mental (psychiatric) hospitals or wards
9 people in other nonhousehold living situations
5 people in hospitals/wards and hospices for chronically ill
5 people in hospices or homes for chronically ill
Banks with most branches in Missoula (2011 data):
First Security Bank of Missoula: 8 branches. Info updated 2011/05/11: Bank assets: $1,103.5 mil, Deposits: $732.7 mil, local headquarters , positive income , Commercial Lending Specialization, 12 total offices , Holding Company: Glacier Bancorp, Inc.
First Interstate Bank: Missoula North Branch, Missoula Drive-Up Branch, Missoula Downtown Branch, Missoula Albertsons Branch, Missoula South Branch. Info updated 2009/10/09: Bank assets: $7,294.7 mil, Deposits: $5,827.2 mil, headquarters in Billings, MT, positive income , Commercial Lending Specialization, 76 total offices , Holding Company: First Interstate Bancsystem, Inc.
Mountain West Bank, National Association: North Missoula Branch, Missoula Branch, Missoula Southgate Branch. Info updated 2009/06/05: Bank assets: $640.8 mil, Deposits: $544.6 mil, headquarters in Helena, MT, positive income , Commercial Lending Specialization, 13 total offices , Holding Company: Mountain West Financial Corp.
Wells Fargo Bank, National Association: Reserve & Union Pacific Branch, Missoula Downtown Branch, Missoula South Branch. Info updated 2011/04/05: Bank assets: $1,161,490.0 mil, Deposits: $905,653.0 mil, headquarters in Sioux Falls, SD, positive income , 6395 total offices , Holding Company: Wells Fargo & Company
U.S. Bank National Association: Southside Branch, Missoula Branch, Missoula Russell Branch. Info updated 2012/01/30: Bank assets: $330,470.8 mil, Deposits: $236,091.5 mil, headquarters in Cincinnati, OH, positive income , 3121 total offices , Holding Company: U.S. Bancorp
Community Bank - Missoula: at 3010 American Way, Broadway Branch, Southside Branch. Info updated 2006/11/03: Bank assets: $79.9 mil, Deposits: $65.8 mil, local headquarters , positive income , Commercial Lending Specialization, 3 total offices , Holding Company: Montana Community Banks, Inc.
First Montana Bank, Inc.: Missoula Branch at 201 North Higgins, branch established on 1998/08/05; Missoula Brooks Street Branch at 3309 Brooks St, branch established on 1999/02/01. Info updated 2010/01/27: Bank assets: $295.7 mil, Deposits: $243.2 mil, headquarters in Libby, MT, positive income , Commercial Lending Specialization, 9 total offices , Holding Company: First National Bancorp, Inc.
Sterling Savings Bank: Missoula-Reserve Street Branch at 1510 S Reserve Street, branch established on 1996/06/30; Missoula-Downtown Branch at 200 North Higgins, branch established on 1911/01/01. Info updated 2012/03/21: Bank assets: $9,207.8 mil, Deposits: $6,454.1 mil, headquarters in Spokane, WA, positive income , Commercial Lending Specialization, 192 total offices , Holding Company: Sterling Financial Corporation
Bitterroot Valley Bank: Airway Boulevard Branch at 5600 Airway Boulevard, branch established on 2004/10/12. Info updated 2012/01/24: Bank assets: $192.3 mil, Deposits: $141.9 mil, headquarters in Lolo, MT, positive income , Commercial Lending Specialization, 10 total offices , Holding Company: Bitterroot Holding Company
4 other banks with 4 local branches
For population 15 years and over in Missoula:
Never married: 47.5%Now married: 36.0%Separated: 0.6%Widowed: 4.4%Divorced: 11.6% For population 25 years and over in Missoula:
High school or higher: 96.6%Bachelor's degree or higher: 50.6%Graduate or professional degree: 18.7%Unemployed: 7.5%Mean travel time to work (commute): 14.0 minutes
Education Gini index (Inequality in education) Here:
8.9Montana average:
10.0
Religion statistics for Missoula, MT (based on Missoula County data)
Religion Adherents Congregations Catholic 9,800 8 Evangelical Protestant 8,936 53 Mainline Protestant 6,409 17 Other 5,916 22 Orthodox 120 1 None 78,118 -
Source: Clifford Grammich, Kirk Hadaway, Richard Houseal, Dale E.Jones, Alexei Krindatch, Richie Stanley and Richard H.Taylor. 2012. 2010 U.S.Religion Census: Religious Congregations & Membership Study. Association of Statisticians of American Religious Bodies. Jones, Dale E., et al. 2002. Congregations and Membership in the United States 2000. Nashville, TN: Glenmary Research Center. Graphs represent county-level data
Food Environment Statistics: Number of grocery stores : 19This county :
1.80 / 10,000 pop.Montana :
2.55 / 10,000 pop.
Number of supercenters and club stores : 2Missoula County :
0.19 / 10,000 pop.Montana :
0.20 / 10,000 pop.
Number of convenience stores (no gas) : 3This county :
0.28 / 10,000 pop.Montana :
0.48 / 10,000 pop.
Number of convenience stores (with gas) : 38Missoula County :
3.60 / 10,000 pop.Montana :
4.69 / 10,000 pop.
Number of full-service restaurants : 97Here :
9.18 / 10,000 pop.State :
10.38 / 10,000 pop.
Adult diabetes rate : This county :
5.5%Montana :
7.2%
Adult obesity rate : Missoula County :
19.2%Montana :
23.1%
Low-income preschool obesity rate : Missoula County :
9.2%State :
10.7%
Health and Nutrition: Healthy diet rate : Missoula:
53.2%State:
51.9%
Average overall health of teeth and gums : Missoula:
54.6%Montana:
50.3%
Average BMI : This city:
27.8Montana:
28.6
People feeling badly about themselves : Missoula:
19.6%Montana:
20.5%
People not drinking alcohol at all : Missoula:
8.8%Montana:
9.1%
Average hours sleeping at night : Overweight people : Missoula:
31.2%State:
34.8%
General health condition : Missoula:
62.2%State:
58.6%
Average condition of hearing : This city:
81.7%State:
79.0%
More about Health and Nutrition of Missoula, MT Residents
Local government employment and payroll (March 2022)
Function
Full-time employees
Monthly full-time payroll
Average yearly full-time wage
Part-time employees
Monthly part-time payroll
Parks and Recreation
140 $343,201 $29,417 0 $0 Police Protection - Officers
116 $922,614 $95,443 0 $0 Other Government Administration
102 $515,656 $60,665 1 $554 Firefighters
84 $752,519 $107,503 0 $0 Streets and Highways
59 $302,247 $61,474 0 $0 Judicial and Legal
37 $212,244 $68,836 0 $0 Water Supply
35 $209,105 $71,693 1 $547 Police - Other
34 $131,728 $46,492 0 $0 Housing and Community Development (Local)
30 $161,915 $64,766 0 $0 Financial Administration
30 $152,540 $61,016 0 $0 Sewerage
22 $128,257 $69,958 0 $0 Other and Unallocable
18 $93,886 $62,591 0 $0 Fire - Other
14 $109,052 $93,473 0 $0 Solid Waste Management
13 $68,510 $63,240 0 $0 Welfare
2 $7,171 $43,026 0 $0
Totals for Government
736 $4,110,643 $67,021 2 $1,101
Missoula government finances - Expenditure in 2021 (per resident):
Construction - Water Utilities: $3,700,000 ($48.08)
Regular Highways: $2,919,000 ($37.93)Housing and Community Development: $815,000 ($10.59)Parks and Recreation: $721,000 ($9.37)Police Protection: $70,000 ($0.91)Miscellaneous Commercial Activities - Other: $24,000 ($0.31)Sewerage: $14,000 ($0.18)Current Operations - Police Protection: $19,786,000 ($257.11)
Local Fire Protection: $17,335,000 ($225.26)General - Other: $10,976,000 ($142.63)Water Utilities: $10,184,000 ($132.34)Sewerage: $7,988,000 ($103.80)Parks and Recreation: $7,463,000 ($96.98)Regular Highways: $6,696,000 ($87.01)Central Staff Services: $5,097,000 ($66.23)Judicial and Legal Services: $3,304,000 ($42.93)Miscellaneous Commercial Activities - Other: $3,217,000 ($41.80)Protective Inspection and Regulation - Other: $2,882,000 ($37.45)Housing and Community Development: $2,708,000 ($35.19)Health - Other: $2,173,000 ($28.24)Parking Facilities: $1,717,000 ($22.31)Financial Administration: $1,365,000 ($17.74)Natural Resources - Other: $1,341,000 ($17.43)Public Welfare - Other: $713,000 ($9.27)General - Interest on Debt: $3,541,000 ($46.01)
Other Capital Outlay - Housing and Community Development: $6,427,000 ($83.52)
Local Fire Protection: $999,000 ($12.98)Police Protection: $936,000 ($12.16)Central Staff Services: $770,000 ($10.01)Regular Highways: $235,000 ($3.05)Parks and Recreation: $185,000 ($2.40)Miscellaneous Commercial Activities - Other: $63,000 ($0.82)Water Utilities - Interest on Debt: $4,173,000 ($54.23)
Missoula government finances - Revenue in 2021 (per resident):
Charges - Sewerage: $9,512,000 ($123.60)
Other: $9,244,000 ($120.12)Parking Facilities: $2,328,000 ($30.25)Parks and Recreation: $2,303,000 ($29.93)Federal Intergovernmental - Housing and Community Development: $2,311,000 ($30.03)
Other: $1,659,000 ($21.56)General Local Government Support: $159,000 ($2.07)Miscellaneous - Special Assessments: $9,233,000 ($119.98)
General Revenue - Other: $1,363,000 ($17.71)Fines and Forfeits: $821,000 ($10.67)Donations From Private Sources: $691,000 ($8.98)Rents: $580,000 ($7.54)Sale of Property: $129,000 ($1.68)Interest Earnings: $100,000 ($1.30)Revenue - Water Utilities: $18,698,000 ($242.97)
State Intergovernmental - Other: $6,817,000 ($88.58)
General Local Government Support: $6,779,000 ($88.09)Highways: $3,388,000 ($44.03)Health and Hospitals: $63,000 ($0.82)Tax - Property: $35,714,000 ($464.09)
Other License: $2,603,000 ($33.82)Occupation and Business License - Other: $1,387,000 ($18.02)
Missoula government finances - Debt in 2021 (per resident):
Long Term Debt - Outstanding Unspecified Public Purpose: $188,084,000 ($2444.08)
Beginning Outstanding - Unspecified Public Purpose: $186,715,000 ($2426.29)Beginning Outstanding - Public Debt for Private Purpose: $13,555,000 ($176.14)Outstanding Nonguaranteed - Industrial Revenue: $13,555,000 ($176.14)Issue, Unspecified Public Purpose: $8,546,000 ($111.05)Retired Unspecified Public Purpose: $7,177,000 ($93.26)
Missoula government finances - Cash and Securities in 2021 (per resident):
Bond Funds - Cash and Securities: $958,000 ($12.45)
Other Funds - Cash and Securities: $22,499,000 ($292.37)
Sinking Funds - Cash and Securities: $1,666,000 ($21.65)
Businesses in Missoula, MT
Name Count Name Count
Abercrombie & Fitch 1 Kincaid 1 Ace Hardware 2 Kmart 1 Aeropostale 1 La Quinta 1 Albertsons 4 La-Z-Boy 2 AmericInn 1 Lane Furniture 4 American Eagle Outfitters 1 LensCrafters 1 Applebee's 1 Little Caesars Pizza 2 Arby's 2 Lowe's 1 Ashley Furniture 1 MasterBrand Cabinets 8 Barnes & Noble 1 Maurices 1 Baskin-Robbins 1 Mazda 1 Bath & Body Works 1 McDonald's 4 Bed Bath & Beyond 1 Motel 6 2 Best Western 1 Motherhood Maternity 1 Budget Car Rental 1 New Balance 4 Burger King 2 Nike 12 CVS 1 Nissan 1 Carson Pirie Scott 1 Old Navy 1 Chevrolet 1 Outback 1 Chico's 1 Outback Steakhouse 1 Cold Stone Creamery 1 Pac Sun 1 Coldwater Creek 1 Payless 1 Costco 1 PetSmart 1 Cracker Barrel 1 Pier 1 Imports 1 Curves 1 Pizza Hut 3 Dairy Queen 5 Quality 1 Days Inn 1 Quiznos 1 Decora Cabinetry 1 RadioShack 2 Dennys 1 Red Robin 1 Domino's Pizza 1 SAS Shoes 1 Dressbarn 1 Safeway 2 Econo Lodge 1 Sears 2 Famous Footwear 1 Sleep Inn 1 FedEx 26 Spencer Gifts 1 Finish Line 1 Staples 2 Firestone Complete Auto Care 1 Starbucks 4 Ford 1 Subaru 1 GNC 1 Subway 8 GameStop 1 Super 8 4 Gap 1 T.J.Maxx 1 Goodwill 1 Taco Bell 3 Gymboree 1 Target 1 H&R Block 5 Toyota 1 Haworth 1 U-Haul 7 Hawthorn 1 UPS 25 Hilton 2 Vans 5 Holiday Inn 4 Verizon Wireless 4 Hollister Co. 1 Victoria's Secret 1 Home Depot 1 Volkswagen 1 Honda 1 Vons 2 Hot Topic 1 Walgreens 2 IHOP 1 Walmart 2 JCPenney 1 Wendy's 2 Jimmy John's 1 Wet Seal 1 Jones New York 3 Wingate 1 Journeys 1 YMCA 1 Justice 1
Strongest AM radio stations in Missoula:
KLCY (930 AM; 5 kW; EAST MISSOULA, MT; Owner: CAPSTAR TX LIMITED PARTNERSHIP)
KGVO (1290 AM; 5 kW; MISSOULA, MT; Owner: CAPSTAR TX LIMITED PARTNERSHIP)
KYLT (1340 AM; 1 kW; MISSOULA, MT; Owner: FISHER RADIO REGIONAL GROUP, INC.)
KGRZ (1450 AM; 1 kW; MISSOULA, MT; Owner: FISHER RADIO REGIONAL GROUP, INC.)
KERR (750 AM; 50 kW; POLSON, MT; Owner: ANDERSON RADIO BROADCASTING, INC.)
KOFI (1180 AM; 50 kW; KALISPELL, MT; Owner: KOFI, INC.)
KGA (1510 AM; 50 kW; SPOKANE, WA; Owner: CITADEL BROADCASTING COMPANY)
KBOI (670 AM; 50 kW; BOISE, ID; Owner: CITADEL BROADCASTING COMPANY)
KBOW (550 AM; 5 kW; BUTTE, MT; Owner: BUTTE BROADCASTING INCORPORATED)
KJJR (880 AM; 10 kW; WHITEFISH, MT; Owner: BEE BROADCASTING, INCORPORATED)
KQQQ (1150 AM; 25 kW; PULLMAN, WA; Owner: RADIO PALOUSE, INC.)
KGEZ (600 AM; 5 kW; KALISPELL, MT; Owner: SKYLINE BROADCASTERS, INC.)
KTBI (810 AM; daytime; 50 kW; EPHRATA, WA; Owner: TACOMA BROADCASTERS, INCORPORATED)
Strongest FM radio stations in Missoula:
KBQQ (106.7 FM; PINESDALE, MT; Owner: FISHER RADIO REGIONAL GROUP INC.)
KZOQ-FM (100.1 FM; MISSOULA, MT; Owner: FISHER RADIO REGIONAL GROUP, INC.)
KMZL (91.1 FM; MISSOULA, MT; Owner: FAITH COMMUNICATIONS CORP.)
KMSO (102.5 FM; MISSOULA, MT; Owner: SHEILA CALLAHAN & FRIENDS, INC)
K204EV (88.7 FM; MISSOULA, MT; Owner: CALVARY CHAPEL OF TWIN FALLS, INC.)
KGGL (93.3 FM; MISSOULA, MT; Owner: FISHER RADIO REGIONAL GROUP, INC.)
KYSS-FM (94.9 FM; MISSOULA, MT; Owner: CAPSTAR TX LIMITED PARTNERSHIP)
KUFM (89.1 FM; MISSOULA, MT; Owner: UNIVERSITY OF MONTANA)
K218AI (91.5 FM; RATTLESNAKE VALLEY, MT; Owner: UNIVERSITY OF MONTANA)
KPLG (91.5 FM; PLAINS, MT; Owner: YOUR NETWORK OF PRAISE, INC.)
K214AD (90.7 FM; MISSOULA, ETC., MT; Owner: ROCKY MOUNTAIN BIBLE MISS.)
K224AA (92.7 FM; MISSOULA, MT; Owner: FISHER RADIO REGIONAL GROUP INC.)
K212DE (90.3 FM; BONNER/MISSOULA, MT; Owner: CALVARY CHAPEL OF TWIN FALLS, INC.)
K208EF (89.5 FM; MISSOULA, MT; Owner: HI-LINE RADIO FELLOWSHIP, INC.)
KBGA (89.9 FM; MISSOULA, MT; Owner: THE UNIVERSITY OF MONTANA)
KBAZ (96.3 FM; HAMILTON, MT; Owner: CAPSTAR TX LIMITED PARTNERSHIP)
KLTC-FM (107.5 FM; SUPERIOR, MT; Owner: CLEAR CHANNEL BROADCASTING LICENSES, INC.)
KQRK (92.3 FM; RONAN, MT; Owner: ANDERSON RADIO BROADCASTING, INC.)
KXDR (98.7 FM; HAMILTON, MT; Owner: FISHER RADIO REGIONAL GROUP, INC.)
KREO-FM1 (107.5 FM; MISSOULA, MT; Owner: CLEAR CHANNEL BROADCASTING LICENSES, INC.)
TV broadcast stations around Missoula:
KUFM-TV (Channel 11; MISSOULA, MT; Owner: THE UNIVERSITY OF MONTANA)
K42EO (Channel 42; MISSOULA, MT; Owner: TRINITY BROADCASTING NETWORK)
K05EE (Channel 5; BIG ARM, ETC., MT; Owner: BLACKTAIL TV TAX DISTRICT)
K50CP (Channel 50; MISSOULA, ETC., MT; Owner: DAVID A. TUCKER)
KTMF (Channel 23; MISSOULA, MT; Owner: MMM LICENSE LLC)
KPAX-TV (Channel 8; MISSOULA, MT; Owner: KPAX COMMUNICATIONS, INC.)
KECI-TV (Channel 13; MISSOULA, MT; Owner: EAGLE COMMUNICATIONS, INC.)
K32EU (Channel 32; MISSOULA, MT; Owner: SPOKANE SCHOOL DISTRICT #81)
K14IU (Channel 14; FRENCHTOWN, ETC., MT; Owner: EAGLE COMMUNICATIONS, INC.)
KMTM-LP (Channel 46; MISSOULA, MT; Owner: NORTH ROCKY MOUNTAIN TELEVISION, L.L.C.)
National Bridge Inventory (NBI) Statistics 63 Number of bridges981ft / 299m Total length $11,948,000 Total costs710,549 Total average daily traffic38,367 Total average daily truck traffic
New bridges - historical statistics
1 1930-1939 1 1940-1949 2 1950-1959 37 1960-1969 4 1970-1979 6 1980-1989 8 1990-1999 4 2000-2009
See full National Bridge Inventory statistics for Missoula, MT
Home Mortgage Disclosure Act Aggregated Statistics For Year 2009(Based on 6 full and 6 partial tracts) A) FHA, FSA/RHS & VA B) Conventional C) Refinancings D) Home Improvement Loans E) Loans on Dwellings For 5+ Families F) Non-occupant Loans on G) Loans On Manufactured Number Average Value Number Average Value Number Average Value Number Average Value Number Average Value Number Average Value Number Average Value
LOANS ORIGINATED 173 $188,240 278 $172,899 1,242 $180,398 95 $91,786 15 $418,981 191 $161,187 28 $70,889 APPLICATIONS APPROVED, NOT ACCEPTED 8 $192,155 17 $177,603 102 $189,653 3 $119,923 0 $0 9 $180,890 1 $23,720 APPLICATIONS DENIED 22 $178,565 31 $144,733 222 $196,945 22 $56,918 1 $350,000 34 $165,996 12 $55,680 APPLICATIONS WITHDRAWN 10 $179,878 42 $200,929 198 $189,616 9 $116,272 2 $653,000 42 $184,594 5 $144,600 FILES CLOSED FOR INCOMPLETENESS 1 $112,890 3 $158,017 43 $191,358 2 $49,900 0 $0 5 $129,792 1 $108,410
Aggregated Statistics For Year 2008(Based on 6 full and 6 partial tracts) A) FHA, FSA/RHS & VA B) Conventional C) Refinancings D) Home Improvement Loans E) Loans on Dwellings For 5+ Families F) Non-occupant Loans on G) Loans On Manufactured Number Average Value Number Average Value Number Average Value Number Average Value Number Average Value Number Average Value Number Average Value
LOANS ORIGINATED 93 $181,822 316 $178,350 591 $165,743 102 $83,608 16 $315,174 193 $172,398 21 $43,753 APPLICATIONS APPROVED, NOT ACCEPTED 4 $188,822 46 $183,446 68 $186,058 4 $67,050 0 $0 17 $202,406 9 $52,252 APPLICATIONS DENIED 14 $179,343 63 $138,980 176 $177,066 40 $68,070 2 $243,000 44 $144,021 26 $62,376 APPLICATIONS WITHDRAWN 17 $188,592 39 $180,529 166 $195,357 20 $89,500 0 $0 40 $175,444 2 $105,425 FILES CLOSED FOR INCOMPLETENESS 0 $0 8 $193,999 13 $153,093 7 $95,416 0 $0 2 $78,795 0 $0
Aggregated Statistics For Year 2007(Based on 6 full and 6 partial tracts) A) FHA, FSA/RHS & VA B) Conventional C) Refinancings D) Home Improvement Loans E) Loans on Dwellings For 5+ Families F) Non-occupant Loans on G) Loans On Manufactured Number Average Value Number Average Value Number Average Value Number Average Value Number Average Value Number Average Value Number Average Value
LOANS ORIGINATED 54 $171,343 572 $160,585 511 $149,455 134 $56,972 5 $459,932 231 $154,981 28 $80,805 APPLICATIONS APPROVED, NOT ACCEPTED 4 $137,960 50 $183,135 61 $165,530 12 $100,960 1 $539,930 17 $197,279 5 $56,032 APPLICATIONS DENIED 4 $174,488 148 $117,678 246 $167,192 44 $101,882 0 $0 72 $139,952 35 $47,001 APPLICATIONS WITHDRAWN 5 $168,952 49 $158,597 123 $167,300 19 $107,217 0 $0 29 $170,415 1 $1,000 FILES CLOSED FOR INCOMPLETENESS 0 $0 30 $143,871 36 $190,813 6 $89,540 0 $0 8 $159,582 1 $107,360
Aggregated Statistics For Year 2006(Based on 6 full and 6 partial tracts) A) FHA, FSA/RHS & VA B) Conventional C) Refinancings D) Home Improvement Loans E) Loans on Dwellings For 5+ Families F) Non-occupant Loans on G) Loans On Manufactured Number Average Value Number Average Value Number Average Value Number Average Value Number Average Value Number Average Value Number Average Value
LOANS ORIGINATED 50 $151,197 772 $140,604 543 $137,257 132 $59,204 8 $331,286 289 $139,543 37 $50,966 APPLICATIONS APPROVED, NOT ACCEPTED 3 $151,703 76 $129,948 68 $128,210 13 $63,887 0 $0 21 $128,411 10 $49,106 APPLICATIONS DENIED 6 $163,775 143 $117,421 193 $127,147 46 $55,842 0 $0 48 $133,849 14 $61,814 APPLICATIONS WITHDRAWN 5 $119,112 80 $149,790 129 $142,257 10 $63,500 2 $1,448,840 22 $136,940 5 $149,692 FILES CLOSED FOR INCOMPLETENESS 0 $0 38 $133,849 48 $168,166 3 $192,090 0 $0 13 $157,722 0 $0
Aggregated Statistics For Year 2005(Based on 6 full and 6 partial tracts) A) FHA, FSA/RHS & VA B) Conventional C) Refinancings D) Home Improvement Loans E) Loans on Dwellings For 5+ Families F) Non-occupant Loans on G) Loans On Manufactured Number Average Value Number Average Value Number Average Value Number Average Value Number Average Value Number Average Value Number Average Value
LOANS ORIGINATED 53 $143,875 740 $137,840 702 $140,396 130 $58,088 16 $396,695 309 $133,330 33 $46,186 APPLICATIONS APPROVED, NOT ACCEPTED 2 $106,515 76 $137,755 67 $132,128 13 $75,425 0 $0 31 $134,644 8 $44,402 APPLICATIONS DENIED 6 $124,298 125 $114,624 180 $134,675 37 $61,504 0 $0 42 $145,432 36 $54,865 APPLICATIONS WITHDRAWN 10 $138,730 81 $133,616 161 $152,006 21 $79,050 1 $450,000 35 $177,118 5 $70,144 FILES CLOSED FOR INCOMPLETENESS 0 $0 28 $157,454 49 $165,398 5 $85,154 0 $0 10 $180,930 1 $94,000
Aggregated Statistics For Year 2004(Based on 6 full and 6 partial tracts) A) FHA, FSA/RHS & VA B) Conventional C) Refinancings D) Home Improvement Loans E) Loans on Dwellings For 5+ Families F) Non-occupant Loans on G) Loans On Manufactured Number Average Value Number Average Value Number Average Value Number Average Value Number Average Value Number Average Value Number Average Value
LOANS ORIGINATED 59 $137,389 680 $140,653 830 $130,074 107 $56,148 24 $454,304 333 $138,592 23 $39,929 APPLICATIONS APPROVED, NOT ACCEPTED 4 $133,802 62 $141,619 94 $125,994 8 $82,780 0 $0 26 $170,746 12 $48,268 APPLICATIONS DENIED 5 $169,136 107 $117,125 251 $134,825 33 $44,981 1 $527,000 66 $156,891 35 $54,772 APPLICATIONS WITHDRAWN 14 $122,382 88 $138,530 183 $132,788 15 $73,909 0 $0 36 $141,636 3 $25,400 FILES CLOSED FOR INCOMPLETENESS 1 $125,260 40 $128,811 73 $148,564 4 $44,972 0 $0 15 $132,119 0 $0
Aggregated Statistics For Year 2003(Based on 6 full and 6 partial tracts) A) FHA, FSA/RHS & VA B) Conventional C) Refinancings D) Home Improvement Loans E) Loans on Dwellings For 5+ Families F) Non-occupant Loans on Number Average Value Number Average Value Number Average Value Number Average Value Number Average Value Number Average Value
LOANS ORIGINATED 74 $127,468 595 $129,855 1,925 $119,996 85 $21,319 17 $539,687 455 $126,246 APPLICATIONS APPROVED, NOT ACCEPTED 3 $164,180 49 $107,232 148 $124,642 9 $35,038 0 $0 33 $130,155 APPLICATIONS DENIED 9 $106,812 117 $101,179 304 $122,892 35 $30,891 1 $350,550 63 $140,083 APPLICATIONS WITHDRAWN 15 $116,193 44 $144,971 285 $120,786 6 $96,955 0 $0 51 $122,994 FILES CLOSED FOR INCOMPLETENESS 2 $133,795 23 $136,514 57 $128,375 1 $50,530 0 $0 15 $153,152
Aggregated Statistics For Year 2002(Based on 6 full and 6 partial tracts) A) FHA, FSA/RHS & VA B) Conventional C) Refinancings D) Home Improvement Loans E) Loans on Dwellings For 5+ Families F) Non-occupant Loans on Number Average Value Number Average Value Number Average Value Number Average Value Number Average Value Number Average Value
LOANS ORIGINATED 77 $112,731 512 $115,622 1,215 $108,853 105 $24,074 12 $351,546 292 $107,947 APPLICATIONS APPROVED, NOT ACCEPTED 4 $113,278 45 $112,193 81 $102,505 9 $22,104 0 $0 24 $91,011 APPLICATIONS DENIED 6 $103,752 83 $68,614 200 $97,437 17 $13,521 1 $2,190,960 23 $95,353 APPLICATIONS WITHDRAWN 12 $95,907 36 $124,761 198 $107,852 9 $67,606 0 $0 24 $117,225 FILES CLOSED FOR INCOMPLETENESS 1 $109,070 22 $114,596 64 $119,738 2 $17,245 0 $0 16 $114,148
Aggregated Statistics For Year 2001(Based on 6 full and 6 partial tracts) A) FHA, FSA/RHS & VA B) Conventional C) Refinancings D) Home Improvement Loans E) Loans on Dwellings For 5+ Families F) Non-occupant Loans on Number Average Value Number Average Value Number Average Value Number Average Value Number Average Value Number Average Value
LOANS ORIGINATED 89 $108,636 499 $102,292 856 $99,967 107 $16,808 6 $488,967 201 $98,384 APPLICATIONS APPROVED, NOT ACCEPTED 1 $113,000 49 $94,266 60 $86,680 8 $15,108 1 $725,000 10 $86,406 APPLICATIONS DENIED 9 $116,171 111 $66,150 200 $86,467 35 $14,782 2 $525,000 30 $110,327 APPLICATIONS WITHDRAWN 26 $91,993 32 $145,235 210 $98,787 15 $19,057 0 $0 18 $82,560 FILES CLOSED FOR INCOMPLETENESS 4 $104,495 13 $130,747 46 $114,471 3 $24,330 0 $0 12 $120,078
Aggregated Statistics For Year 2000(Based on 6 full and 6 partial tracts) A) FHA, FSA/RHS & VA B) Conventional C) Refinancings D) Home Improvement Loans E) Loans on Dwellings For 5+ Families F) Non-occupant Loans on Number Average Value Number Average Value Number Average Value Number Average Value Number Average Value Number Average Value
LOANS ORIGINATED 96 $97,188 416 $93,832 268 $74,577 164 $18,879 3 $215,877 126 $89,238 APPLICATIONS APPROVED, NOT ACCEPTED 5 $107,576 78 $74,886 49 $66,071 15 $16,798 0 $0 7 $183,543 APPLICATIONS DENIED 10 $119,778 161 $50,043 123 $70,317 44 $16,905 0 $0 23 $79,008 APPLICATIONS WITHDRAWN 10 $90,266 40 $99,643 57 $62,709 10 $19,331 1 $203,050 8 $94,835 FILES CLOSED FOR INCOMPLETENESS 2 $67,885 9 $108,776 29 $92,399 2 $36,930 0 $0 3 $69,030
Aggregated Statistics For Year 1999(Based on 6 full and 8 partial tracts) A) FHA, FSA/RHS & VA B) Conventional C) Refinancings D) Home Improvement Loans E) Loans on Dwellings For 5+ Families F) Non-occupant Loans on Number Average Value Number Average Value Number Average Value Number Average Value Number Average Value Number Average Value
LOANS ORIGINATED 109 $97,325 438 $96,254 565 $87,262 198 $20,412 13 $615,031 173 $94,288 APPLICATIONS APPROVED, NOT ACCEPTED 0 $0 21 $96,578 64 $76,352 17 $16,031 0 $0 5 $87,148 APPLICATIONS DENIED 6 $109,433 79 $69,250 158 $67,843 43 $15,415 0 $0 18 $77,651 APPLICATIONS WITHDRAWN 12 $99,149 48 $100,578 107 $87,603 18 $49,961 0 $0 24 $85,417 FILES CLOSED FOR INCOMPLETENESS 0 $0 8 $134,676 25 $94,400 0 $0 0 $0 10 $87,223
Detailed mortgage data for all 10 tracts in Missoula, MT
Private Mortgage Insurance Companies Aggregated Statistics For Year 2009(Based on 6 full and 6 partial tracts) A) Conventional B) Refinancings C) Non-occupant Loans on Number Average Value Number Average Value Number Average Value
LOANS ORIGINATED 48 $189,923 37 $205,463 6 $203,987 APPLICATIONS APPROVED, NOT ACCEPTED 5 $136,260 9 $197,966 0 $0 APPLICATIONS DENIED 8 $155,635 8 $184,325 0 $0 APPLICATIONS WITHDRAWN 2 $216,420 5 $198,096 0 $0 FILES CLOSED FOR INCOMPLETENESS 4 $174,182 0 $0 2 $158,590
Aggregated Statistics For Year 2008(Based on 6 full and 6 partial tracts) A) Conventional B) Refinancings C) Non-occupant Loans on D) Loans On Manufactured Number Average Value Number Average Value Number Average Value Number Average Value
LOANS ORIGINATED 99 $187,903 55 $220,647 18 $206,891 1 $170,000 APPLICATIONS APPROVED, NOT ACCEPTED 32 $200,383 13 $286,796 8 $200,991 0 $0 APPLICATIONS DENIED 10 $157,028 1 $308,000 1 $218,710 0 $0 APPLICATIONS WITHDRAWN 0 $0 0 $0 0 $0 0 $0 FILES CLOSED FOR INCOMPLETENESS 4 $157,680 1 $399,090 1 $165,720 0 $0
Aggregated Statistics For Year 2007(Based on 6 full and 6 partial tracts) A) Conventional B) Refinancings C) Non-occupant Loans on D) Loans On Manufactured Number Average Value Number Average Value Number Average Value Number Average Value
LOANS ORIGINATED 157 $190,680 34 $205,840 28 $207,845 1 $158,000 APPLICATIONS APPROVED, NOT ACCEPTED 18 $177,151 9 $215,498 4 $201,270 0 $0 APPLICATIONS DENIED 1 $251,270 1 $403,580 0 $0 0 $0 APPLICATIONS WITHDRAWN 8 $201,478 4 $179,190 2 $128,730 0 $0 FILES CLOSED FOR INCOMPLETENESS 1 $276,120 0 $0 0 $0 0 $0
Aggregated Statistics For Year 2006(Based on 6 full and 6 partial tracts) A) Conventional B) Refinancings C) Non-occupant Loans on Number Average Value Number Average Value Number Average Value
LOANS ORIGINATED 108 $168,348 18 $211,131 17 $172,097 APPLICATIONS APPROVED, NOT ACCEPTED 21 $178,255 8 $154,936 12 $164,860 APPLICATIONS DENIED 0 $0 0 $0 0 $0 APPLICATIONS WITHDRAWN 4 $213,592 1 $177,000 0 $0 FILES CLOSED FOR INCOMPLETENESS 0 $0 0 $0 0 $0
Aggregated Statistics For Year 2005(Based on 6 full and 6 partial tracts) A) Conventional B) Refinancings C) Non-occupant Loans on Number Average Value Number Average Value Number Average Value
LOANS ORIGINATED 106 $167,050 40 $175,855 20 $161,748 APPLICATIONS APPROVED, NOT ACCEPTED 14 $156,283 14 $180,985 4 $139,262 APPLICATIONS DENIED 2 $208,000 0 $0 1 $252,000 APPLICATIONS WITHDRAWN 6 $151,137 2 $165,525 2 $198,850 FILES CLOSED FOR INCOMPLETENESS 2 $121,100 0 $0 0 $0
Aggregated Statistics For Year 2004(Based on 6 full and 6 partial tracts) A) Conventional B) Refinancings C) Non-occupant Loans on Number Average Value Number Average Value Number Average Value
LOANS ORIGINATED 120 $163,564 39 $168,940 29 $165,577 APPLICATIONS APPROVED, NOT ACCEPTED 30 $161,968 19 $148,348 10 $155,659 APPLICATIONS DENIED 0 $0 0 $0 0 $0 APPLICATIONS WITHDRAWN 2 $182,780 7 $125,839 2 $173,500 FILES CLOSED FOR INCOMPLETENESS 1 $130,280 0 $0 1 $72,000
Aggregated Statistics For Year 2003(Based on 6 full and 6 partial tracts) A) Conventional B) Refinancings C) Non-occupant Loans on Number Average Value Number Average Value Number Average Value
LOANS ORIGINATED 153 $151,904 89 $143,437 30 $148,780 APPLICATIONS APPROVED, NOT ACCEPTED 45 $138,586 31 $137,235 29 $125,687 APPLICATIONS DENIED 1 $144,000 1 $207,000 0 $0 APPLICATIONS WITHDRAWN 8 $136,616 13 $129,942 11 $112,702 FILES CLOSED FOR INCOMPLETENESS 0 $0 0 $0 0 $0
Aggregated Statistics For Year 2002(Based on 5 full and 6 partial tracts) A) Conventional B) Refinancings C) Non-occupant Loans on Number Average Value Number Average Value Number Average Value
LOANS ORIGINATED 155 $125,182 93 $132,511 32 $106,493 APPLICATIONS APPROVED, NOT ACCEPTED 27 $131,026 24 $118,846 9 $121,200 APPLICATIONS DENIED 3 $88,133 0 $0 0 $0 APPLICATIONS WITHDRAWN 9 $100,734 5 $145,178 3 $113,520 FILES CLOSED FOR INCOMPLETENESS 0 $0 1 $82,650 1 $82,650
Aggregated Statistics For Year 2001(Based on 6 full and 6 partial tracts) A) Conventional B) Refinancings C) Non-occupant Loans on Number Average Value Number Average Value Number Average Value
LOANS ORIGINATED 147 $124,318 81 $131,509 25 $113,794 APPLICATIONS APPROVED, NOT ACCEPTED 19 $120,429 20 $141,668 6 $130,102 APPLICATIONS DENIED 3 $130,873 6 $98,737 1 $82,650 APPLICATIONS WITHDRAWN 1 $199,740 2 $150,960 1 $109,920 FILES CLOSED FOR INCOMPLETENESS 1 $140,220 0 $0 0 $0
Aggregated Statistics For Year 2000(Based on 5 full and 6 partial tracts) A) Conventional B) Refinancings C) Non-occupant Loans on Number Average Value Number Average Value Number Average Value
LOANS ORIGINATED 118 $113,059 18 $112,517 9 $108,449 APPLICATIONS APPROVED, NOT ACCEPTED 16 $113,095 7 $121,746 0 $0 APPLICATIONS DENIED 5 $127,078 3 $110,933 0 $0 APPLICATIONS WITHDRAWN 2 $121,690 0 $0 1 $60,160 FILES CLOSED FOR INCOMPLETENESS 0 $0 1 $108,000 0 $0
Aggregated Statistics For Year 1999(Based on 6 full and 7 partial tracts) A) Conventional B) Refinancings C) Non-occupant Loans on Number Average Value Number Average Value Number Average Value
LOANS ORIGINATED 131 $109,240 34 $120,201 17 $95,139 APPLICATIONS APPROVED, NOT ACCEPTED 8 $91,724 7 $112,883 1 $120,550 APPLICATIONS DENIED 6 $125,717 1 $141,670 2 $84,000 APPLICATIONS WITHDRAWN 6 $105,943 0 $0 3 $87,407 FILES CLOSED FOR INCOMPLETENESS 0 $0 0 $0 0 $0
Fire-safe hotels and motels in Missoula, Montana:
Brownies Plus Motel, 1540 W Broadway, Missoula, Montana 59802 Phone: (406) 549-2937
Days Inn Missoula - Airport, 8600 Truck Stop Rd, Missoula, Montana 59808 Phone: (406) 721-9776, Fax: (406) 721-9781
GuestHouse Inn & Suites - Missoula, 3803 BRKS, Missoula, Montana 59801 Phone: (800) 272-9500
Best Inn North, 4953 N Reserve, Missoula, Montana 59808 Phone: (406) 542-7550, Fax: (406) 721-5931
Holiday Inn-missoula Parkside, 200 S Pattee St, Missoula, Montana 59802 Phone: (406) 721-8550, Fax: (406) 721-7427
Doubletree Hotel Missoula Edgewater, 100 Madison St, Missoula, Montana 59802 Phone: (406) 728-3100, Fax: (406) 728-2530
Red Lion Inn Missoula, 700 W Broadway, Missoula, Montana 59802 Phone: (406) 728-3300, Fax: (406) 728-4441
Ruby's Inn & Conference Center, 4825 N Reserve, Missoula, Montana 59802 Phone: (406) 721-0990, Fax: (406) 721-0990
15 other hotels and motels
All 23 fire-safe hotels and motels in Missoula, Montana
Most common first names in Missoula, MT among deceased individuals Name Count Lived (average)
John 411 75.4 years William 324 75.1 years Robert 306 71.2 years Mary 302 80.1 years James 228 72.2 years George 221 78.3 years Helen 192 81.5 years Margaret 164 81.7 years Dorothy 154 79.6 years Charles 153 76.3 years
Most common last names in Missoula, MT among deceased individuals Last name Count Lived (average)
Johnson 177 77.0 years Smith 137 74.8 years Anderson 113 76.9 years Miller 77 76.2 years Nelson 75 76.1 years Brown 72 76.2 years Peterson 60 79.9 years Davis 58 75.1 years Olson 58 78.4 years Jones 54 77.1 years
Missoula compared to Montana state average:
Unemployed percentage below state average. Median age below state average. Foreign-born population percentage above state average. Renting percentage above state average. Number of rooms per house below state average. Number of college students above state average. Percentage of population with a bachelor's degree or higher above state average.
#4 on the list of "Top 101 cities with largest percentage of females in occupations: fire fighting and prevention workers including supervisors (population 50,000+)"
#5 on the list of "Top 100 cities with shortest commuting times (pop. 50,000+)"
#6 on the list of "Top 101 cities with largest percentage of females in industries: information (population 50,000+)"
#6 on the list of "Top 101 cities with the largest sunshine amount differences during a year (population 50,000+)"
#9 on the list of "Top 101 cities with largest percentage of males in occupations: sales and related occupations (population 50,000+)"
#11 on the list of "Top 101 cities with the highest ratio of rapes to murders between 2002 and 2012 (population 50,000+)"
#14 on the list of "Top 101 cities with largest percentage of females in occupations: arts, design, entertainment, sports, and media occupations (population 50,000+)"
#16 on the list of "Top 101 cities with the largest city-data.com crime index increase from 2011 to 2012 (population 50,000+)"
#18 on the list of "Top 101 cities with largest percentage of females in industries: agriculture, forestry, fishing and hunting (population 50,000+)"
#24 on the list of "Top 101 cities with the lowest average temperatures (population 50,000+)"
#28 on the list of "Top 101 cities with the lowest cost per building permit (population 50,000+)"
#29 on the list of "Top 101 cities with largest percentage of males in industries: agriculture, forestry, fishing and hunting (population 50,000+)"
#32 on the list of "Top 101 cities with largest percentage of females in industries: mining, quarrying, and oil and gas extraction (population 50,000+)"
#36 on the list of "Top 101 cities with largest percentage of males in occupations: personal care and service occupations (population 50,000+)"
#39 on the list of "Top 100 least racially diverse cities (pop. 50,000+)"
#41 on the list of "Top 101 cities with the most people taking a bicycle to work (population 5,000+)"
#42 on the list of "Top 101 cities with largest percentage of males in occupations: life, physical, and social science occupations (population 50,000+)"
#44 on the list of "Top 101 larger cities with the highest increase in household income from 2000 (population 50,000+)"
#45 on the list of "Top 101 cities with the highest percentage of English-only speaking households, population 50,000+"
#47 on the list of "Top 100 cities with highest percentage of college students (pop. 50,000+)"
#9 on the list of "Top 101 counties with the lowest average weight of females"
#34 on the list of "Top 101 counties with the lowest Ozone (1-hour) air pollution readings in 2012 (ppm)"
#37 on the list of "Top 101 counties with the highest percentage of residents that exercised in the past month"
#41 on the list of "Top 101 counties with highest percentage of residents voting for 3rd party candidates in the 2012 Presidential Election (pop. 50,000+)"
#52 on the list of "Top 101 counties with the highest percentage of residents that drank alcohol in the past 30 days"
Top Patent Applicants
Tyler N. Smith (10)
Donald E. Kiely (9)
Yuval Charles Avniel (9)
Bruce Hazeltine (9)
David Douglas Dieziger (8)
Philippe Diaz (7)
David Samsel (7)
Kylie Kramer-Presta (6)
Eric W. Reimers (6)
Tyler Smith (5)
Total of 265 patent applications in 2008-2024.

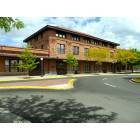
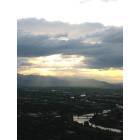
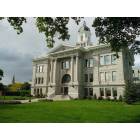
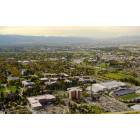
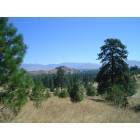
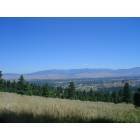

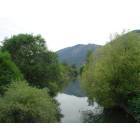
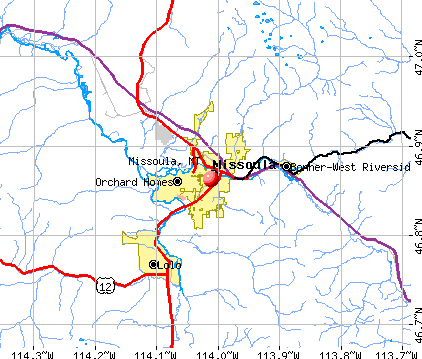


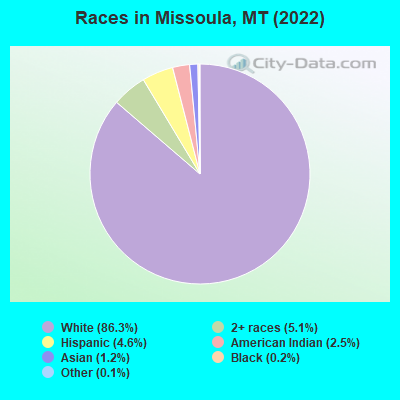
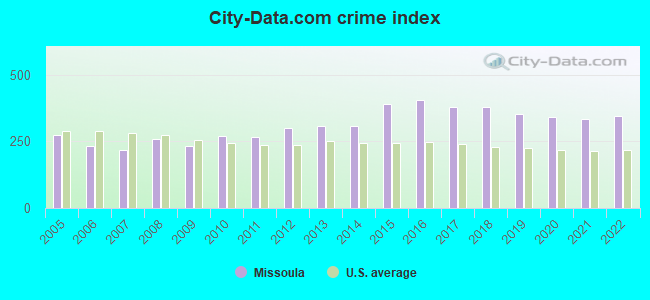
 Recent articles from our blog. Our writers, many of them Ph.D. graduates or candidates, create easy-to-read articles on a wide variety of topics.

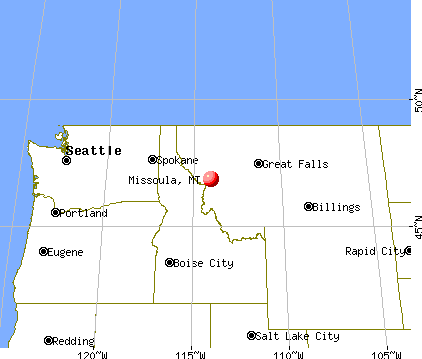
 , pop. 480,100).
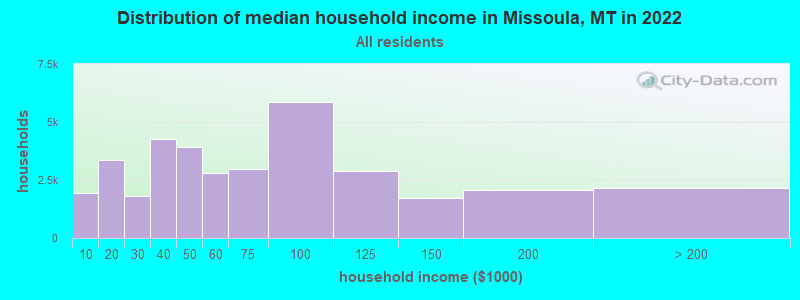
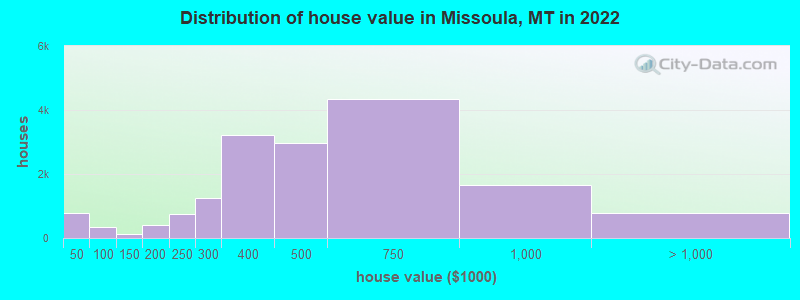

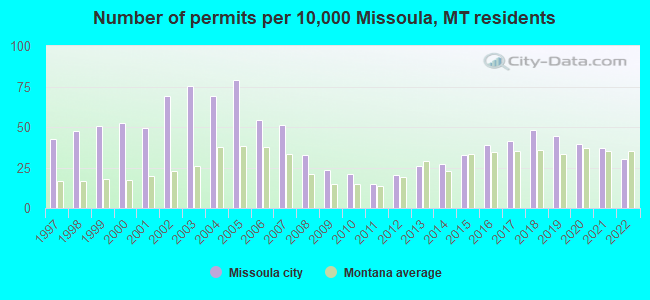
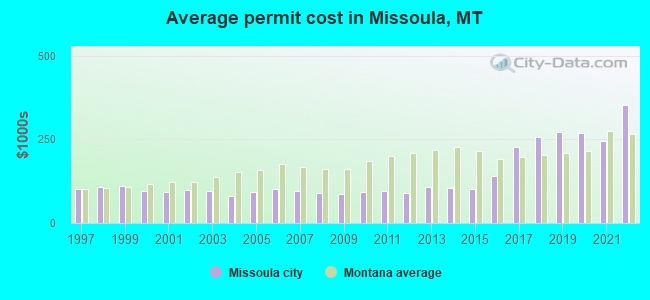
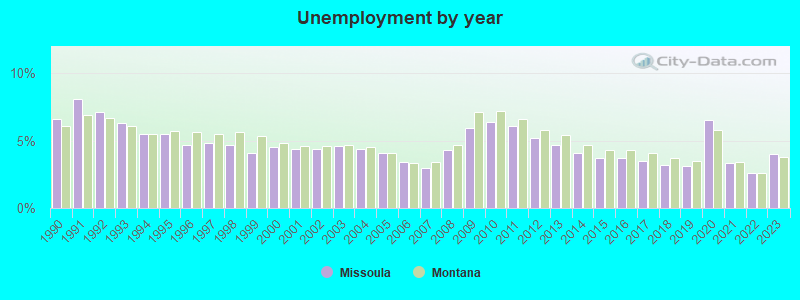
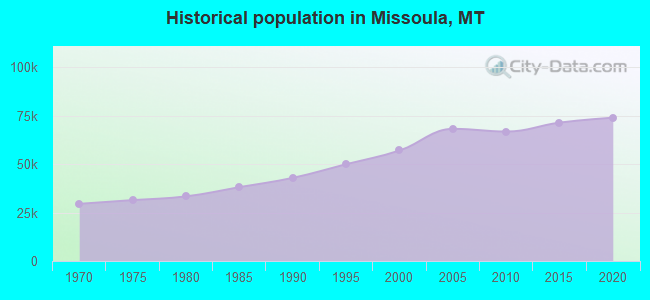
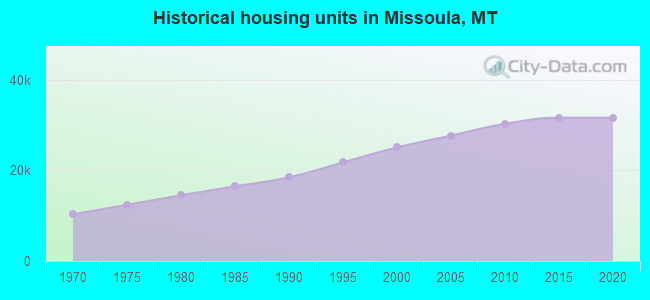
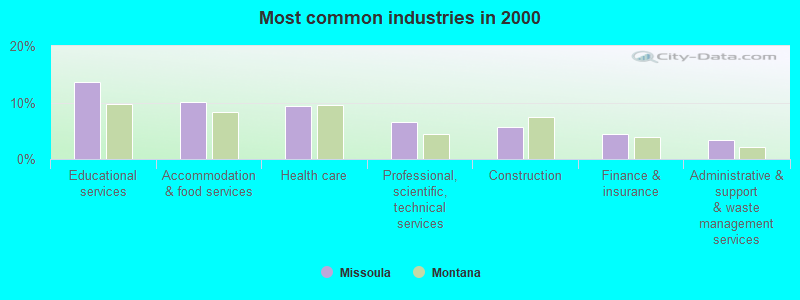
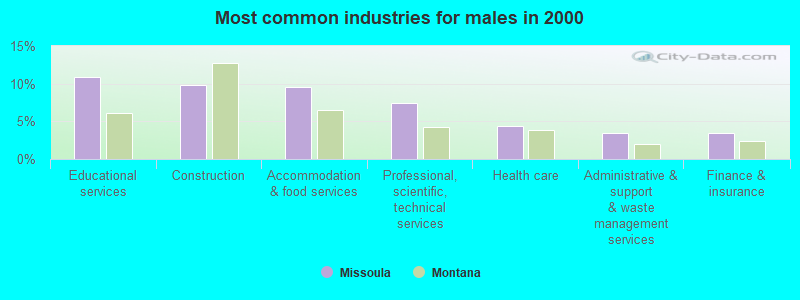
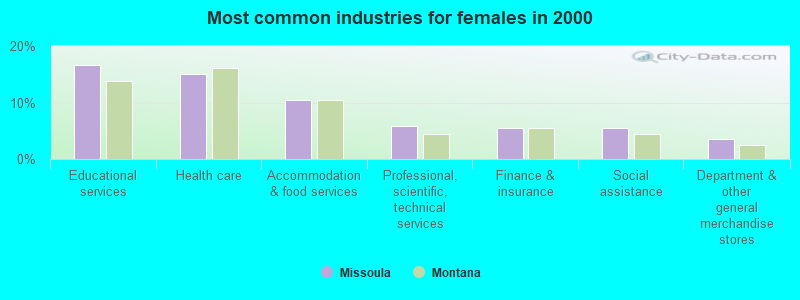
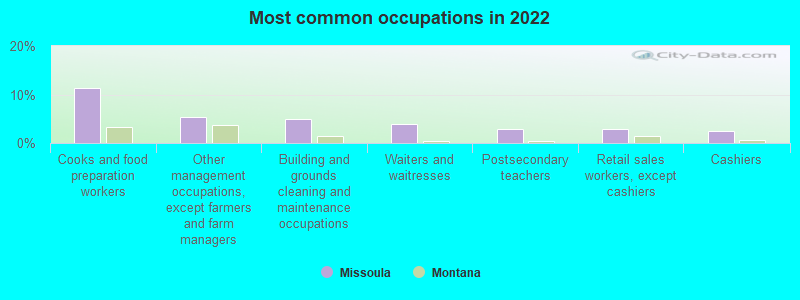
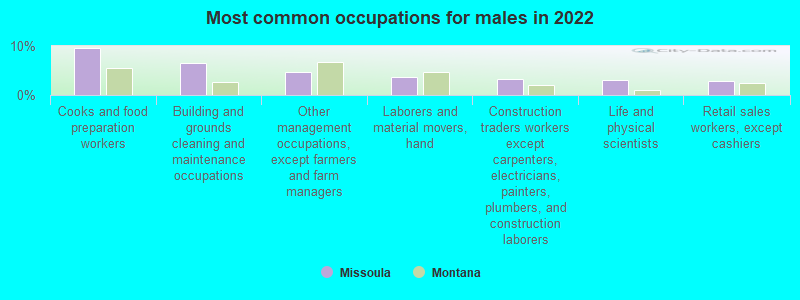
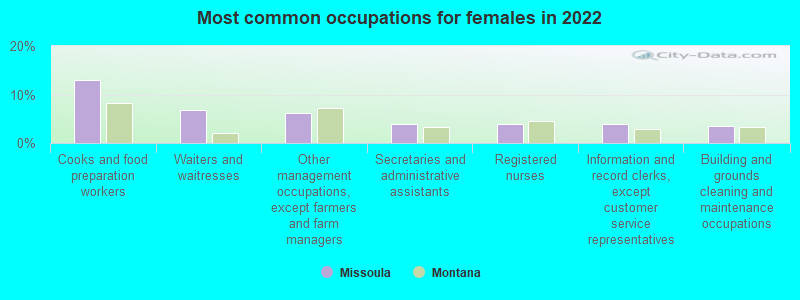

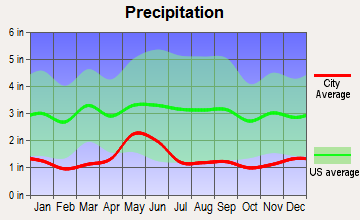
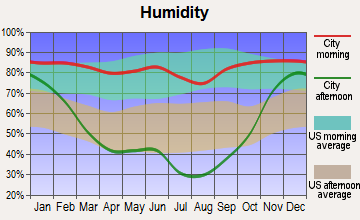
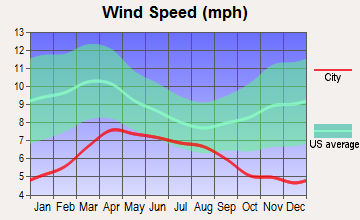
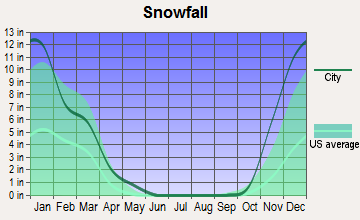
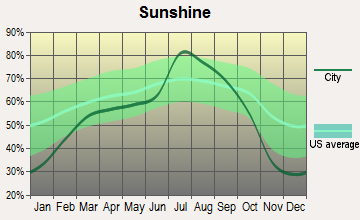
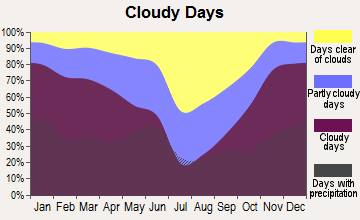
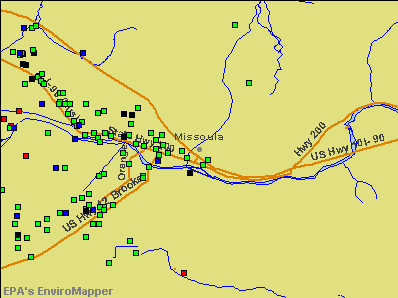

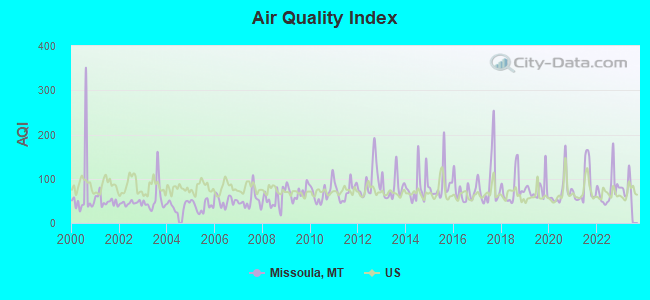
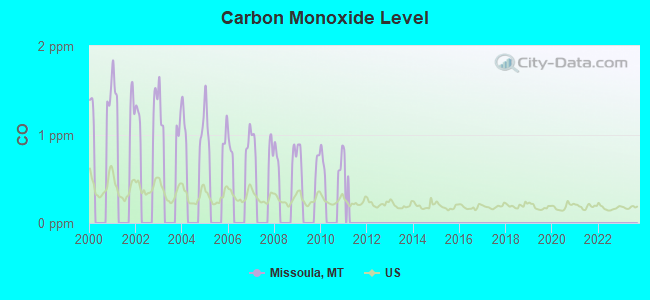
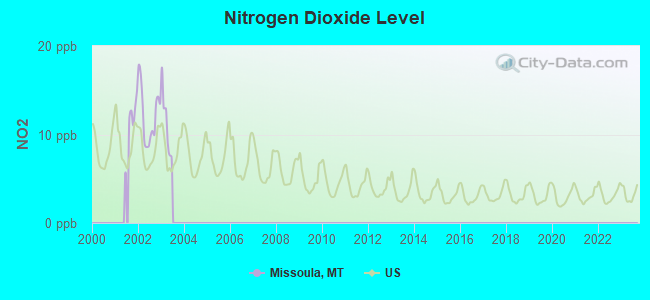
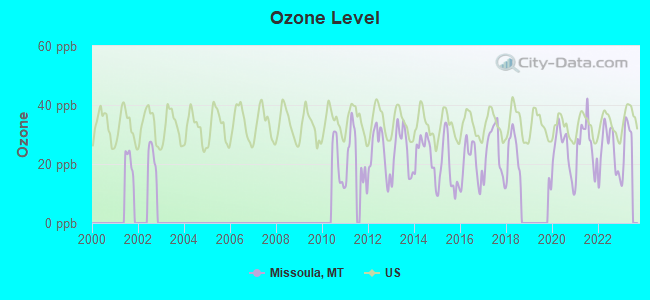
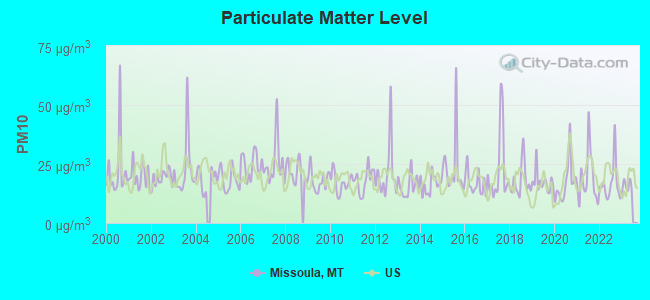
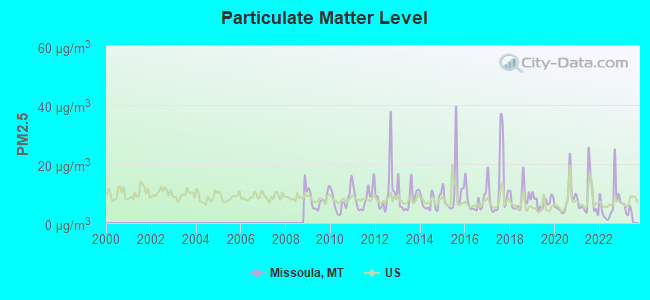
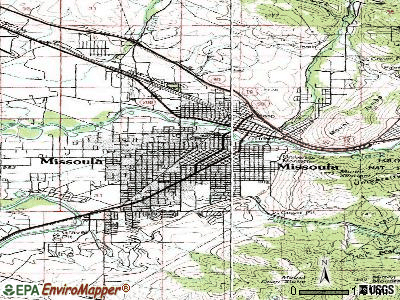
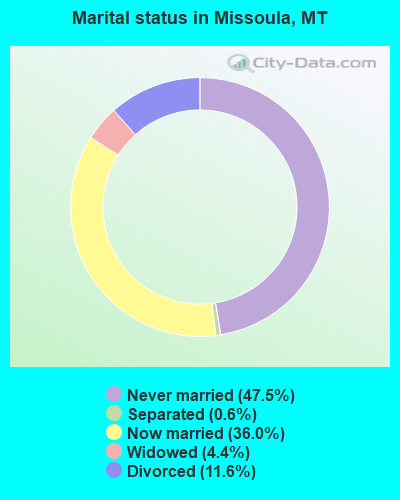
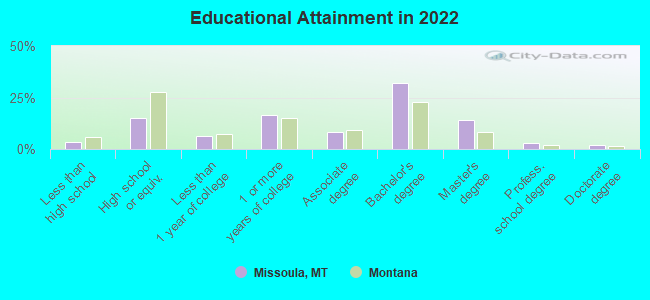
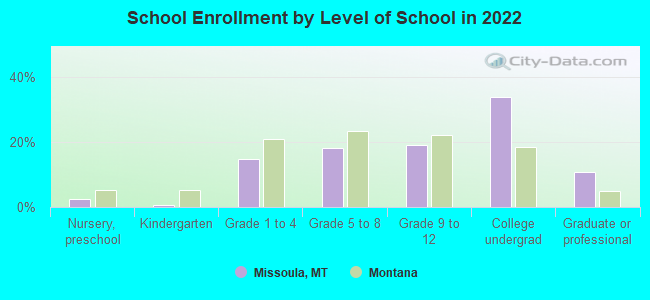
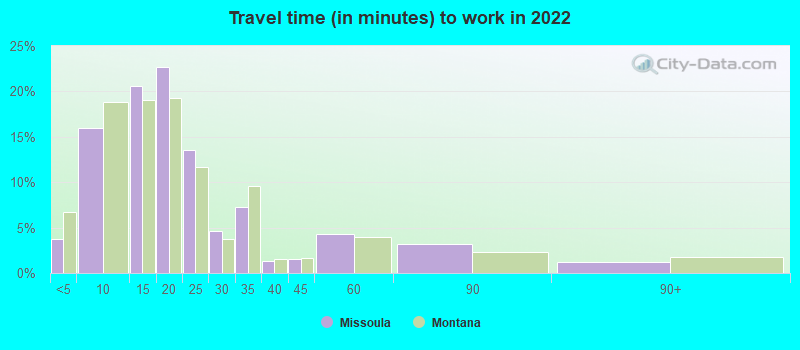
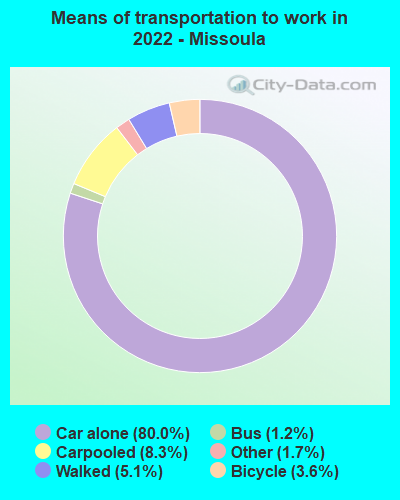
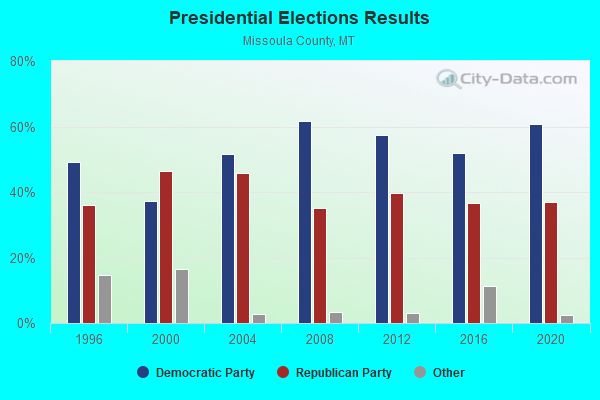
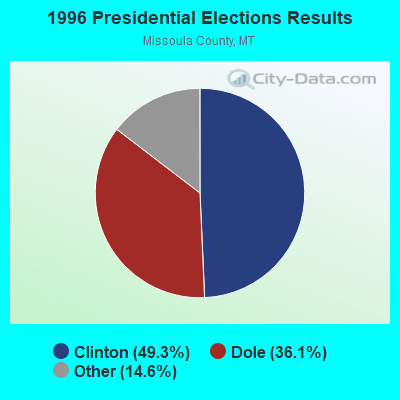
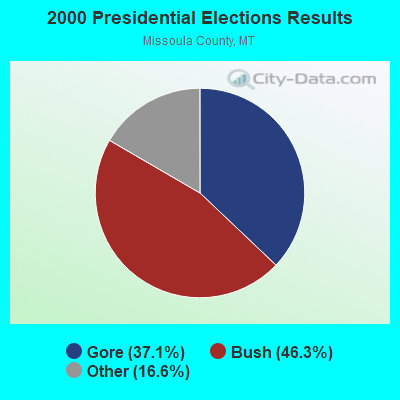
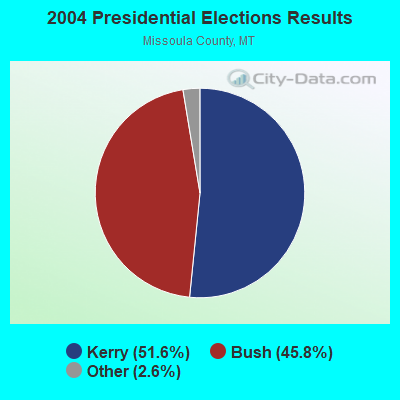
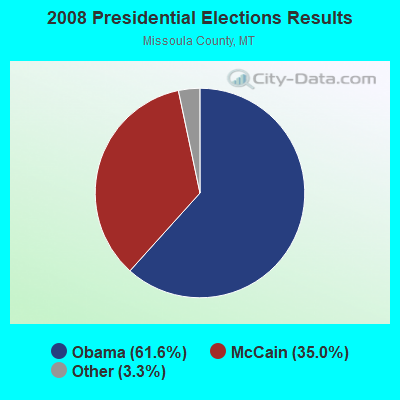
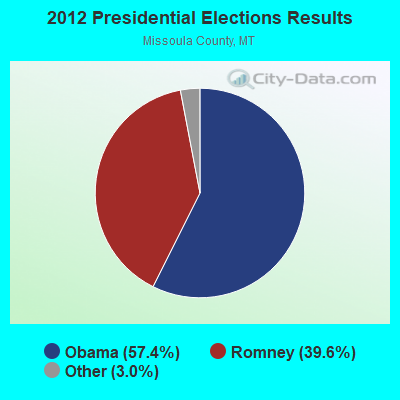
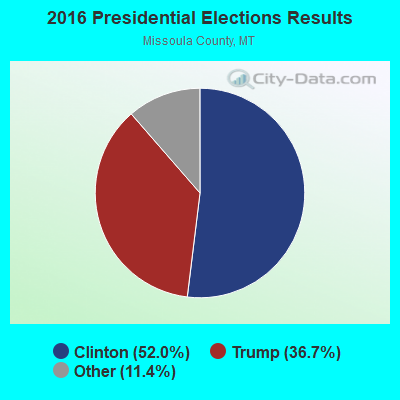
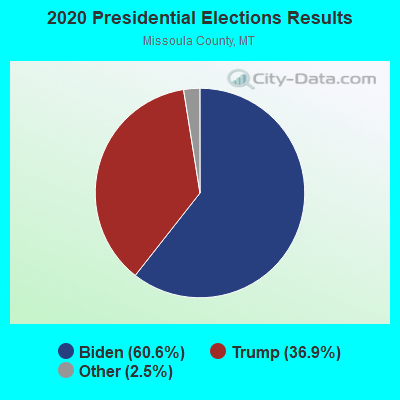
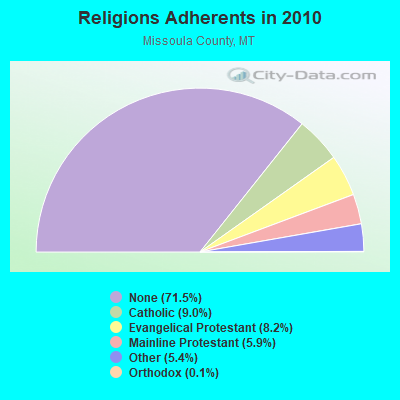
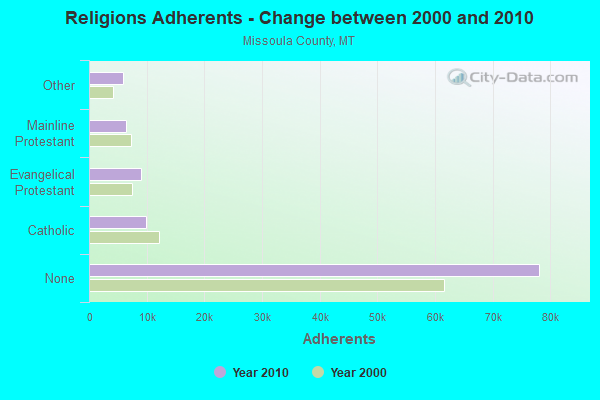
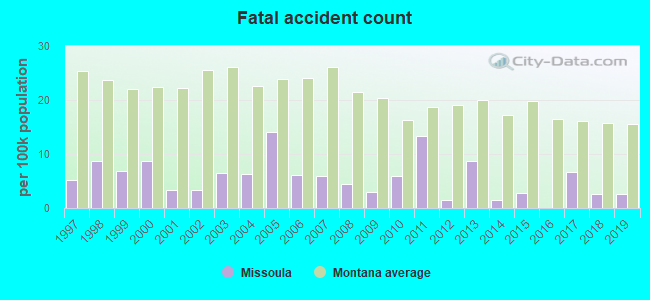
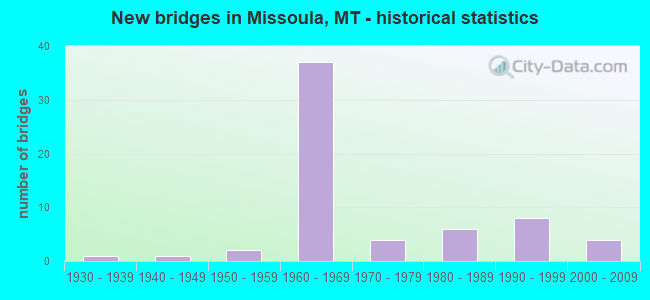
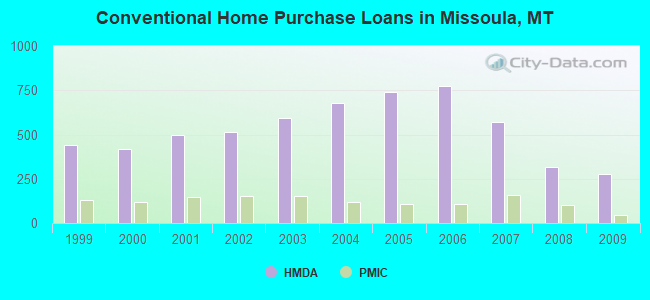
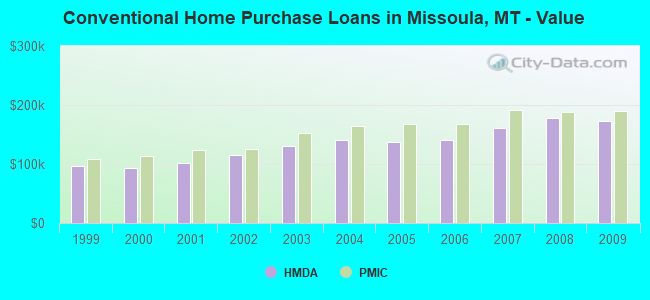
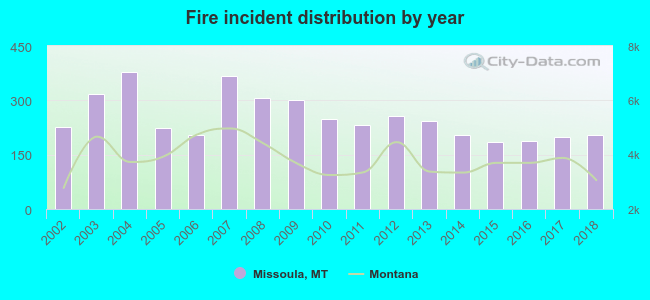 Based on the data from the years 2002 - 2018 the average number of fires per year is 252. The highest number of reported fires - 377 took place in 2004, and the least - 186 in 2015. The data has a decreasing trend.
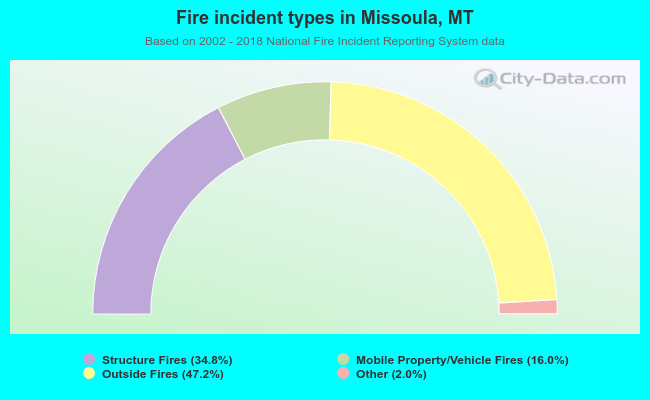 When looking into fire subcategories, the most incidents belonged to: Outside Fires (47.2%), and Structure Fires (34.8%).