Estimated zip code population in 2022: 538 Zip code population in 2010: 482 Zip code population in 2000: 354
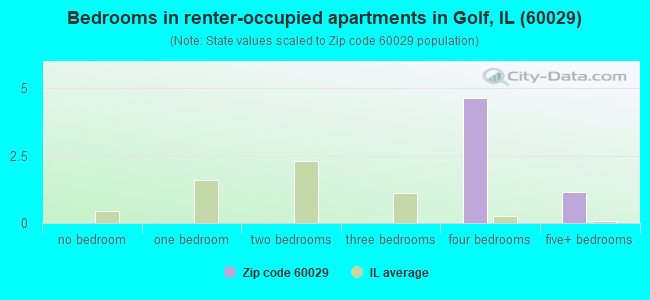
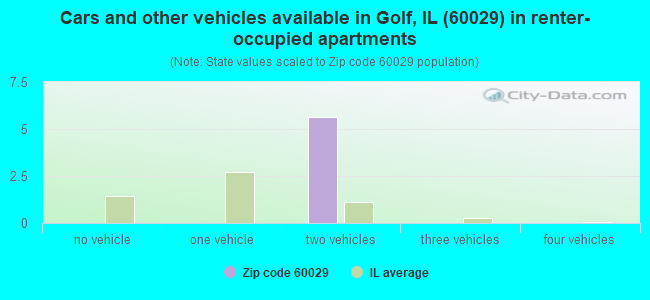
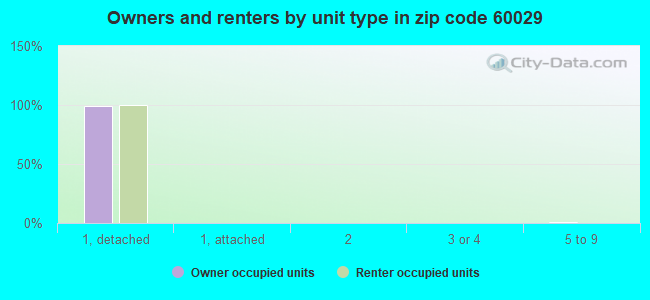
Houses and condos: 198 Renter-occupied apartments: 6
% of renters here:
3%
State:
33%
March 2022 cost of living index in zip code 60029: 98.3 (near average, U.S. average is 100)
Land area: 0.8 sq. mi. Water area: 0.0 sq. mi.
Population density: 644 people per square mile
(low).
OSM Map
General Map
Google Map
MSN Map
OSM Map
General Map
Google Map
MSN Map
OSM Map
General Map
Google Map
MSN Map
OSM Map
General Map
Google Map
MSN Map
Please wait while loading the map...
Real estate property taxes paid for housing units in 2022:
This zip code:
1.0% ($9,718)
Illinois:
2.0% ($4,912)
Median real estate property taxes paid for housing units with mortgages in 2022: $9,569 (0.7%) Median real estate property taxes paid for housing units with no mortgage in 2022: $9,944 (1.1%)
Business Search- 14 Million verified businesses
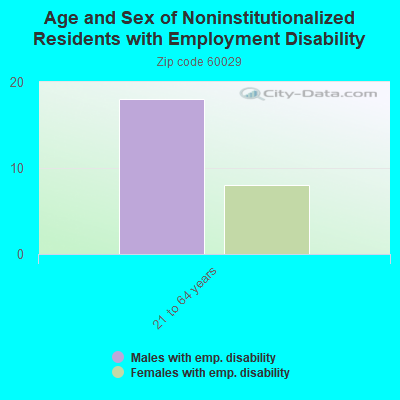
Males: 287
(53.3%)
Females: 251
(46.7%)
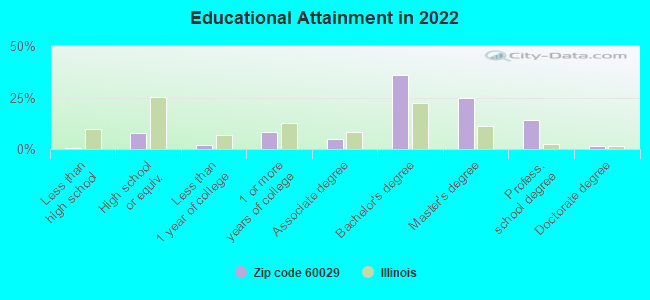
For population 25 years and over in 60029:
High school or higher: 99.7%
Bachelor's degree or higher: 75.6%
Graduate or professional degree: 39.9%
Unemployed: 5.1%
Mean travel time to work (commute): 31.9 minutes
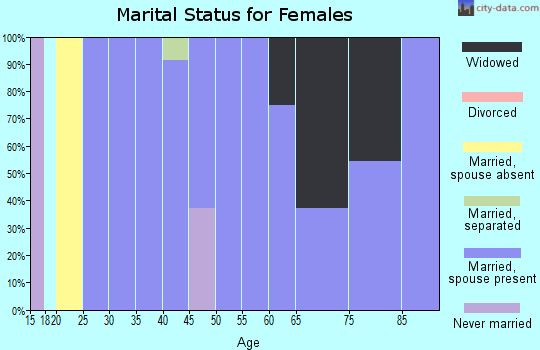
For population 15 years and over in 60029:
Never married: 23.0%
Now married: 71.6%
Separated: 0.0%
Widowed: 3.8%
Divorced: 1.7%
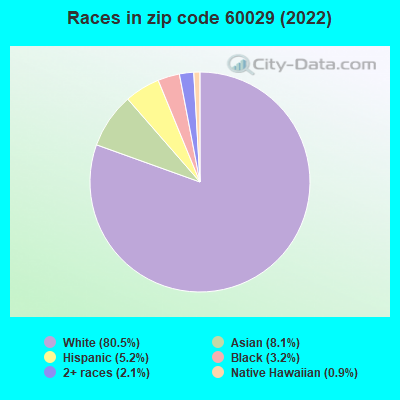
Zip code 60029 compared to state average:
Median household income significantly above state average.
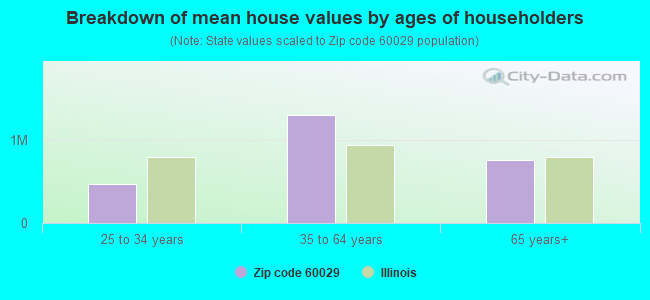
Median house value significantly above state average.
Black race population percentage significantly below state average.
Hispanic race population percentage significantly below state average.
Median age significantly above state average.
Renting percentage significantly below state average.
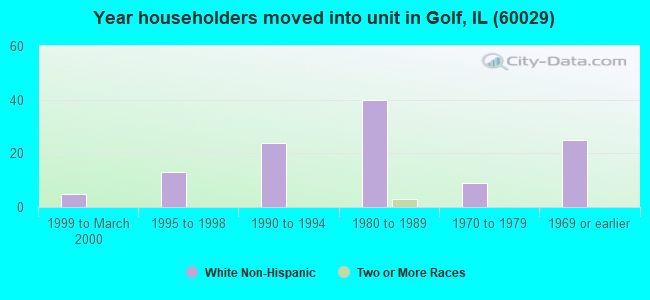
Length of stay since moving in above state average.
Number of rooms per house significantly above state average.
Percentage of population with a bachelor's degree or higher above state average.
Estimated median house/condo value in 2022: $994,299
60029:
$994,299
Illinois:
$251,600
Median resident age:
This zip code:
50.6 years
Illinois median age:
39.1 years
Average household size:
This zip code:
2.6 people
Illinois:
2.4 people
Averages for the 2004 tax year for zip code 60029, filed in 2005:
Average Adjusted Gross Income (AGI) in 2004: $176,655 (Individual Income Tax Returns)
Here:
$176,655
State:
$54,625
Salary/wage: $113,989 (reported on 67.0% of returns)
Here:
$113,989
State:
$46,811
(% of AGI for various income ranges: 97.1% for AGIs below $10k, 48.2% for AGIs $10k-25k, 44.1% for AGIs $25k-50k, 43.9% for AGIs $50k-75k, 47.2% for AGIs $75k-100k, 43.0% for AGIs over 100k)
Taxable interest for individuals: $6,005 (reported on 77.7% of returns)
This zip code:
$6,005
Illinois:
$2,101
(% of AGI for various income ranges: 10.3% for AGIs below $10k, 17.5% for AGIs $10k-25k, 1.8% for AGIs $25k-50k, 4.5% for AGIs $50k-75k, 7.7% for AGIs $75k-100k, 2.3% for AGIs over 100k)
Taxable dividends: $17,665 (reported on 70.1% of returns)
Here:
$17,665
State:
$4,306
(% of AGI for various income ranges: 47.1% for AGIs below $10k, 5.8% for AGIs $10k-25k, 11.9% for AGIs $25k-50k, 5.8% for AGIs $50k-75k, 8.0% for AGIs $75k-100k, 6.8% for AGIs over 100k)
Net capital gain/loss: +$63,093 (reported on 65.2% of returns)
Here:
+$63,093
State:
+$17,321
(% of AGI for various income ranges: -67.6% for AGIs below $10k, -1.6% for AGIs $10k-25k, 18.4% for AGIs $25k-50k, -1.1% for AGIs $50k-75k, 2.4% for AGIs $75k-100k, 25.3% for AGIs over 100k)
Profit/loss from business: +$18,085 (reported on 17.8% of returns)
Here:
+$18,085
State:
+$11,771
IRA payment deduction: $3,818 (reported on 4.2% of returns)
60029:
$3,818
Illinois:
$3,087
Self-employed pension: $28,000 (reported on 6.4% of returns)
Here:
$28,000
Illinois:
$16,965
Total itemized deductions: $42,302 (17% of AGI, reported on 67.8% of returns)
Here:
$42,302
State:
$20,239
Here:
16.8% of AGI
State:
19.5% of AGI
(% of AGI for various income ranges: 272.1% for AGIs below $10k, 37.7% for AGIs $25k-50k, 28.8% for AGIs $50k-75k, 27.5% for AGIs $75k-100k, 14.7% for AGIs over 100k)
Charity contributions deductions: $7,553 (3% of AGI, reported on 61.0% of returns)
Here:
$7,553
State:
$3,719
Here:
3.0% of AGI
State:
3.4% of AGI
(% of AGI for various income ranges: 6.3% for AGIs $10k-25k, 3.7% for AGIs $50k-75k, 3.8% for AGIs $75k-100k, 2.6% for AGIs over 100k)
Total tax: $44,510 (reported on 78.0% of returns)
60029:
$44,510
State:
$9,882
(% of AGI for various income ranges: 2.9% for AGIs below $10k, 5.0% for AGIs $10k-25k, 8.0% for AGIs $25k-50k, 9.6% for AGIs $50k-75k, 9.5% for AGIs $75k-100k, 20.8% for AGIs over 100k)
Percentage of individuals using paid preparers for their 2004 taxes: 70.1%
Here:
70%
State:
61%
(% for various income ranges: 61.8% for AGIs below $10k, 64.0% for AGIs $10k-25k, 76.0% for AGIs $25k-50k, 61.9% for AGIs $50k-75k, 82.4% for AGIs $75k-100k, 73.6% for AGIs over 100k)
Household received Food Stamps/SNAP in the past 12 months: 0 Household did not receive Food Stamps/SNAP in the past 12 months: 193
Women who had a birth in the past 12 months: 6 (6 now married, 0 unmarried) Women who did not have a birth in the past 12 months: 68 (38 now married, 29 unmarried)
Housing units in zip code 60029 with a mortgage: 103 (14 second mortgage, 14 both second mortgage and home equity loan) Median monthly owner costs for units with a mortgage: $3,792 Median monthly owner costs for units without a mortgage: $1,519
Residents with income below the poverty level in 2022:
This zip code:
3.9%
Whole state:
11.9%
Residents with income below 50% of the poverty level in 2022:
This zip code:
0.9%
Whole state:
5.7%
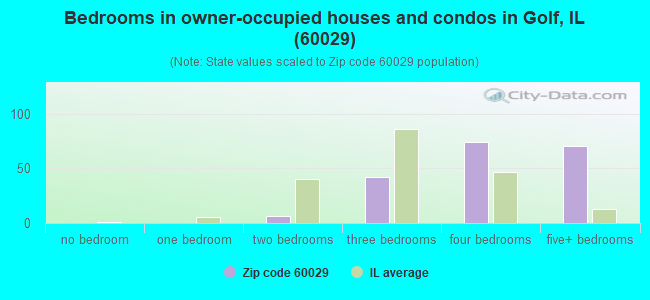
Median number of rooms in houses and condos:
Here:
10.0
State:
6.4
Notable locations in this zip code not listed on our city pages
In group quarters: 24 (-1 institutionalized population)
Size of family households: 88 2-persons, 16 3-persons, 34 4-persons, 15 5-persons, 3 6-persons, 2 7-or-more-persons
Size of nonfamily households: 35 1-person
118 married couples with children.
4 single-parent households (4 women).
83.0% of residents of 60029 zip code speak English at home.
4.9% of residents speak Spanish at home (15% very well, 38% well, 23% not well, 23% not at all).
7.4% of residents speak other Indo-European language at home (87% very well, 5% well, 8% not well).
2.3% of residents speak Asian or Pacific Island language at home (75% very well, 17% well, 8% not well).
1.7% of residents speak other language at home (100% very well).
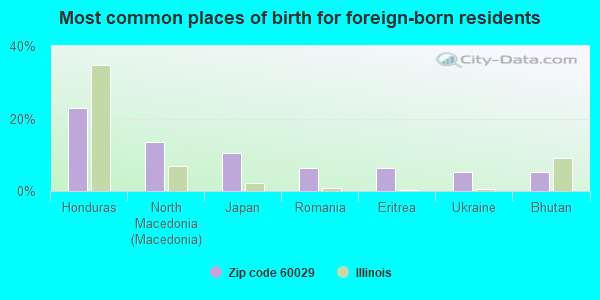
Foreign born population: 96 (17.9%) (56.5% of them are naturalized citizens)
This zip code:
17.9%
Whole state:
14.4%
23%Honduras
14%North Macedonia (Macedonia)
10%Japan
6%Romania
6%Eritrea
5%Ukraine
5%Bhutan
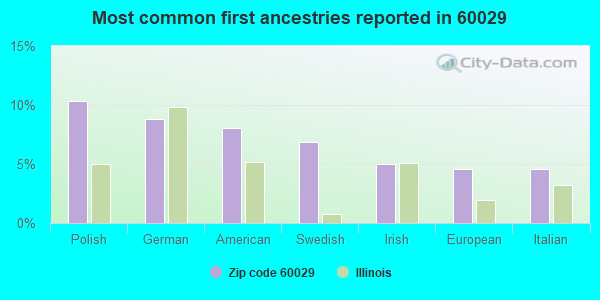
10%Polish
9%German
8%American
7%Swedish
5%Irish
5%European
5%Italian
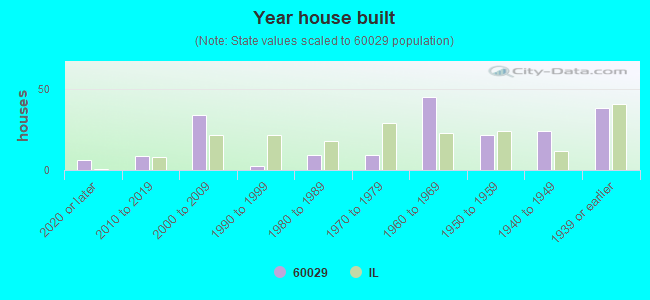
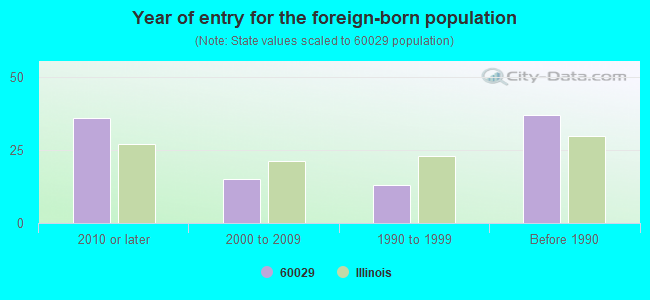
Year of entry for the foreign-born population
362010 or later
152000 to 2009
131990 to 1999
37Before 1990
Facilities with environmental interests located in this zip code:
GOLF CSOS (PO BOX 231 in GOLF, IL)
STATE MASTER (Illinois EPA Project) - National Pollutant Discharge Elimination System Permit National Pollutant Discharge Elimination System NON-MAJOR (Tracking pollutant discharge elimination systems) - permit Business SIC classification: NONCLASSIFIABLE ESTABLISHMENTS Alternative names: GOLF CSOS, VILLAGE OF
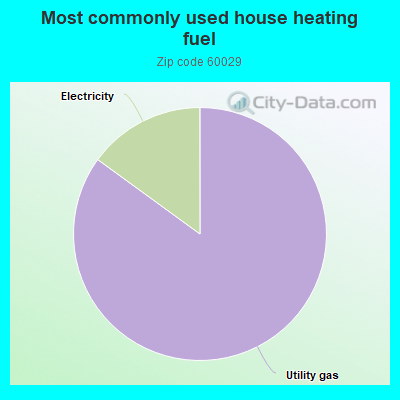
85.7%Utility gas
15.1%Electricity
Place of birth for U.S.-born residents:
This state: 313
Northeast: 21
Midwest: 73
South: 24
West: 6
86% of the 60029 zip code residents lived in the same house 5 years ago. Out of people who lived in different houses, 73% lived in this county. Out of people who lived in different counties, 50% lived in Illinois.
98% of the 60029 zip code residents lived in the same house 1 year ago. Out of people who lived in different houses, 100% moved from this county.
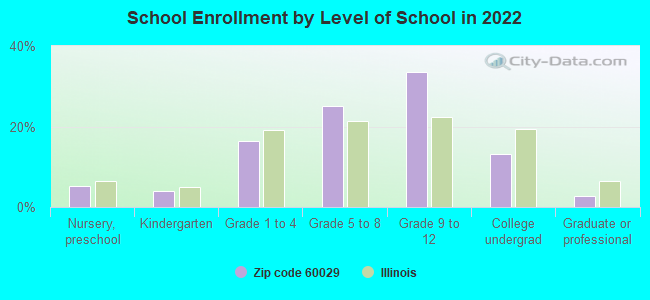
Private vs. public school enrollment:
Students in private schools in grades 1 to 8 (elementary and middle school): 24
Here:
38.3%
Illinois:
13.3%
Students in private schools in grades 9 to 12 (high school): 12
Here:
24.3%
Illinois:
9.9%
Students in private undergraduate colleges: 8
Here:
40.7%
Illinois:
27.4%
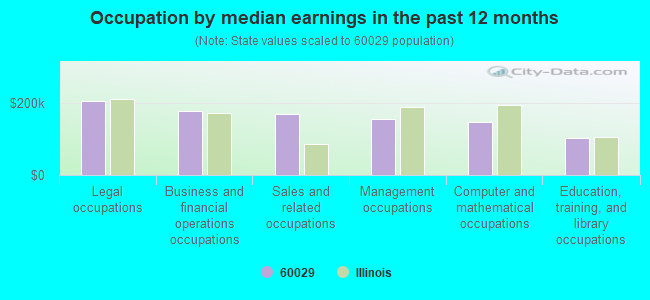
Occupation by median earnings in the past 12 months ($)
206,187Legal occupations
176,413Business and financial operations occupations
169,297Sales and related occupations
155,179Management occupations
146,984Computer and mathematical occupations
103,466Education, training, and library occupations
Top industries in this zip code by the number of employees in 2005:
Arts, Entertainment, and Recreation: Golf Courses and Country Clubs (20-49 employees: 1 establishment)
Other Services (except Public Administration): Grantmaking Foundations (20-49: 1)
Professional, Scientific, and Technical Services: Graphic Design Services (1-4: 2)
Arts, Entertainment, and Recreation: Independent Artists, Writers, and Performers (1-4: 2)
Construction: New Single-Family Housing Construction (except Operative Builders) (1-4: 1)
Professional, Scientific, and Technical Services: Administrative Management and General Management Consulting Services (1-4: 1)
Professional, Scientific, and Technical Services: Marketing Consulting Services (1-4: 1)
Health Care and Social Assistance: Offices of Dentists (1-4: 1)
People in group quarters in 2010:
33 people in workers' group living quarters and job corps centers
Fatal accident statistics in 2013:
Fatal accident count: 1
Vehicles involved in fatal accidents: 5
Fatal accidents caused by drunken drivers: 1
Fatalities: 1
Persons involved in fatal accidents: 5
Pedestrians involved in fatal accidents: 0
Home Mortgage Disclosure Act Aggregated Statistics For Year 2009 (Based on 2 partial tracts)
A) FHA, FSA/RHS & VA Home Purchase Loans
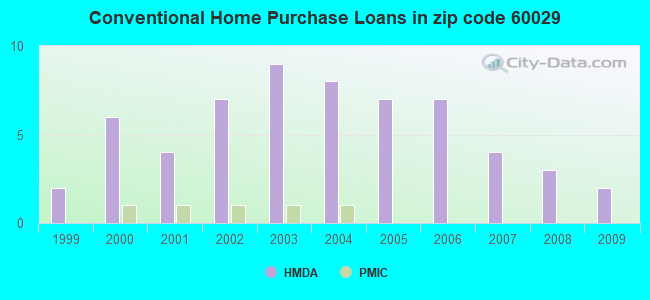
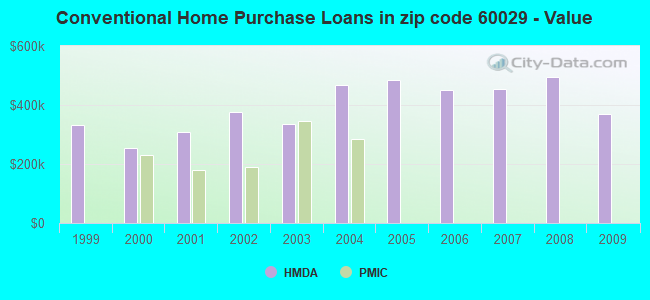
B) Conventional Home Purchase Loans
C) Refinancings
Number
Average Value
Number
Average Value
Number
Average Value
LOANS ORIGINATED
1
$215,830
2
$369,540
13
$334,906
APPLICATIONS APPROVED, NOT ACCEPTED
0
$0
0
$0
1
$577,330
APPLICATIONS DENIED
0
$0
0
$0
3
$382,993
APPLICATIONS WITHDRAWN
0
$0
0
$0
2
$376,930
FILES CLOSED FOR INCOMPLETENESS
0
$0
0
$0
0
$0
Aggregated Statistics For Year 2008 (Based on 2 partial tracts)
B) Conventional Home Purchase Loans
C) Refinancings
F) Non-occupant Loans on < 5 Family Dwellings (A B C & D)
Number
Average Value
Number
Average Value
Number
Average Value
LOANS ORIGINATED
3
$494,073
9
$426,841
1
$248,630
APPLICATIONS APPROVED, NOT ACCEPTED
1
$712,450
2
$388,135
0
$0
APPLICATIONS DENIED
2
$347,290
2
$895,310
0
$0
APPLICATIONS WITHDRAWN
0
$0
2
$528,450
0
$0
FILES CLOSED FOR INCOMPLETENESS
0
$0
0
$0
0
$0
Aggregated Statistics For Year 2007 (Based on 2 partial tracts)
B) Conventional Home Purchase Loans
C) Refinancings
D) Home Improvement Loans
F) Non-occupant Loans on < 5 Family Dwellings (A B C & D)
Number
Average Value
Number
Average Value
Number
Average Value
Number
Average Value
LOANS ORIGINATED
4
$455,168
10
$586,719
1
$359,720
1
$253,670
APPLICATIONS APPROVED, NOT ACCEPTED
1
$744,770
1
$920,650
0
$0
0
$0
APPLICATIONS DENIED
1
$429,220
2
$487,040
0
$0
0
$0
APPLICATIONS WITHDRAWN
1
$293,940
1
$580,260
0
$0
0
$0
FILES CLOSED FOR INCOMPLETENESS
0
$0
0
$0
0
$0
0
$0
Aggregated Statistics For Year 2006 (Based on 2 partial tracts)
B) Conventional Home Purchase Loans
C) Refinancings
D) Home Improvement Loans
F) Non-occupant Loans on < 5 Family Dwellings (A B C & D)
Number
Average Value
Number
Average Value
Number
Average Value
Number
Average Value
LOANS ORIGINATED
7
$451,147
8
$547,674
1
$304,660
1
$215,830
APPLICATIONS APPROVED, NOT ACCEPTED
1
$455,860
1
$533,480
0
$0
0
$0
APPLICATIONS DENIED
1
$285,660
1
$434,420
0
$0
0
$0
APPLICATIONS WITHDRAWN
1
$604,940
2
$441,320
0
$0
0
$0
FILES CLOSED FOR INCOMPLETENESS
0
$0
0
$0
0
$0
0
$0
Aggregated Statistics For Year 2005 (Based on 2 partial tracts)
B) Conventional Home Purchase Loans
C) Refinancings
D) Home Improvement Loans
Number
Average Value
Number
Average Value
Number
Average Value
LOANS ORIGINATED
7
$485,274
11
$468,805
1
$516,920
APPLICATIONS APPROVED, NOT ACCEPTED
0
$0
1
$340,230
0
$0
APPLICATIONS DENIED
1
$743,470
3
$461,000
0
$0
APPLICATIONS WITHDRAWN
0
$0
3
$383,480
0
$0
FILES CLOSED FOR INCOMPLETENESS
0
$0
1
$599,740
0
$0
Aggregated Statistics For Year 2004 (Based on 2 partial tracts)
B) Conventional Home Purchase Loans
C) Refinancings
F) Non-occupant Loans on < 5 Family Dwellings (A B C & D)
Number
Average Value
Number
Average Value
Number
Average Value
LOANS ORIGINATED
8
$468,728
13
$361,652
2
$175,150
APPLICATIONS APPROVED, NOT ACCEPTED
1
$330,970
1
$396,740
0
$0
APPLICATIONS DENIED
0
$0
2
$452,935
0
$0
APPLICATIONS WITHDRAWN
1
$356,790
3
$397,610
0
$0
FILES CLOSED FOR INCOMPLETENESS
0
$0
1
$275,590
0
$0
Aggregated Statistics For Year 2003 (Based on 2 partial tracts)
B) Conventional Home Purchase Loans
C) Refinancings
D) Home Improvement Loans
F) Non-occupant Loans on < 5 Family Dwellings (A B C & D)
Number
Average Value
Number
Average Value
Number
Average Value
Number
Average Value
LOANS ORIGINATED
9
$334,760
31
$312,169
1
$130,730
1
$208,680
APPLICATIONS APPROVED, NOT ACCEPTED
1
$306,450
3
$303,580
0
$0
0
$0
APPLICATIONS DENIED
1
$494,830
5
$319,214
0
$0
0
$0
APPLICATIONS WITHDRAWN
1
$180,100
3
$342,610
0
$0
0
$0
FILES CLOSED FOR INCOMPLETENESS
0
$0
1
$374,010
0
$0
0
$0
Aggregated Statistics For Year 2002 (Based on 2 partial tracts)
B) Conventional Home Purchase Loans
C) Refinancings
D) Home Improvement Loans
F) Non-occupant Loans on < 5 Family Dwellings (A B C & D)
Number
Average Value
Number
Average Value
Number
Average Value
Number
Average Value
LOANS ORIGINATED
7
$376,513
22
$325,693
1
$31,830
1
$352,730
APPLICATIONS APPROVED, NOT ACCEPTED
0
$0
3
$322,147
0
$0
0
$0
APPLICATIONS DENIED
0
$0
2
$339,010
0
$0
0
$0
APPLICATIONS WITHDRAWN
1
$163,540
2
$291,185
0
$0
0
$0
FILES CLOSED FOR INCOMPLETENESS
0
$0
1
$353,380
0
$0
0
$0
Aggregated Statistics For Year 2001 (Based on 2 partial tracts)
B) Conventional Home Purchase Loans
C) Refinancings
D) Home Improvement Loans
Number
Average Value
Number
Average Value
Number
Average Value
LOANS ORIGINATED
4
$307,788
14
$292,494
1
$90,130
APPLICATIONS APPROVED, NOT ACCEPTED
1
$511,560
1
$151,030
0
$0
APPLICATIONS DENIED
0
$0
2
$238,240
0
$0
APPLICATIONS WITHDRAWN
0
$0
1
$316,030
0
$0
FILES CLOSED FOR INCOMPLETENESS
0
$0
0
$0
0
$0
Aggregated Statistics For Year 2000 (Based on 2 partial tracts)
B) Conventional Home Purchase Loans
C) Refinancings
Number
Average Value
Number
Average Value
LOANS ORIGINATED
6
$255,888
3
$274,620
APPLICATIONS APPROVED, NOT ACCEPTED
1
$231,740
2
$145,835
APPLICATIONS DENIED
0
$0
0
$0
APPLICATIONS WITHDRAWN
0
$0
0
$0
FILES CLOSED FOR INCOMPLETENESS
0
$0
1
$164,190
Aggregated Statistics For Year 1999 (Based on 1 partial tract)

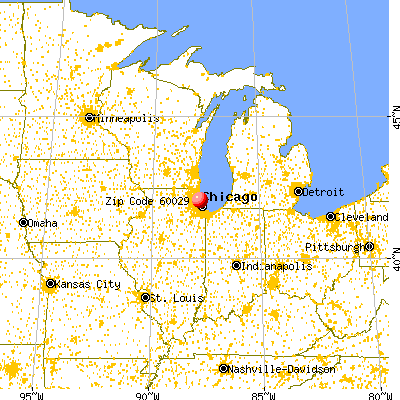


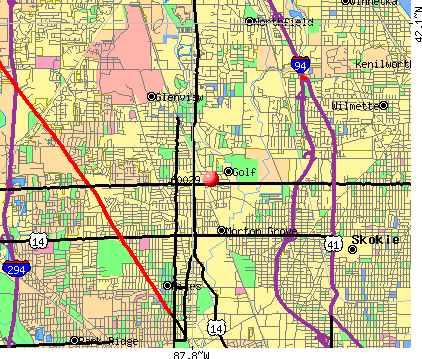 Nearest zip codes: 60053, 60077, 60714, 60025, 60093, 60076.