Estimated zip code population in 2022: 28,721 Zip code population in 2010: 28,929 Zip code population in 2000: 27,978
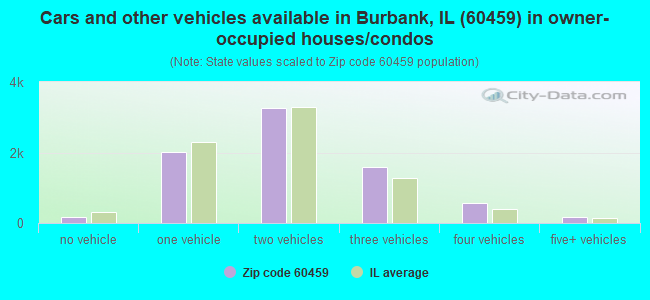
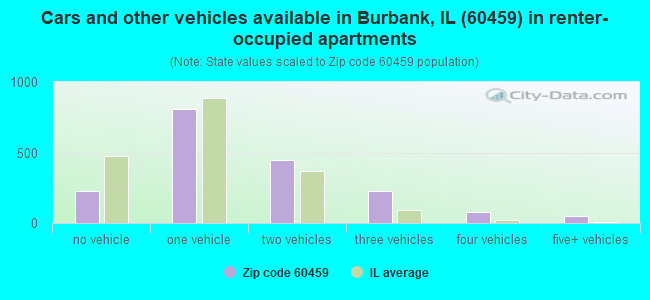
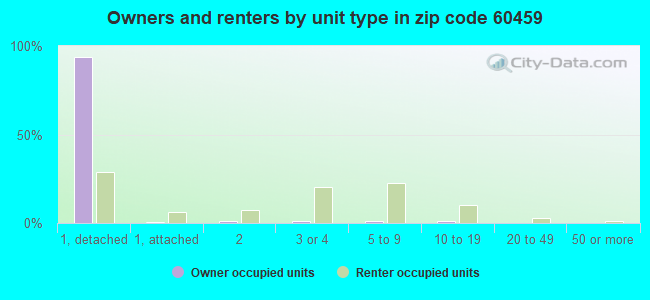
Houses and condos: 9,956 Renter-occupied apartments: 1,871
% of renters here:
19%
State:
33%
March 2022 cost of living index in zip code 60459: 100.3 (near average, U.S. average is 100)
Land area: 4.2 sq. mi. Water area: 0.0 sq. mi.
Population density: 6,844 people per square mile
(high).
OSM Map
General Map
Google Map
MSN Map
OSM Map
General Map
Google Map
MSN Map
OSM Map
General Map
Google Map
MSN Map
OSM Map
General Map
Google Map
MSN Map
Please wait while loading the map...
Real estate property taxes paid for housing units in 2022:
This zip code:
2.1% ($5,442)
Illinois:
2.0% ($4,912)
Median real estate property taxes paid for housing units with mortgages in 2022: $5,420 (2.1%) Median real estate property taxes paid for housing units with no mortgage in 2022: $5,459 (2.0%)
Business Search- 14 Million verified businesses
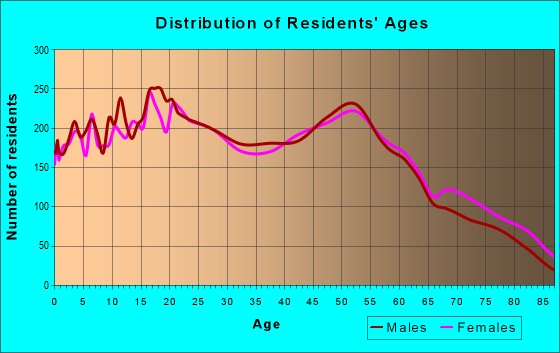
Males: 14,653
(51.0%)
Females: 14,068
(49.0%)
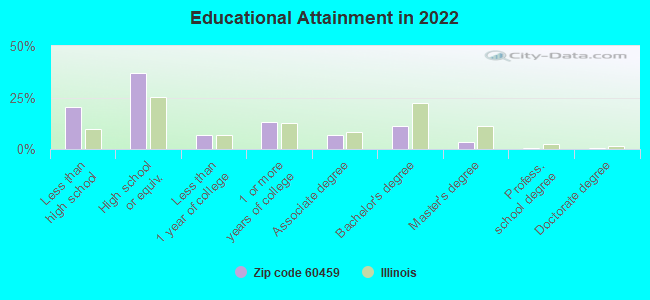
For population 25 years and over in 60459:
High school or higher: 78.6%
Bachelor's degree or higher: 15.4%
Graduate or professional degree: 4.3%
Unemployed: 6.0%
Mean travel time to work (commute): 32.5 minutes
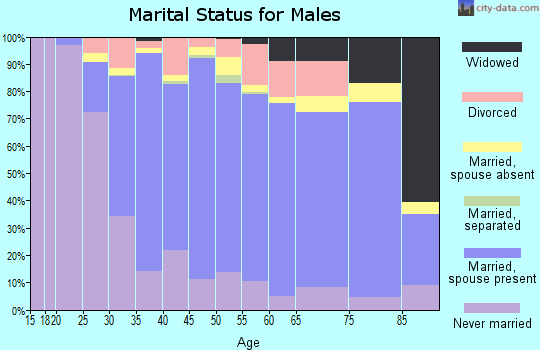
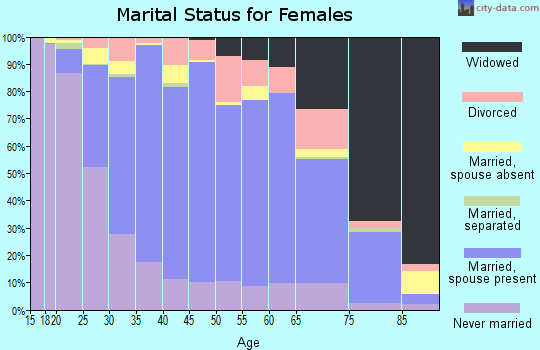
For population 15 years and over in 60459:
Never married: 35.3%
Now married: 50.2%
Separated: 2.3%
Widowed: 5.6%
Divorced: 6.6%
Zip code 60459 compared to state average:
Black race population percentage significantly below state average.
Hispanic race population percentage above state average.
Foreign-born population percentage above state average.
Renting percentage below state average.
Length of stay since moving in significantly above state average.
Percentage of population with a bachelor's degree or higher significantly below state average.
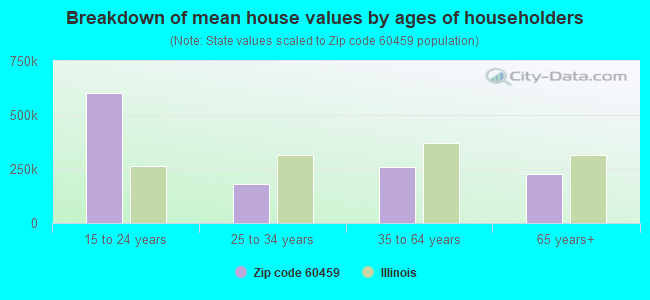
Estimated median house/condo value in 2022: $263,175
60459:
$263,175
Illinois:
$251,600
According to our research of Illinois and other state lists, there were 16 registered sex offenders living in 60459 zip code as of April 26, 2024. The ratio of all residents to sex offenders in zip code 60459 is 1,841 to 1. The ratio of registered sex offenders to all residents in this zip code is lower than the state average.
Median resident age:
This zip code:
38.0 years
Illinois median age:
39.1 years
Average household size:
This zip code:
3.0 people
Illinois:
2.4 people
Averages for the 2020 tax year for zip code 60459, filed in 2021:
Average Adjusted Gross Income (AGI) in 2020: $49,386 (Individual Income Tax Returns)
Here:
$49,386
State:
$82,626
Salary/wage: $46,477 (reported on 78.5% of returns)
Here:
$46,477
State:
$66,640
(% of AGI for various income ranges: 1069.1% for AGIs below $25k, 3351.2% for AGIs $25k-50k, 6614.6% for AGIs $50k-75k, 9705.7% for AGIs $75k-100k, 15900.6% for AGIs $100k-200k, 49852.0% for AGIs over 200k)
Taxable interest for individuals: $1,053 (reported on 20.7% of returns)
This zip code:
$1,053
Illinois:
$2,376
(% of AGI for various income ranges: 16.2% for AGIs below $25k, 23.3% for AGIs $25k-50k, 27.2% for AGIs $50k-75k, 54.1% for AGIs $75k-100k, 77.4% for AGIs $100k-200k, 220.0% for AGIs over 200k)
Ordinary dividends: $2,609 (reported on 10.1% of returns)
Here:
$2,609
State:
$9,061
(% of AGI for various income ranges: 10.8% for AGIs below $25k, 16.9% for AGIs $25k-50k, 43.4% for AGIs $50k-75k, 45.6% for AGIs $75k-100k, 141.3% for AGIs $100k-200k, 772.0% for AGIs over 200k)
Net capital gain/loss in AGI: +$11,341 (reported on 9.0% of returns)
Here:
+$11,341
State:
+$31,684
(% of AGI for various income ranges: 3.5% for AGIs below $25k, 20.0% for AGIs $25k-50k, 73.8% for AGIs $50k-75k, 101.1% for AGIs $75k-100k, 346.1% for AGIs $100k-200k, 17018.0% for AGIs over 200k)
Profit/loss from business: +$9,844 (reported on 18.2% of returns)
Here:
+$9,844
State:
+$12,175
(% of AGI for various income ranges: 283.2% for AGIs below $25k, 256.2% for AGIs $25k-50k, 206.4% for AGIs $50k-75k, 225.7% for AGIs $75k-100k, 177.1% for AGIs $100k-200k, 576.0% for AGIs over 200k)
Taxable individual retirement arrangement distribution: $13,218 (reported on 6.0% of returns)
60459:
$13,218
Illinois:
$21,613
(% of AGI for various income ranges: 41.9% for AGIs below $25k, 62.2% for AGIs $25k-50k, 106.6% for AGIs $50k-75k, 185.5% for AGIs $75k-100k, 473.4% for AGIs $100k-200k)
Total itemized deductions: $24,078 (reported on 5.5% of returns)
Here:
$24,078
State:
$34,948
(% of AGI for various income ranges: 31.7% for AGIs below $25k, 97.1% for AGIs $25k-50k, 263.8% for AGIs $50k-75k, 402.1% for AGIs $75k-100k, 494.8% for AGIs $100k-200k, 3500.0% for AGIs over 200k)
Charity contributions: $4,088 (reported on 3.9% of returns)
Here:
$4,088
State:
$13,122
(% of AGI for various income ranges: 1.3% for AGIs below $25k, 9.0% for AGIs $25k-50k, 26.5% for AGIs $50k-75k, 34.4% for AGIs $75k-100k, 86.0% for AGIs $100k-200k, 726.0% for AGIs over 200k)
Taxes paid: $8,430 (reported on 5.4% of returns)
60459:
$8,430
State:
$8,563
(% of AGI for various income ranges: 8.8% for AGIs below $25k, 32.6% for AGIs $25k-50k, 101.4% for AGIs $50k-75k, 155.0% for AGIs $75k-100k, 161.8% for AGIs $100k-200k, 760.0% for AGIs over 200k)
Earned income credit: $2,515 (reported on 17.8% of returns)
Here:
$2,515
State:
$2,311
(% of AGI for various income ranges: 108.8% for AGIs below $25k, 81.4% for AGIs $25k-50k, 1.5% for AGIs $50k-75k)
Percentage of individuals using paid preparers for their 2020 taxes: 90.8%
Here:
91%
State:
93%
(% for various income ranges: 88.7% for AGIs below $25k, 92.4% for AGIs $25k-50k, 90.6% for AGIs $50k-75k, 92.1% for AGIs $75k-100k, 92.7% for AGIs $100k-200k, 92.9% for AGIs over 200k)
Averages for the 2012 tax year for zip code 60459, filed in 2013:
Average Adjusted Gross Income (AGI) in 2012: $40,662 (Individual Income Tax Returns)
Here:
$40,662
State:
$68,058
Salary/wage: $39,773 (reported on 79.6% of returns)
Here:
$39,773
State:
$55,396
(% of AGI for various income ranges: 64.3% for AGIs below $25k, 77.5% for AGIs $25k-50k, 80.7% for AGIs $50k-75k, 82.2% for AGIs $75k-100k, 82.8% for AGIs $100k-200k, 57.7% for AGIs over 200k)
Taxable interest for individuals: $800 (reported on 29.4% of returns)
This zip code:
$800
Illinois:
$1,969
(% of AGI for various income ranges: 1.1% for AGIs below $25k, 0.5% for AGIs $25k-50k, 0.6% for AGIs $50k-75k, 0.4% for AGIs $75k-100k, 0.5% for AGIs $100k-200k, 0.7% for AGIs over 200k)
Ordinary dividends: $2,020 (reported on 13.0% of returns)
Here:
$2,020
State:
$7,786
(% of AGI for various income ranges: 1.0% for AGIs below $25k, 0.6% for AGIs $25k-50k, 0.7% for AGIs $50k-75k, 0.4% for AGIs $75k-100k, 0.5% for AGIs $100k-200k, 0.4% for AGIs over 200k)
Net capital gain/loss in AGI: +$1,641 (reported on 7.8% of returns)
Here:
+$1,641
State:
+$22,183
(% of AGI for various income ranges: 0.2% for AGIs $50k-75k, 0.5% for AGIs $75k-100k, 1.0% for AGIs $100k-200k)
Profit/loss from business: +$10,872 (reported on 17.3% of returns)
Here:
+$10,872
State:
+$12,903
(% of AGI for various income ranges: 17.8% for AGIs below $25k, 6.1% for AGIs $25k-50k, 2.4% for AGIs $50k-75k, 0.9% for AGIs $75k-100k, 0.9% for AGIs $100k-200k)
Taxable individual retirement arrangement distribution: $9,998 (reported on 8.0% of returns)
60459:
$9,998
Illinois:
$17,929
(% of AGI for various income ranges: 3.1% for AGIs below $25k, 1.7% for AGIs $25k-50k, 1.8% for AGIs $50k-75k, 1.9% for AGIs $75k-100k, 2.1% for AGIs $100k-200k)
Total itemized deductions: $18,585 (27% of AGI, reported on 30.2% of returns)
Here:
$18,585
State:
$26,433
Here:
26.7% of AGI
State:
19.2% of AGI
(% of AGI for various income ranges: 9.0% for AGIs below $25k, 12.6% for AGIs $25k-50k, 15.0% for AGIs $50k-75k, 15.0% for AGIs $75k-100k, 15.4% for AGIs $100k-200k, 17.9% for AGIs over 200k)
Charity contributions: $1,643 (reported on 24.2% of returns)
Here:
$1,643
State:
$4,525
(% of AGI for various income ranges: 0.5% for AGIs below $25k, 0.8% for AGIs $25k-50k, 1.0% for AGIs $50k-75k, 1.1% for AGIs $75k-100k, 1.3% for AGIs $100k-200k, 0.8% for AGIs over 200k)
Taxes paid: $7,935 (reported on 30.2% of returns)
60459:
$7,935
State:
$11,968
(% of AGI for various income ranges: 3.0% for AGIs below $25k, 4.9% for AGIs $25k-50k, 6.7% for AGIs $50k-75k, 6.7% for AGIs $75k-100k, 7.2% for AGIs $100k-200k, 6.2% for AGIs over 200k)
Earned income credit: $2,457 (reported on 19.8% of returns)
Here:
$2,457
State:
$2,349
(% of AGI for various income ranges: 6.9% for AGIs below $25k, 1.3% for AGIs $25k-50k)
Percentage of individuals using paid preparers for their 2012 taxes: 64.0%
Here:
64%
State:
57%
(% for various income ranges: 59.9% for AGIs below $25k, 65.9% for AGIs $25k-50k, 67.8% for AGIs $50k-75k, 68.7% for AGIs $75k-100k, 68.5% for AGIs $100k-200k, 66.7% for AGIs over 200k)
Averages for the 2004 tax year for zip code 60459, filed in 2005:
Average Adjusted Gross Income (AGI) in 2004: $37,184 (Individual Income Tax Returns)
Here:
$37,184
State:
$54,625
Salary/wage: $36,551 (reported on 81.7% of returns)
Here:
$36,551
State:
$46,811
(% of AGI for various income ranges: 85.6% for AGIs below $10k, 64.4% for AGIs $10k-25k, 81.8% for AGIs $25k-50k, 86.2% for AGIs $50k-75k, 86.7% for AGIs $75k-100k, 70.2% for AGIs over 100k)
Taxable interest for individuals: $1,070 (reported on 47.9% of returns)
This zip code:
$1,070
Illinois:
$2,101
(% of AGI for various income ranges: 4.3% for AGIs below $10k, 3.1% for AGIs $10k-25k, 1.4% for AGIs $25k-50k, 0.9% for AGIs $50k-75k, 0.9% for AGIs $75k-100k, 1.2% for AGIs over 100k)
Taxable dividends: $1,342 (reported on 18.2% of returns)
Here:
$1,342
State:
$4,306
(% of AGI for various income ranges: 1.5% for AGIs below $10k, 1.2% for AGIs $10k-25k, 0.7% for AGIs $25k-50k, 0.5% for AGIs $50k-75k, 0.5% for AGIs $75k-100k, 0.6% for AGIs over 100k)
Net capital gain/loss: +$6,888 (reported on 11.0% of returns)
Here:
+$6,888
State:
+$17,321
(% of AGI for various income ranges: -0.6% for AGIs below $10k, 0.2% for AGIs $10k-25k, 0.4% for AGIs $25k-50k, 0.5% for AGIs $50k-75k, 1.1% for AGIs $75k-100k, 10.8% for AGIs over 100k)
Profit/loss from business: +$9,855 (reported on 15.4% of returns)
Here:
+$9,855
State:
+$11,771
(% of AGI for various income ranges: 18.0% for AGIs below $10k, 14.3% for AGIs $10k-25k, 4.8% for AGIs $25k-50k, 1.7% for AGIs $50k-75k, 1.3% for AGIs $75k-100k, 0.8% for AGIs over 100k)
IRA payment deduction: $3,078 (reported on 2.5% of returns)
60459:
$3,078
Illinois:
$3,087
(% of AGI for various income ranges: 0.3% for AGIs $10k-25k, 0.3% for AGIs $25k-50k, 0.1% for AGIs $50k-75k, 0.2% for AGIs $75k-100k, 0.1% for AGIs over 100k)
Total itemized deductions: $15,366 (26% of AGI, reported on 34.3% of returns)
Here:
$15,366
State:
$20,239
Here:
25.7% of AGI
State:
19.5% of AGI
(% of AGI for various income ranges: 11.1% for AGIs below $10k, 10.8% for AGIs $10k-25k, 14.7% for AGIs $25k-50k, 15.3% for AGIs $50k-75k, 14.4% for AGIs $75k-100k, 13.8% for AGIs over 100k)
Charity contributions deductions: $1,675 (3% of AGI, reported on 30.3% of returns)
Here:
$1,675
State:
$3,719
Here:
2.7% of AGI
State:
3.4% of AGI
(% of AGI for various income ranges: 0.4% for AGIs below $10k, 0.7% for AGIs $10k-25k, 1.2% for AGIs $25k-50k, 1.5% for AGIs $50k-75k, 1.6% for AGIs $75k-100k, 1.7% for AGIs over 100k)
Total tax: $4,169 (reported on 76.7% of returns)
60459:
$4,169
State:
$9,882
(% of AGI for various income ranges: 4.4% for AGIs below $10k, 5.1% for AGIs $10k-25k, 6.7% for AGIs $25k-50k, 8.2% for AGIs $50k-75k, 9.8% for AGIs $75k-100k, 14.6% for AGIs over 100k)
Earned income credit: $1,729 (reported on 13.7% of returns)
Here:
$1,729
State:
$1,788
Percentage of individuals using paid preparers for their 2004 taxes: 62.7%
Here:
63%
State:
61%
(% for various income ranges: 52.8% for AGIs below $10k, 63.4% for AGIs $10k-25k, 64.2% for AGIs $25k-50k, 67.3% for AGIs $50k-75k, 67.2% for AGIs $75k-100k, 69.9% for AGIs over 100k)
Likely homosexual households (counted as self-reported same-sex unmarried-partner households)
Lesbian couples: 0.1% of all households
Gay men: 0.0% of all households
Household received Food Stamps/SNAP in the past 12 months: 1,302 Household did not receive Food Stamps/SNAP in the past 12 months: 8,314
Women who had a birth in the past 12 months: 209 (131 now married, 78 unmarried) Women who did not have a birth in the past 12 months: 6,133 (2,622 now married, 3,504 unmarried)
Housing units in zip code 60459 with a mortgage: 4,594 (197 second mortgage, 9 home equity loan, 160 both second mortgage and home equity loan) Houses without a mortgage: 74
Median monthly owner costs for units with a mortgage: $1,745 Median monthly owner costs for units without a mortgage: $754
Residents with income below the poverty level in 2022:
This zip code:
11.2%
Whole state:
11.9%
Residents with income below 50% of the poverty level in 2022:
This zip code:
8.2%
Whole state:
5.7%
Median number of rooms in houses and condos:
Here:
6.2
State:
6.4
Median number of rooms in apartments:
Here:
4.4
State:
4.1
Notable locations in this zip code not listed on our city pages
Notable locations in zip code 60459: Burbank Fire Department Station 2 (A), Burbank Fire Department Station 1 (B), Burbank City Hall (C), Prairie Trails Public Library (D). Display/hide their locations on the map
Churches in zip code 60459 include: Archangel Michael Eastern Orthodox Church (A), Burbank Baptist Temple (B), Church of Christ (C), Church of Gods Prophecy (D), Community Church of God (E), First Baptist Church of Burbank (F), Holy Trinity Lutheran Church (G), Immanuel Christian Reformed Church (H), Jordan Baptist Church (I). Display/hide their locations on the map
Parks in zip code 60459 include: Harr Park (1), Fitzgerald Park (2), Stevenson Park (3), Newcastle Park (4), McArthur Park (5), Ridgeland Park (6), Rice Park (7), Owens Park (8). Display/hide their locations on the map
4,640 married couples with children.
1,707 single-parent households (611 men, 1,096 women).
42.4% of residents of 60459 zip code speak English at home.
37.5% of residents speak Spanish at home (67% very well, 14% well, 17% not well, 2% not at all).
14.1% of residents speak other Indo-European language at home (37% very well, 29% well, 28% not well, 6% not at all).
1.3% of residents speak Asian or Pacific Island language at home (49% very well, 26% well, 12% not well, 12% not at all).
5.4% of residents speak other language at home (66% very well, 22% well, 9% not well, 3% not at all).
Foreign born population: 8,627 (30.0%) (53.4% of them are naturalized citizens)
This zip code:
30.0%
Whole state:
14.4%
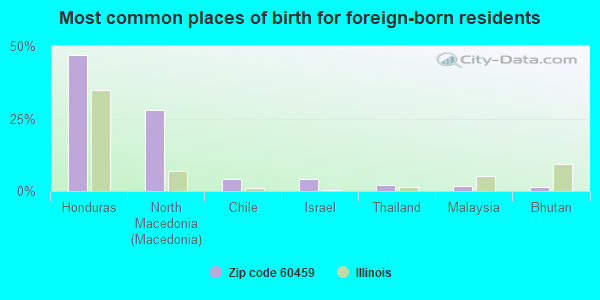
47%Honduras
28%North Macedonia (Macedonia)
4%Chile
4%Israel
2%Thailand
2%Malaysia
1%Bhutan
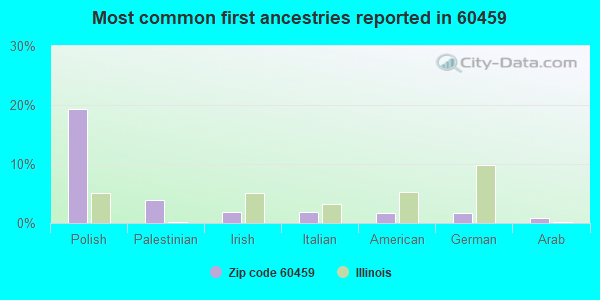
19%Polish
4%Palestinian
2%Irish
2%Italian
2%American
2%German
1%Arab
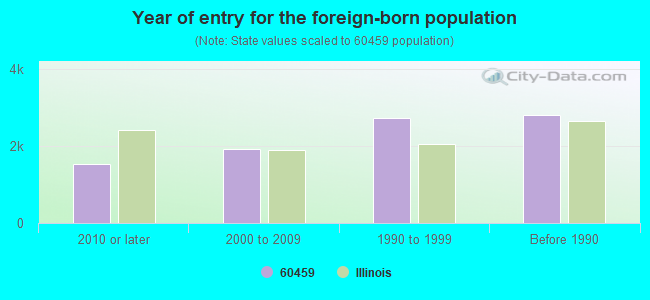
Year of entry for the foreign-born population
1,5402010 or later
1,9232000 to 2009
2,7231990 to 1999
2,805Before 1990
Major facilities with environmental interests located in this zip code:
REAVIS HIGH SCHOOL (6034 W 77TH ST in BURBANK, IL)
STATE MASTER (Illinois EPA Project) - HAZARDOUS WASTE PROGRAM (Geographic Names Information System) (National Center for Education Statistics) - STATE ID-1401622000001 Large Quantity Generators, more that 1000 kg of hazardous waste/month (Resource Conservation and Recovery Act (tracking hazardous waste)) - notification Organizations: REAVIS TWP H S DIST 220 (SCHOOL DISTRICT)
NORGE VILLAGE CLEANERS (4812 W. 83RD ST. in BURBANK, IL)
STATE MASTER (Illinois EPA Project) - HAZARDOUS WASTE PROGRAM, AIR PROGRAM AIR MINOR (AIRS/AFS) Small Quantity Generators, between 100 kg and 1000 kg of hazardous waste/month (Resource Conservation and Recovery Act (tracking hazardous waste)) - notification Business SIC classification: NONCLASSIFIABLE ESTABLISHMENTS Organizations: SUNAI LIM (CONTACT/OWNER)
Alternative names: NORGE CLEANERS
PHILLIPS 66 CO - STATION #14097 (5141 W 79TH ST in BURBANK, IL)
STATE MASTER (Illinois EPA Project) - HAZARDOUS WASTE PROGRAM, AIR PROGRAM, SOLID WASTE PROGRAM AIR MINOR (AIRS/AFS) CRITERIA AND HAZARDOUS AIR POLLUTANT INVENTORY (Inventory of air pollution sources) Business SIC classification: GASOLINE SERVICE STATIONS Alternative names: PHILLIPS 66 COMPANY
ROBERT SHEEHY & SONS FH INC (4950 W 79TH ST in BURBANK, IL)
STATE MASTER (Illinois EPA Project) - HAZARDOUS WASTE PROGRAM Large Quantity Generators, more that 1000 kg of hazardous waste/month (Resource Conservation and Recovery Act (tracking hazardous waste)) - notification Organizations: SHEEHY ROBERT AND SONS (CONTACT/OWNER)
Alternative names: SHEEHY ROBERT AND SONS FH INC
ATLAS WASTE OIL (7707 S MULLIGAN AVE in BURBANK, IL)
STATE MASTER (Illinois EPA Project) - SOLID WASTE PROGRAM TRANSPORTER (Resource Conservation and Recovery Act (tracking hazardous waste)) Organizations: SAIDA ANTHONY (CONTACT/OWNER)
HUGOS DRY CLEANING (5603 W 79TH ST in BURBANK, IL)
STATE MASTER (Illinois EPA Project) - HAZARDOUS WASTE PROGRAM Small Quantity Generators, between 100 kg and 1000 kg of hazardous waste/month (Resource Conservation and Recovery Act (tracking hazardous waste)) - notification Organizations: SABATINI LINDA (CONTACT/OWNER)
ROSE BRITE CLEANERS (8050 S CICERO AVE in BURBANK, IL)
STATE MASTER (Illinois EPA Project) - AIR PROGRAM AIR MINOR (AIRS/AFS) Business SIC classification: DRYCLEANING PLANTS, EXCEPT RUG CLEANING
7-ELEVEN 23591 (5560 W 87TH ST in BURBANK, IL)
STATE MASTER (Illinois EPA Project) - HAZARDOUS WASTE PROGRAM Small Quantity Generators, between 100 kg and 1000 kg of hazardous waste/month (Resource Conservation and Recovery Act (tracking hazardous waste)) - notification Organizations: SOUTHLAND THE CORP (CONTACT/OWNER)
HUGOS DRY CLEANERS (5620 W 79TH ST in BURBANK, IL)
STATE MASTER (Illinois EPA Project) - HAZARDOUS WASTE PROGRAM Small Quantity Generators, between 100 kg and 1000 kg of hazardous waste/month (Resource Conservation and Recovery Act (tracking hazardous waste)) - notification Organizations: SABATINI DIEGO (CONTACT/OWNER)
JEWEL FOOD STORES, INC. #3060 (7910 SOUTH CICERO AVENUE in BURBANK, IL)
AIR MINOR (AIRS/AFS) - ICIS-05-2003-0340, ENFORCEMENT/COMPLIANCE ACTIVITY Business SIC classification: GROCERY STORES
JIFFY LUBE (6400 W 87TH ST in BURBANK, IL)
STATE MASTER (Illinois EPA Project) - HAZARDOUS WASTE PROGRAM Small Quantity Generators, between 100 kg and 1000 kg of hazardous waste/month (Resource Conservation and Recovery Act (tracking hazardous waste)) - notification Organizations: JIFFY LUBE INTERNATIONAL (CONTACT/OWNER)
Alternative names: JIFFY LUBE 325
KEAN BROS INC (7901 S NATCHEZ in BURBANK, IL)
STATE MASTER (Illinois EPA Project) - HAZARDOUS WASTE PROGRAM Small Quantity Generators, between 100 kg and 1000 kg of hazardous waste/month (Resource Conservation and Recovery Act (tracking hazardous waste)) - notification Organizations: KEAN BROTHERS CO (CONTACT/OWNER)
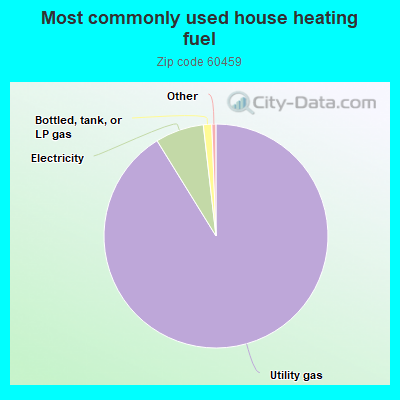
Housing units lacking complete plumbing facilities: 0.4% Housing units lacking complete kitchen facilities: 0.9%
91.2%Utility gas
7.0%Electricity
1.2%Bottled, tank, or LP gas
Population in 1990: 27,870. Population change in the 1990s: +108 (+0.4%).
Place of birth for U.S.-born residents:
This state: 18,594
Northeast: 145
Midwest: 286
South: 387
West: 191
70% of the 60459 zip code residents lived in the same house 5 years ago. Out of people who lived in different houses, 93% lived in this county. Out of people who lived in different counties, 50% lived in Illinois.
93% of the 60459 zip code residents lived in the same house 1 year ago. Out of people who lived in different houses, 82% moved from this county. Out of people who lived in different houses, 5% moved from different county within same state. Out of people who lived in different houses, 6% moved from different state. Out of people who lived in different houses, 4% moved from abroad.
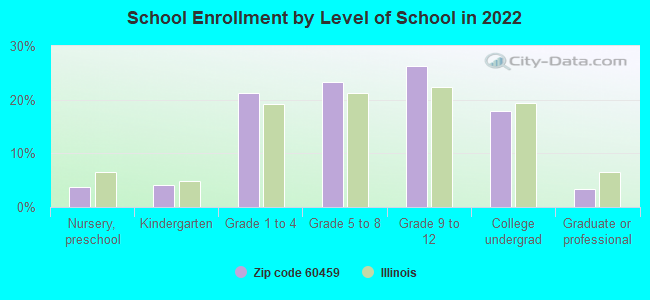
Private vs. public school enrollment:
Students in private schools in grades 1 to 8 (elementary and middle school): 188
Here:
5.8%
Illinois:
13.3%
Students in private schools in grades 9 to 12 (high school): 132
Here:
6.9%
Illinois:
9.9%
Students in private undergraduate colleges: 457
Here:
34.8%
Illinois:
27.4%
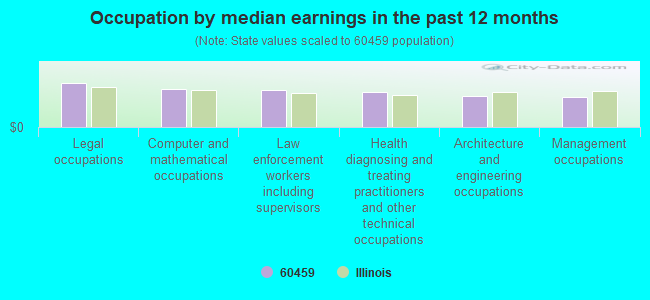
Occupation by median earnings in the past 12 months ($)
106,207Legal occupations
90,918Computer and mathematical occupations
89,395Law enforcement workers including supervisors
83,424Health diagnosing and treating practitioners and other technical occupations
75,519Architecture and engineering occupations
71,805Management occupations
Top industries in this zip code by the number of employees in 2005:
2002 - 2018 National Fire Incident Reporting System (NFIRS) incidents
Based on the data from the years 2002 - 2018 the average number of fires per year is 88. The highest number of reported fire incidents - 130 took place in 2016, and the least - 46 in 2004. The data has a declining trend.
When looking into fire subcategories, the most reports belonged to: Structure Fires (55.3%), and Outside Fires (25.0%).
Fire incident types reported to NFIRS in Zip Code 60459
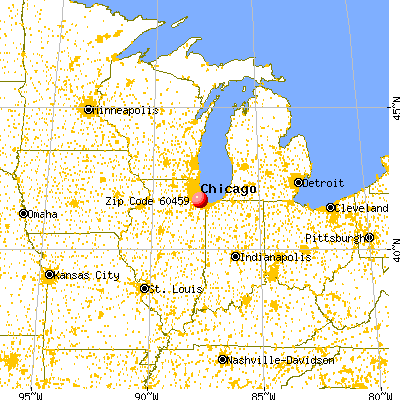


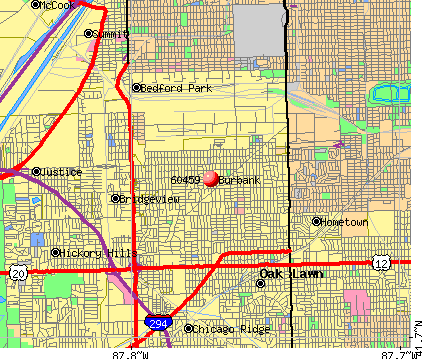 Nearest zip codes: 60453, 60638, 60456, 60455, 60415, 60652.


 Based on the data from the years 2002 - 2018 the average number of fires per year is 88. The highest number of reported fire incidents - 130 took place in 2016, and the least - 46 in 2004. The data has a declining trend.
 When looking into fire subcategories, the most reports belonged to: Structure Fires (55.3%), and Outside Fires (25.0%).