Burbank, Illinois Submit your own pictures of this city and show them to the world
OSM Map
General Map
Google Map
MSN Map
OSM Map
General Map
Google Map
MSN Map
OSM Map
General Map
Google Map
MSN Map
OSM Map
General Map
Google Map
MSN Map
Please wait while loading the map...
Population in 2022: 28,433 (100% urban, 0% rural). Population change since 2000: +1.9%Males: 14,490 Females: 13,943
March 2022 cost of living index in Burbank: 100.7 (near average, U.S. average is 100) Percentage of residents living in poverty in 2022: 11.4%for White Non-Hispanic residents , 25.1% for Black residents , 11.1% for Hispanic or Latino residents , 17.9% for American Indian residents , 8.3% for other race residents , 17.2% for two or more races residents )Business Search - 14 Million verified businesses
Data:
Median household income ($)
Median household income (% change since 2000)
Household income diversity
Ratio of average income to average house value (%)
Ratio of average income to average rent
Median household income ($) - White
Median household income ($) - Black or African American
Median household income ($) - Asian
Median household income ($) - Hispanic or Latino
Median household income ($) - American Indian and Alaska Native
Median household income ($) - Multirace
Median household income ($) - Other Race
Median household income for houses/condos with a mortgage ($)
Median household income for apartments without a mortgage ($)
Races - White alone (%)
Races - White alone (% change since 2000)
Races - Black alone (%)
Races - Black alone (% change since 2000)
Races - American Indian alone (%)
Races - American Indian alone (% change since 2000)
Races - Asian alone (%)
Races - Asian alone (% change since 2000)
Races - Hispanic (%)
Races - Hispanic (% change since 2000)
Races - Native Hawaiian and Other Pacific Islander alone (%)
Races - Native Hawaiian and Other Pacific Islander alone (% change since 2000)
Races - Two or more races (%)
Races - Two or more races (% change since 2000)
Races - Other race alone (%)
Races - Other race alone (% change since 2000)
Racial diversity
Unemployment (%)
Unemployment (% change since 2000)
Unemployment (%) - White
Unemployment (%) - Black or African American
Unemployment (%) - Asian
Unemployment (%) - Hispanic or Latino
Unemployment (%) - American Indian and Alaska Native
Unemployment (%) - Multirace
Unemployment (%) - Other Race
Population density (people per square mile)
Population - Males (%)
Population - Females (%)
Population - Males (%) - White
Population - Males (%) - Black or African American
Population - Males (%) - Asian
Population - Males (%) - Hispanic or Latino
Population - Males (%) - American Indian and Alaska Native
Population - Males (%) - Multirace
Population - Males (%) - Other Race
Population - Females (%) - White
Population - Females (%) - Black or African American
Population - Females (%) - Asian
Population - Females (%) - Hispanic or Latino
Population - Females (%) - American Indian and Alaska Native
Population - Females (%) - Multirace
Population - Females (%) - Other Race
Coronavirus confirmed cases (Apr 27, 2024)
Deaths caused by coronavirus (Apr 27, 2024)
Coronavirus confirmed cases (per 100k population) (Apr 27, 2024)
Deaths caused by coronavirus (per 100k population) (Apr 27, 2024)
Daily increase in number of cases (Apr 27, 2024)
Weekly increase in number of cases (Apr 27, 2024)
Cases doubled (in days) (Apr 27, 2024)
Hospitalized patients (Apr 18, 2022)
Negative test results (Apr 18, 2022)
Total test results (Apr 18, 2022)
COVID Vaccine doses distributed (per 100k population) (Sep 19, 2023)
COVID Vaccine doses administered (per 100k population) (Sep 19, 2023)
COVID Vaccine doses distributed (Sep 19, 2023)
COVID Vaccine doses administered (Sep 19, 2023)
Likely homosexual households (%)
Likely homosexual households (% change since 2000)
Likely homosexual households - Lesbian couples (%)
Likely homosexual households - Lesbian couples (% change since 2000)
Likely homosexual households - Gay men (%)
Likely homosexual households - Gay men (% change since 2000)
Cost of living index
Median gross rent ($)
Median contract rent ($)
Median monthly housing costs ($)
Median house or condo value ($)
Median house or condo value ($ change since 2000)
Mean house or condo value by units in structure - 1, detached ($)
Mean house or condo value by units in structure - 1, attached ($)
Mean house or condo value by units in structure - 2 ($)
Mean house or condo value by units in structure by units in structure - 3 or 4 ($)
Mean house or condo value by units in structure - 5 or more ($)
Mean house or condo value by units in structure - Boat, RV, van, etc. ($)
Mean house or condo value by units in structure - Mobile home ($)
Median house or condo value ($) - White
Median house or condo value ($) - Black or African American
Median house or condo value ($) - Asian
Median house or condo value ($) - Hispanic or Latino
Median house or condo value ($) - American Indian and Alaska Native
Median house or condo value ($) - Multirace
Median house or condo value ($) - Other Race
Median resident age
Resident age diversity
Median resident age - Males
Median resident age - Females
Median resident age - White
Median resident age - Black or African American
Median resident age - Asian
Median resident age - Hispanic or Latino
Median resident age - American Indian and Alaska Native
Median resident age - Multirace
Median resident age - Other Race
Median resident age - Males - White
Median resident age - Males - Black or African American
Median resident age - Males - Asian
Median resident age - Males - Hispanic or Latino
Median resident age - Males - American Indian and Alaska Native
Median resident age - Males - Multirace
Median resident age - Males - Other Race
Median resident age - Females - White
Median resident age - Females - Black or African American
Median resident age - Females - Asian
Median resident age - Females - Hispanic or Latino
Median resident age - Females - American Indian and Alaska Native
Median resident age - Females - Multirace
Median resident age - Females - Other Race
Commute - mean travel time to work (minutes)
Travel time to work - Less than 5 minutes (%)
Travel time to work - Less than 5 minutes (% change since 2000)
Travel time to work - 5 to 9 minutes (%)
Travel time to work - 5 to 9 minutes (% change since 2000)
Travel time to work - 10 to 19 minutes (%)
Travel time to work - 10 to 19 minutes (% change since 2000)
Travel time to work - 20 to 29 minutes (%)
Travel time to work - 20 to 29 minutes (% change since 2000)
Travel time to work - 30 to 39 minutes (%)
Travel time to work - 30 to 39 minutes (% change since 2000)
Travel time to work - 40 to 59 minutes (%)
Travel time to work - 40 to 59 minutes (% change since 2000)
Travel time to work - 60 to 89 minutes (%)
Travel time to work - 60 to 89 minutes (% change since 2000)
Travel time to work - 90 or more minutes (%)
Travel time to work - 90 or more minutes (% change since 2000)
Marital status - Never married (%)
Marital status - Now married (%)
Marital status - Separated (%)
Marital status - Widowed (%)
Marital status - Divorced (%)
Median family income ($)
Median family income (% change since 2000)
Median non-family income ($)
Median non-family income (% change since 2000)
Median per capita income ($)
Median per capita income (% change since 2000)
Median family income ($) - White
Median family income ($) - Black or African American
Median family income ($) - Asian
Median family income ($) - Hispanic or Latino
Median family income ($) - American Indian and Alaska Native
Median family income ($) - Multirace
Median family income ($) - Other Race
Median year house/condo built
Median year apartment built
Year house built - Built 2005 or later (%)
Year house built - Built 2000 to 2004 (%)
Year house built - Built 1990 to 1999 (%)
Year house built - Built 1980 to 1989 (%)
Year house built - Built 1970 to 1979 (%)
Year house built - Built 1960 to 1969 (%)
Year house built - Built 1950 to 1959 (%)
Year house built - Built 1940 to 1949 (%)
Year house built - Built 1939 or earlier (%)
Average household size
Household density (households per square mile)
Average household size - White
Average household size - Black or African American
Average household size - Asian
Average household size - Hispanic or Latino
Average household size - American Indian and Alaska Native
Average household size - Multirace
Average household size - Other Race
Occupied housing units (%)
Vacant housing units (%)
Owner occupied housing units (%)
Renter occupied housing units (%)
Vacancy status - For rent (%)
Vacancy status - For sale only (%)
Vacancy status - Rented or sold, not occupied (%)
Vacancy status - For seasonal, recreational, or occasional use (%)
Vacancy status - For migrant workers (%)
Vacancy status - Other vacant (%)
Residents with income below the poverty level (%)
Residents with income below 50% of the poverty level (%)
Children below poverty level (%)
Poor families by family type - Married-couple family (%)
Poor families by family type - Male, no wife present (%)
Poor families by family type - Female, no husband present (%)
Poverty status for native-born residents (%)
Poverty status for foreign-born residents (%)
Poverty among high school graduates not in families (%)
Poverty among people who did not graduate high school not in families (%)
Residents with income below the poverty level (%) - White
Residents with income below the poverty level (%) - Black or African American
Residents with income below the poverty level (%) - Asian
Residents with income below the poverty level (%) - Hispanic or Latino
Residents with income below the poverty level (%) - American Indian and Alaska Native
Residents with income below the poverty level (%) - Multirace
Residents with income below the poverty level (%) - Other Race
Air pollution - Air Quality Index (AQI)
Air pollution - CO
Air pollution - NO2
Air pollution - SO2
Air pollution - Ozone
Air pollution - PM10
Air pollution - PM25
Air pollution - Pb
Crime - Murders per 100,000 population
Crime - Rapes per 100,000 population
Crime - Robberies per 100,000 population
Crime - Assaults per 100,000 population
Crime - Burglaries per 100,000 population
Crime - Thefts per 100,000 population
Crime - Auto thefts per 100,000 population
Crime - Arson per 100,000 population
Crime - City-data.com crime index
Crime - Violent crime index
Crime - Property crime index
Crime - Murders per 100,000 population (5 year average)
Crime - Rapes per 100,000 population (5 year average)
Crime - Robberies per 100,000 population (5 year average)
Crime - Assaults per 100,000 population (5 year average)
Crime - Burglaries per 100,000 population (5 year average)
Crime - Thefts per 100,000 population (5 year average)
Crime - Auto thefts per 100,000 population (5 year average)
Crime - Arson per 100,000 population (5 year average)
Crime - City-data.com crime index (5 year average)
Crime - Violent crime index (5 year average)
Crime - Property crime index (5 year average)
1996 Presidential Elections Results (%) - Democratic Party (Clinton)
1996 Presidential Elections Results (%) - Republican Party (Dole)
1996 Presidential Elections Results (%) - Other
2000 Presidential Elections Results (%) - Democratic Party (Gore)
2000 Presidential Elections Results (%) - Republican Party (Bush)
2000 Presidential Elections Results (%) - Other
2004 Presidential Elections Results (%) - Democratic Party (Kerry)
2004 Presidential Elections Results (%) - Republican Party (Bush)
2004 Presidential Elections Results (%) - Other
2008 Presidential Elections Results (%) - Democratic Party (Obama)
2008 Presidential Elections Results (%) - Republican Party (McCain)
2008 Presidential Elections Results (%) - Other
2012 Presidential Elections Results (%) - Democratic Party (Obama)
2012 Presidential Elections Results (%) - Republican Party (Romney)
2012 Presidential Elections Results (%) - Other
2016 Presidential Elections Results (%) - Democratic Party (Clinton)
2016 Presidential Elections Results (%) - Republican Party (Trump)
2016 Presidential Elections Results (%) - Other
2020 Presidential Elections Results (%) - Democratic Party (Biden)
2020 Presidential Elections Results (%) - Republican Party (Trump)
2020 Presidential Elections Results (%) - Other
Ancestries Reported - Arab (%)
Ancestries Reported - Czech (%)
Ancestries Reported - Danish (%)
Ancestries Reported - Dutch (%)
Ancestries Reported - English (%)
Ancestries Reported - French (%)
Ancestries Reported - French Canadian (%)
Ancestries Reported - German (%)
Ancestries Reported - Greek (%)
Ancestries Reported - Hungarian (%)
Ancestries Reported - Irish (%)
Ancestries Reported - Italian (%)
Ancestries Reported - Lithuanian (%)
Ancestries Reported - Norwegian (%)
Ancestries Reported - Polish (%)
Ancestries Reported - Portuguese (%)
Ancestries Reported - Russian (%)
Ancestries Reported - Scotch-Irish (%)
Ancestries Reported - Scottish (%)
Ancestries Reported - Slovak (%)
Ancestries Reported - Subsaharan African (%)
Ancestries Reported - Swedish (%)
Ancestries Reported - Swiss (%)
Ancestries Reported - Ukrainian (%)
Ancestries Reported - United States (%)
Ancestries Reported - Welsh (%)
Ancestries Reported - West Indian (%)
Ancestries Reported - Other (%)
Educational Attainment - No schooling completed (%)
Educational Attainment - Less than high school (%)
Educational Attainment - High school or equivalent (%)
Educational Attainment - Less than 1 year of college (%)
Educational Attainment - 1 or more years of college (%)
Educational Attainment - Associate degree (%)
Educational Attainment - Bachelor's degree (%)
Educational Attainment - Master's degree (%)
Educational Attainment - Professional school degree (%)
Educational Attainment - Doctorate degree (%)
School Enrollment - Nursery, preschool (%)
School Enrollment - Kindergarten (%)
School Enrollment - Grade 1 to 4 (%)
School Enrollment - Grade 5 to 8 (%)
School Enrollment - Grade 9 to 12 (%)
School Enrollment - College undergrad (%)
School Enrollment - Graduate or professional (%)
School Enrollment - Not enrolled in school (%)
School enrollment - Public schools (%)
School enrollment - Private schools (%)
School enrollment - Not enrolled (%)
Median number of rooms in houses and condos
Median number of rooms in apartments
Housing units lacking complete plumbing facilities (%)
Housing units lacking complete kitchen facilities (%)
Density of houses
Urban houses (%)
Rural houses (%)
Households with people 60 years and over (%)
Households with people 65 years and over (%)
Households with people 75 years and over (%)
Households with one or more nonrelatives (%)
Households with no nonrelatives (%)
Population in households (%)
Family households (%)
Nonfamily households (%)
Population in families (%)
Family households with own children (%)
Median number of bedrooms in owner occupied houses
Mean number of bedrooms in owner occupied houses
Median number of bedrooms in renter occupied houses
Mean number of bedrooms in renter occupied houses
Median number of vehichles in owner occupied houses
Mean number of vehichles in owner occupied houses
Median number of vehichles in renter occupied houses
Mean number of vehichles in renter occupied houses
Mortgage status - with mortgage (%)
Mortgage status - with second mortgage (%)
Mortgage status - with home equity loan (%)
Mortgage status - with both second mortgage and home equity loan (%)
Mortgage status - without a mortgage (%)
Average family size
Average family size - White
Average family size - Black or African American
Average family size - Asian
Average family size - Hispanic or Latino
Average family size - American Indian and Alaska Native
Average family size - Multirace
Average family size - Other Race
Geographical mobility - Same house 1 year ago (%)
Geographical mobility - Moved within same county (%)
Geographical mobility - Moved from different county within same state (%)
Geographical mobility - Moved from different state (%)
Geographical mobility - Moved from abroad (%)
Place of birth - Born in state of residence (%)
Place of birth - Born in other state (%)
Place of birth - Native, outside of US (%)
Place of birth - Foreign born (%)
Housing units in structures - 1, detached (%)
Housing units in structures - 1, attached (%)
Housing units in structures - 2 (%)
Housing units in structures - 3 or 4 (%)
Housing units in structures - 5 to 9 (%)
Housing units in structures - 10 to 19 (%)
Housing units in structures - 20 to 49 (%)
Housing units in structures - 50 or more (%)
Housing units in structures - Mobile home (%)
Housing units in structures - Boat, RV, van, etc. (%)
House/condo owner moved in on average (years ago)
Renter moved in on average (years ago)
Year householder moved into unit - Moved in 1999 to March 2000 (%)
Year householder moved into unit - Moved in 1995 to 1998 (%)
Year householder moved into unit - Moved in 1990 to 1994 (%)
Year householder moved into unit - Moved in 1980 to 1989 (%)
Year householder moved into unit - Moved in 1970 to 1979 (%)
Year householder moved into unit - Moved in 1969 or earlier (%)
Means of transportation to work - Drove car alone (%)
Means of transportation to work - Carpooled (%)
Means of transportation to work - Public transportation (%)
Means of transportation to work - Bus or trolley bus (%)
Means of transportation to work - Streetcar or trolley car (%)
Means of transportation to work - Subway or elevated (%)
Means of transportation to work - Railroad (%)
Means of transportation to work - Ferryboat (%)
Means of transportation to work - Taxicab (%)
Means of transportation to work - Motorcycle (%)
Means of transportation to work - Bicycle (%)
Means of transportation to work - Walked (%)
Means of transportation to work - Other means (%)
Working at home (%)
Industry diversity
Most Common Industries - Agriculture, forestry, fishing and hunting, and mining (%)
Most Common Industries - Agriculture, forestry, fishing and hunting (%)
Most Common Industries - Mining, quarrying, and oil and gas extraction (%)
Most Common Industries - Construction (%)
Most Common Industries - Manufacturing (%)
Most Common Industries - Wholesale trade (%)
Most Common Industries - Retail trade (%)
Most Common Industries - Transportation and warehousing, and utilities (%)
Most Common Industries - Transportation and warehousing (%)
Most Common Industries - Utilities (%)
Most Common Industries - Information (%)
Most Common Industries - Finance and insurance, and real estate and rental and leasing (%)
Most Common Industries - Finance and insurance (%)
Most Common Industries - Real estate and rental and leasing (%)
Most Common Industries - Professional, scientific, and management, and administrative and waste management services (%)
Most Common Industries - Professional, scientific, and technical services (%)
Most Common Industries - Management of companies and enterprises (%)
Most Common Industries - Administrative and support and waste management services (%)
Most Common Industries - Educational services, and health care and social assistance (%)
Most Common Industries - Educational services (%)
Most Common Industries - Health care and social assistance (%)
Most Common Industries - Arts, entertainment, and recreation, and accommodation and food services (%)
Most Common Industries - Arts, entertainment, and recreation (%)
Most Common Industries - Accommodation and food services (%)
Most Common Industries - Other services, except public administration (%)
Most Common Industries - Public administration (%)
Occupation diversity
Most Common Occupations - Management, business, science, and arts occupations (%)
Most Common Occupations - Management, business, and financial occupations (%)
Most Common Occupations - Management occupations (%)
Most Common Occupations - Business and financial operations occupations (%)
Most Common Occupations - Computer, engineering, and science occupations (%)
Most Common Occupations - Computer and mathematical occupations (%)
Most Common Occupations - Architecture and engineering occupations (%)
Most Common Occupations - Life, physical, and social science occupations (%)
Most Common Occupations - Education, legal, community service, arts, and media occupations (%)
Most Common Occupations - Community and social service occupations (%)
Most Common Occupations - Legal occupations (%)
Most Common Occupations - Education, training, and library occupations (%)
Most Common Occupations - Arts, design, entertainment, sports, and media occupations (%)
Most Common Occupations - Healthcare practitioners and technical occupations (%)
Most Common Occupations - Health diagnosing and treating practitioners and other technical occupations (%)
Most Common Occupations - Health technologists and technicians (%)
Most Common Occupations - Service occupations (%)
Most Common Occupations - Healthcare support occupations (%)
Most Common Occupations - Protective service occupations (%)
Most Common Occupations - Fire fighting and prevention, and other protective service workers including supervisors (%)
Most Common Occupations - Law enforcement workers including supervisors (%)
Most Common Occupations - Food preparation and serving related occupations (%)
Most Common Occupations - Building and grounds cleaning and maintenance occupations (%)
Most Common Occupations - Personal care and service occupations (%)
Most Common Occupations - Sales and office occupations (%)
Most Common Occupations - Sales and related occupations (%)
Most Common Occupations - Office and administrative support occupations (%)
Most Common Occupations - Natural resources, construction, and maintenance occupations (%)
Most Common Occupations - Farming, fishing, and forestry occupations (%)
Most Common Occupations - Construction and extraction occupations (%)
Most Common Occupations - Installation, maintenance, and repair occupations (%)
Most Common Occupations - Production, transportation, and material moving occupations (%)
Most Common Occupations - Production occupations (%)
Most Common Occupations - Transportation occupations (%)
Most Common Occupations - Material moving occupations (%)
People in Group quarters - Institutionalized population (%)
People in Group quarters - Correctional institutions (%)
People in Group quarters - Federal prisons and detention centers (%)
People in Group quarters - Halfway houses (%)
People in Group quarters - Local jails and other confinement facilities (including police lockups) (%)
People in Group quarters - Military disciplinary barracks (%)
People in Group quarters - State prisons (%)
People in Group quarters - Other types of correctional institutions (%)
People in Group quarters - Nursing homes (%)
People in Group quarters - Hospitals/wards, hospices, and schools for the handicapped (%)
People in Group quarters - Hospitals/wards and hospices for chronically ill (%)
People in Group quarters - Hospices or homes for chronically ill (%)
People in Group quarters - Military hospitals or wards for chronically ill (%)
People in Group quarters - Other hospitals or wards for chronically ill (%)
People in Group quarters - Hospitals or wards for drug/alcohol abuse (%)
People in Group quarters - Mental (Psychiatric) hospitals or wards (%)
People in Group quarters - Schools, hospitals, or wards for the mentally retarded (%)
People in Group quarters - Schools, hospitals, or wards for the physically handicapped (%)
People in Group quarters - Institutions for the deaf (%)
People in Group quarters - Institutions for the blind (%)
People in Group quarters - Orthopedic wards and institutions for the physically handicapped (%)
People in Group quarters - Wards in general hospitals for patients who have no usual home elsewhere (%)
People in Group quarters - Wards in military hospitals for patients who have no usual home elsewhere (%)
People in Group quarters - Juvenile institutions (%)
People in Group quarters - Long-term care (%)
People in Group quarters - Homes for abused, dependent, and neglected children (%)
People in Group quarters - Residential treatment centers for emotionally disturbed children (%)
People in Group quarters - Training schools for juvenile delinquents (%)
People in Group quarters - Short-term care, detention or diagnostic centers for delinquent children (%)
People in Group quarters - Type of juvenile institution unknown (%)
People in Group quarters - Noninstitutionalized population (%)
People in Group quarters - College dormitories (includes college quarters off campus) (%)
People in Group quarters - Military quarters (%)
People in Group quarters - On base (%)
People in Group quarters - Barracks, unaccompanied personnel housing (UPH), (Enlisted/Officer), ;and similar group living quarters for military personnel (%)
People in Group quarters - Transient quarters for temporary residents (%)
People in Group quarters - Military ships (%)
People in Group quarters - Group homes (%)
People in Group quarters - Homes or halfway houses for drug/alcohol abuse (%)
People in Group quarters - Homes for the mentally ill (%)
People in Group quarters - Homes for the mentally retarded (%)
People in Group quarters - Homes for the physically handicapped (%)
People in Group quarters - Other group homes (%)
People in Group quarters - Religious group quarters (%)
People in Group quarters - Dormitories (%)
People in Group quarters - Agriculture workers' dormitories on farms (%)
People in Group quarters - Job Corps and vocational training facilities (%)
People in Group quarters - Other workers' dormitories (%)
People in Group quarters - Crews of maritime vessels (%)
People in Group quarters - Other nonhousehold living situations (%)
People in Group quarters - Other noninstitutional group quarters (%)
Residents speaking English at home (%)
Residents speaking English at home - Born in the United States (%)
Residents speaking English at home - Native, born elsewhere (%)
Residents speaking English at home - Foreign born (%)
Residents speaking Spanish at home (%)
Residents speaking Spanish at home - Born in the United States (%)
Residents speaking Spanish at home - Native, born elsewhere (%)
Residents speaking Spanish at home - Foreign born (%)
Residents speaking other language at home (%)
Residents speaking other language at home - Born in the United States (%)
Residents speaking other language at home - Native, born elsewhere (%)
Residents speaking other language at home - Foreign born (%)
Class of Workers - Employee of private company (%)
Class of Workers - Self-employed in own incorporated business (%)
Class of Workers - Private not-for-profit wage and salary workers (%)
Class of Workers - Local government workers (%)
Class of Workers - State government workers (%)
Class of Workers - Federal government workers (%)
Class of Workers - Self-employed workers in own not incorporated business and Unpaid family workers (%)
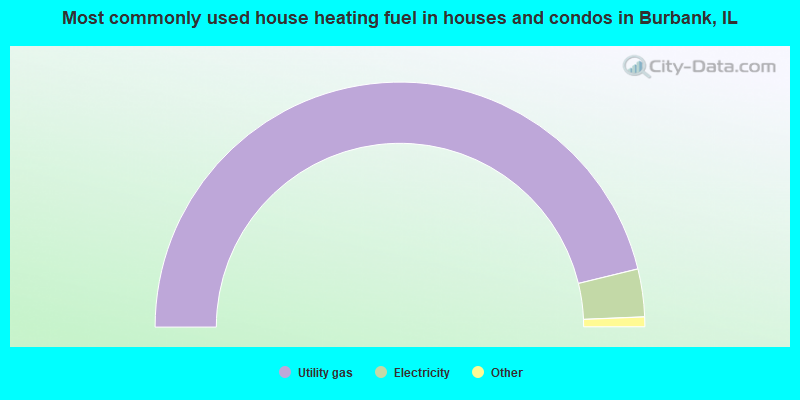
House heating fuel used in houses and condos - Utility gas (%)
House heating fuel used in houses and condos - Bottled, tank, or LP gas (%)
House heating fuel used in houses and condos - Electricity (%)
House heating fuel used in houses and condos - Fuel oil, kerosene, etc. (%)
House heating fuel used in houses and condos - Coal or coke (%)
House heating fuel used in houses and condos - Wood (%)
House heating fuel used in houses and condos - Solar energy (%)
House heating fuel used in houses and condos - Other fuel (%)
House heating fuel used in houses and condos - No fuel used (%)
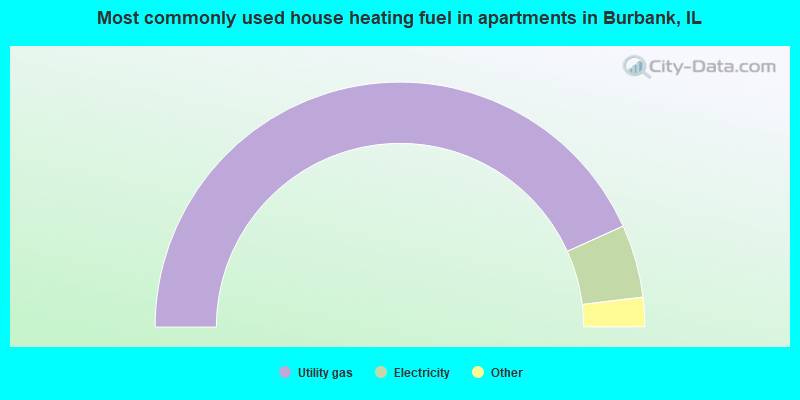
House heating fuel used in apartments - Utility gas (%)
House heating fuel used in apartments - Bottled, tank, or LP gas (%)
House heating fuel used in apartments - Electricity (%)
House heating fuel used in apartments - Fuel oil, kerosene, etc. (%)
House heating fuel used in apartments - Coal or coke (%)
House heating fuel used in apartments - Wood (%)
House heating fuel used in apartments - Solar energy (%)
House heating fuel used in apartments - Other fuel (%)
House heating fuel used in apartments - No fuel used (%)
Armed forces status - In Armed Forces (%)
Armed forces status - Civilian (%)
Armed forces status - Civilian - Veteran (%)
Armed forces status - Civilian - Nonveteran (%)
Fatal accidents locations in years 2005-2021
Fatal accidents locations in 2005
Fatal accidents locations in 2006
Fatal accidents locations in 2007
Fatal accidents locations in 2008
Fatal accidents locations in 2009
Fatal accidents locations in 2010
Fatal accidents locations in 2011
Fatal accidents locations in 2012
Fatal accidents locations in 2013
Fatal accidents locations in 2014
Fatal accidents locations in 2015
Fatal accidents locations in 2016
Fatal accidents locations in 2017
Fatal accidents locations in 2018
Fatal accidents locations in 2019
Fatal accidents locations in 2020
Fatal accidents locations in 2021
Alcohol use - People drinking some alcohol every month (%)
Alcohol use - People not drinking at all (%)
Alcohol use - Average days/month drinking alcohol
Alcohol use - Average drinks/week
Alcohol use - Average days/year people drink much
Audiometry - Average condition of hearing (%)
Audiometry - People that can hear a whisper from across a quiet room (%)
Audiometry - People that can hear normal voice from across a quiet room (%)
Audiometry - Ears ringing, roaring, buzzing (%)
Audiometry - Had a job exposure to loud noise (%)
Audiometry - Had off-work exposure to loud noise (%)
Blood Pressure & Cholesterol - Has high blood pressure (%)
Blood Pressure & Cholesterol - Checking blood pressure at home (%)
Blood Pressure & Cholesterol - Frequently checking blood cholesterol (%)
Blood Pressure & Cholesterol - Has high cholesterol level (%)
Consumer Behavior - Money monthly spent on food at supermarket/grocery store
Consumer Behavior - Money monthly spent on food at other stores
Consumer Behavior - Money monthly spent on eating out
Consumer Behavior - Money monthly spent on carryout/delivered foods
Consumer Behavior - Income spent on food at supermarket/grocery store (%)
Consumer Behavior - Income spent on food at other stores (%)
Consumer Behavior - Income spent on eating out (%)
Consumer Behavior - Income spent on carryout/delivered foods (%)
Current Health Status - General health condition (%)
Current Health Status - Blood donors (%)
Current Health Status - Has blood ever tested for HIV virus (%)
Current Health Status - Left-handed people (%)
Dermatology - People using sunscreen (%)
Diabetes - Diabetics (%)
Diabetes - Had a blood test for high blood sugar (%)
Diabetes - People taking insulin (%)
Diet Behavior & Nutrition - Diet health (%)
Diet Behavior & Nutrition - Milk product consumption (# of products/month)
Diet Behavior & Nutrition - Meals not home prepared (#/week)
Diet Behavior & Nutrition - Meals from fast food or pizza place (#/week)
Diet Behavior & Nutrition - Ready-to-eat foods (#/month)
Diet Behavior & Nutrition - Frozen meals/pizza (#/month)
Drug Use - People that ever used marijuana or hashish (%)
Drug Use - Ever used hard drugs (%)
Drug Use - Ever used any form of cocaine (%)
Drug Use - Ever used heroin (%)
Drug Use - Ever used methamphetamine (%)
Health Insurance - People covered by health insurance (%)
Kidney Conditions-Urology - Avg. # of times urinating at night
Medical Conditions - People with asthma (%)
Medical Conditions - People with anemia (%)
Medical Conditions - People with psoriasis (%)
Medical Conditions - People with overweight (%)
Medical Conditions - Elderly people having difficulties in thinking or remembering (%)
Medical Conditions - People who ever received blood transfusion (%)
Medical Conditions - People having trouble seeing even with glass/contacts (%)
Medical Conditions - People with arthritis (%)
Medical Conditions - People with gout (%)
Medical Conditions - People with congestive heart failure (%)
Medical Conditions - People with coronary heart disease (%)
Medical Conditions - People with angina pectoris (%)
Medical Conditions - People who ever had heart attack (%)
Medical Conditions - People who ever had stroke (%)
Medical Conditions - People with emphysema (%)
Medical Conditions - People with thyroid problem (%)
Medical Conditions - People with chronic bronchitis (%)
Medical Conditions - People with any liver condition (%)
Medical Conditions - People who ever had cancer or malignancy (%)
Mental Health - People who have little interest in doing things (%)
Mental Health - People feeling down, depressed, or hopeless (%)
Mental Health - People who have trouble sleeping or sleeping too much (%)
Mental Health - People feeling tired or having little energy (%)
Mental Health - People with poor appetite or overeating (%)
Mental Health - People feeling bad about themself (%)
Mental Health - People who have trouble concentrating on things (%)
Mental Health - People moving or speaking slowly or too fast (%)
Mental Health - People having thoughts they would be better off dead (%)
Oral Health - Average years since last visit a dentist
Oral Health - People embarrassed because of mouth (%)
Oral Health - People with gum disease (%)
Oral Health - General health of teeth and gums (%)
Oral Health - Average days a week using dental floss/device
Oral Health - Average days a week using mouthwash for dental problem
Oral Health - Average number of teeth
Pesticide Use - Households using pesticides to control insects (%)
Pesticide Use - Households using pesticides to kill weeds (%)
Physical Activity - People doing vigorous-intensity work activities (%)
Physical Activity - People doing moderate-intensity work activities (%)
Physical Activity - People walking or bicycling (%)
Physical Activity - People doing vigorous-intensity recreational activities (%)
Physical Activity - People doing moderate-intensity recreational activities (%)
Physical Activity - Average hours a day doing sedentary activities
Physical Activity - Average hours a day watching TV or videos
Physical Activity - Average hours a day using computer
Physical Functioning - People having limitations keeping them from working (%)
Physical Functioning - People limited in amount of work they can do (%)
Physical Functioning - People that need special equipment to walk (%)
Physical Functioning - People experiencing confusion/memory problems (%)
Physical Functioning - People requiring special healthcare equipment (%)
Prescription Medications - Average number of prescription medicines taking
Preventive Aspirin Use - Adults 40+ taking low-dose aspirin (%)
Reproductive Health - Vaginal deliveries (%)
Reproductive Health - Cesarean deliveries (%)
Reproductive Health - Deliveries resulted in a live birth (%)
Reproductive Health - Pregnancies resulted in a delivery (%)
Reproductive Health - Women breastfeeding newborns (%)
Reproductive Health - Women that had a hysterectomy (%)
Reproductive Health - Women that had both ovaries removed (%)
Reproductive Health - Women that have ever taken birth control pills (%)
Reproductive Health - Women taking birth control pills (%)
Reproductive Health - Women that have ever used Depo-Provera or injectables (%)
Reproductive Health - Women that have ever used female hormones (%)
Sexual Behavior - People 18+ that ever had sex (vaginal, anal, or oral) (%)
Sexual Behavior - Males 18+ that ever had vaginal sex with a woman (%)
Sexual Behavior - Males 18+ that ever performed oral sex on a woman (%)
Sexual Behavior - Males 18+ that ever had anal sex with a woman (%)
Sexual Behavior - Males 18+ that ever had any sex with a man (%)
Sexual Behavior - Females 18+ that ever had vaginal sex with a man (%)
Sexual Behavior - Females 18+ that ever performed oral sex on a man (%)
Sexual Behavior - Females 18+ that ever had anal sex with a man (%)
Sexual Behavior - Females 18+ that ever had any kind of sex with a woman (%)
Sexual Behavior - Average age people first had sex
Sexual Behavior - Average number of female sex partners in lifetime (males 18+)
Sexual Behavior - Average number of female vaginal sex partners in lifetime (males 18+)
Sexual Behavior - Average age people first performed oral sex on a woman (18+)
Sexual Behavior - Average number of woman performed oral sex on in lifetime (18+)
Sexual Behavior - Average number of male sex partners in lifetime (males 18+)
Sexual Behavior - Average number of male anal sex partners in lifetime (males 18+)
Sexual Behavior - Average age people first performed oral sex on a man (18+)
Sexual Behavior - Average number of male oral sex partners in lifetime (18+)
Sexual Behavior - People using protection when performing oral sex (%)
Sexual Behavior - Average number of times people have vaginal or anal sex a year
Sexual Behavior - People having sex without condom (%)
Sexual Behavior - Average number of male sex partners in lifetime (females 18+)
Sexual Behavior - Average number of male vaginal sex partners in lifetime (females 18+)
Sexual Behavior - Average number of female sex partners in lifetime (females 18+)
Sexual Behavior - Circumcised males 18+ (%)
Sleep Disorders - Average hours sleeping at night
Sleep Disorders - People that has trouble sleeping (%)
Smoking-Cigarette Use - People smoking cigarettes (%)
Taste & Smell - People 40+ having problems with smell (%)
Taste & Smell - People 40+ having problems with taste (%)
Taste & Smell - People 40+ that ever had wisdom teeth removed (%)
Taste & Smell - People 40+ that ever had tonsils teeth removed (%)
Taste & Smell - People 40+ that ever had a loss of consciousness because of a head injury (%)
Taste & Smell - People 40+ that ever had a broken nose or other serious injury to face or skull (%)
Taste & Smell - People 40+ that ever had two or more sinus infections (%)
Weight - Average height (inches)
Weight - Average weight (pounds)
Weight - Average BMI
Weight - People that are obese (%)
Weight - People that ever were obese (%)
Weight - People trying to lose weight (%)
According to our research of Illinois and other state lists, there were 16 registered sex offenders living in Burbank, Illinois as of April 27, 2024 . The ratio of all residents to sex offenders in Burbank is 1,810 to 1.The ratio of registered sex offenders to all residents in this city is lower than the state average.
Officers per 1,000 residents here:
1.44Illinois average:
2.84
Latest news from Burbank, IL collected exclusively by city-data.com from local newspapers, TV, and radio stations
Ancestries: Polish (18.7%), Palestinian (2.6%), Italian (1.9%), Irish (1.9%), American (1.7%), German (1.6%).
Current Local Time:
Incorporated on 07/10/1970
Land area: 4.17 square miles.
Population density: 6,814 people per square mile (high).
8,550 residents are foreign born (15.6% Latin America , 9.5% Europe , 4.2% Asia ).
This city:
30.0%Illinois:
14.1%
Median real estate property taxes paid for housing units with mortgages in 2022: $5,388 (2.1%)Median real estate property taxes paid for housing units with no mortgage in 2022: $5,391 (2.0%)
Nearest city with pop. 50,000+: Oak Lawn, IL
Nearest city with pop. 200,000+: Chicago, IL
Nearest cities:
Latitude: 41.74 N, Longitude: 87.77 W
Daytime population change due to commuting: -6,982 (-24.5%)Workers who live and work in this city: 1,602 (12.3%)
Single-family new house construction building permits:
2022: 8 buildings , average cost: $199,1002021: 11 buildings , average cost: $196,9002020: 12 buildings , average cost: $206,0002019: 6 buildings , average cost: $155,8002018: 8 buildings , average cost: $166,1002017: 15 buildings , average cost: $158,6002016: 9 buildings , average cost: $133,9002015: 12 buildings , average cost: $144,3002014: 14 buildings , average cost: $117,0002013: 14 buildings , average cost: $125,6002012: 8 buildings , average cost: $123,8002011: 9 buildings , average cost: $143,3002010: 8 buildings , average cost: $125,6002008: 34 buildings , average cost: $191,4002007: 56 buildings , average cost: $191,1002006: 82 buildings , average cost: $192,4002005: 127 buildings , average cost: $190,3002004: 76 buildings , average cost: $187,9002003: 78 buildings , average cost: $126,6002002: 75 buildings , average cost: $122,6002001: 54 buildings , average cost: $96,1002000: 48 buildings , average cost: $110,8001999: 48 buildings , average cost: $100,0001998: 31 buildings , average cost: $109,4001997: 32 buildings , average cost: $99,600Unemployment in December 2023: Population change in the 1990s: +354 (+1.3%).
Most common occupations in Burbank, IL (%)
Both Males Females
Other production occupations, including supervisors (6.1%)
Driver/sales workers and truck drivers (5.5%)
Other office and administrative support workers, including supervisors (5.2%)
Building and grounds cleaning and maintenance occupations (4.7%)
Laborers and material movers, hand (4.1%)
Material recording, scheduling, dispatching, and distributing workers (4.0%)
Secretaries and administrative assistants (3.7%)
Driver/sales workers and truck drivers (9.9%)
Other production occupations, including supervisors (7.3%)
Electrical equipment mechanics and other installation, maintenance, and repair workers, including supervisors (5.8%)
Laborers and material movers, hand (5.7%)
Metal workers and plastic workers (5.0%)
Material recording, scheduling, dispatching, and distributing workers (4.8%)
Vehicle and mobile equipment mechanics, installers, and repairers (4.8%)
Other office and administrative support workers, including supervisors (8.9%)
Secretaries and administrative assistants (8.3%)
Building and grounds cleaning and maintenance occupations (5.5%)
Cashiers (4.8%)
Other production occupations, including supervisors (4.5%)
Customer service representatives (3.8%)
Information and record clerks, except customer service representatives (3.7%)
Tornado activity:
Burbank-area historical tornado activity is near Illinois state average. It is 52% greater than the overall U.S. average.
On 8/28/1990, a category F5 (max. wind speeds 261-318 mph) tornado 23.0 miles away from the Burbank city center killed 29 people and injured 350 people and caused between $50,000 and $500,000 in damages.
On 4/21/1967, a category F4 (max. wind speeds 207-260 mph) tornado 6.0 miles away from the city center killed 33 people and injured 500 people and caused between $5,000,000 and $50,000,000 in damages.
Earthquake activity:
Burbank-area historical earthquake activity is significantly above Illinois state average. It is 42% greater than the overall U.S. average. On 4/18/2008 at 09:36:59, a magnitude 5.4 (5.1 MB, 4.8 MS, 5.4 MW, 5.2 MW, Class: Moderate, Intensity: VI - VII) earthquake occurred 227.8 miles away from Burbank center On 6/10/1987 at 23:48:54, a magnitude 5.1 (4.9 MB, 4.4 MS, 4.6 MS, 5.1 LG) earthquake occurred 202.3 miles away from the city center On 4/18/2008 at 09:36:59, a magnitude 5.2 (5.2 MW, Depth: 8.9 mi) earthquake occurred 227.8 miles away from the city center On 6/28/2004 at 06:10:52, a magnitude 4.2 (4.2 MW, Depth: 6.2 mi, Class: Light, Intensity: IV - V) earthquake occurred 61.6 miles away from Burbank center On 6/18/2002 at 17:37:15, a magnitude 5.0 (4.3 MB, 4.6 MW, 5.0 LG) earthquake occurred 259.9 miles away from Burbank center On 4/18/2008 at 15:14:16, a magnitude 4.8 (4.5 MB, 4.8 MW, 4.6 MW) earthquake occurred 226.1 miles away from the city center Magnitude types: regional Lg-wave magnitude (LG), body-wave magnitude (MB), surface-wave magnitude (MS), moment magnitude (MW) Natural disasters: The number of natural disasters in Cook County (20) is greater than the US average (15).Major Disasters (Presidential) Declared: 15Emergencies Declared: 4Floods: 13, Storms: 12, Tornadoes: 3, Snowstorms: 2, Winter Storms: 2, Blizzard: 1, Hurricane: 1, Snow: 1, Wind: 1, Other: 1 (Note: some incidents may be assigned to more than one category). Hospitals and medical centers in Burbank: GARDEN CENTER SERVICES (8345 SOUTH AUSTIN AVENUE) BRENTWOOD SUB-ACUTE HEALTHCARE CENTER (5400 WEST 87TH STREET)
EXCEPTIONAL CARE, LLC (5701 WEST 79TH STREET)
SUNSET HOUSE (5701 W 79TH ST)
FMC-DIALYSIS SERVICES OF BURBANK (4811 W 77TH ST)
Amtrak stations near Burbank: 4 miles: SUMMIT (ARCHER & CENTER AVE.) Services: public payphones, free short-term parking, free long-term parking, call for taxi service, public transit connection.
8 miles: LA GRANGE ROAD (LA GRANGE, 25 W. BURLINGTON AVE.) Services: enclosed waiting area, public payphones, taxi stand, public transit connection.
12 miles: CHICAGO (225 S. CANAL ST.) Services: ticket office, partially wheelchair accessible, enclosed waiting area, public restrooms, public payphones, snack bar, paid short-term parking, paid long-term parking, call for car rental service, taxi stand, public transit connection.
Colleges/universities with over 2000 students nearest to Burbank:
City Colleges of Chicago-Richard J Daley College (about 3 miles; Chicago, IL ; Full-time enrollment: 7,497)
Saint Xavier University (about 4 miles; Chicago, IL ; FT enrollment: 3,576)
Moraine Valley Community College (about 5 miles; Palos Hills, IL ; FT enrollment: 12,008)
Morton College (about 6 miles; Cicero, IL ; FT enrollment: 3,236)
City Colleges of Chicago-Kennedy-King College (about 8 miles; Chicago, IL ; FT enrollment: 5,044)
Chicago State University (about 9 miles; Chicago, IL ; FT enrollment: 4,352)
University of Chicago (about 10 miles; Chicago, IL ; FT enrollment: 11,506)
Public high school in Burbank:
Private high schools in Burbank: ST LAURENCE HIGH SCHOOL Students: 598, Location: 5556 W 77TH ST, Grades: 9-12, Boys only )
QUEEN OF PEACE HIGH SCHOOL Students: 361, Location: 7659 LINDER AVE, Grades: 9-12, Girls only )
JORDAN BAPTIST SCHOOL Students: 91, Location: 5040 W 87TH ST, Grades: KG-12)
Public elementary/middle schools in Burbank: LIBERTY JUNIOR HIGH SCHOOL Students: 764, Location: 5900 W 81ST ST, Grades: 7-8)LUTHER BURBANK ELEM SCHOOL Students: 497, Location: 8235 LINDER AVE, Grades: KG-6)J B KENNEDY ELEM SCHOOL Students: 426, Location: 7644 CENTRAL AVE, Grades: KG-6)MADDOCK ELEMENTARY SCHOOL Students: 418, Location: 8258 SAYRE AVE, Grades: PK-6)EDWARD J TOBIN ELEM SCHOOL Students: 367, Location: 8501 NARRAGANSETT AVE, Grades: KG-6)F B MCCORD ELEM SCHOOL Students: 356, Location: 8450 NASHVILLE AVE, Grades: PK-6)RICHARD BYRD ELEMENTARY SCHOOL Students: 302, Location: 8259 LAVERGNE AVE, Grades: KG-6)HARRY E FRY SCHOOL Location: 7805 MOBILE AVE, Grades: KG-6)
Private elementary/middle school in Burbank: ST ALBERT THE GREAT SCHOOL Students: 171, Location: 5535 STATE RD, Grades: PK-8)
See full list of schools located in Burbank Library in Burbank: PRAIRIE TRAILS PUBLIC LIBRARY DISTRICT Operating income: $1,515,870; Location: 8449 SOUTH MOODY AVENUE; 76,779 books ; 3,555 audio materials ; 3,171 video materials ; 18 local licensed databases ; 3 state licensed databases ; 14 other licensed databases ; 161 print serial subscriptions ; 1 electronic serial subscriptions )
User-submitted facts and corrections:
Liberty Junior high School
Notable locations in Burbank: (A) , Burbank Fire Department Station 1 (B) , Burbank City Hall (C) , Prairie Trails Public Library (D) . Display/hide their locations on the map
Shopping Center: (1) . Display/hide its location on the map
Churches in Burbank include: (A) , Burbank Baptist Temple (B) , Church of Christ (C) , Church of Gods Prophecy (D) , Community Church of God (E) , First Baptist Church of Burbank (F) , Holy Trinity Lutheran Church (G) , Immanuel Christian Reformed Church (H) , Jordan Baptist Church (I) . Display/hide their locations on the map
Parks in Burbank include: (1) , Fitzgerald Park (2) , Stevenson Park (3) , Newcastle Park (4) , McArthur Park (5) , Rice Park (6) , Owens Park (7) . Display/hide their locations on the map
Tourist attraction:
Hotels:
Cook County has a predicted average indoor radon screening level between 2 and 4 pCi/L (pico curies per liter) - Moderate Potential Average household size: This city:
3.1 peopleIllinois:
2.6 people
Percentage of family households: This city:
78.0%Whole state:
65.8%
Percentage of households with unmarried partners: This city:
4.9%Whole state:
6.3%
Likely homosexual households (counted as self-reported same-sex unmarried-partner households)
Lesbian couples: 0.2% of all households Gay men: 0.3% of all households
People in group quarters in Burbank in 2010:
186 people in nursing facilities/skilled-nursing facilities
38 people in emergency and transitional shelters (with sleeping facilities) for people experiencing homelessness
15 people in group homes intended for adults
3 people in other noninstitutional facilities
People in group quarters in Burbank in 2000:
56 people in nursing homes
46 people in other noninstitutional group quarters
15 people in schools, hospitals, or wards for the intellectually disabled
Banks with branches in Burbank (2011 data):
TCF National Bank: Burbank Branch at 7901 S. Harlem Avenue, branch established on 2004/12/31; 79th St/Cicero Jewel Branch #2208 at 7910 South Cicero Avenue, branch established on 1996/10/31. Info updated 2009/11/23: Bank assets: $19,007.0 mil, Deposits: $12,377.0 mil, headquarters in Sioux Falls, SD, positive income , Commercial Lending Specialization, 441 total offices , Holding Company: Tcf Financial Corporation
PNC Bank, National Association: Burbank Branch at 7151 W. 159th Street, branch established on 2000/04/17; Burbank Branch at 4900 W 87th St, branch established on 2009/11/06. Info updated 2012/03/20: Bank assets: $263,309.6 mil, Deposits: $197,343.0 mil, headquarters in Wilmington, DE, positive income , Commercial Lending Specialization, 3085 total offices , Holding Company: Pnc Financial Services Group, Inc., The
Archer Bank: 87th Street Branch at 4848 West 87th Street, branch established on 2009/11/06; Burbank Branch at 6400 West 79th Street, branch established on 1999/12/27. Info updated 2010/04/21: Bank assets: $577.8 mil, Deposits: $525.4 mil, headquarters in Chicago, IL, negative income in the last year , Commercial Lending Specialization, 20 total offices , Holding Company: Metropolitan Bank Group, Inc.
State Bank of Countryside: Burbank Branch at 6053 West 79th Street, branch established on 1983/08/15. Info updated 2006/11/03: Bank assets: $727.5 mil, Deposits: $627.7 mil, headquarters in Countryside, IL, negative income in the last year , Commercial Lending Specialization, 6 total offices , Holding Company: Sbc, Incorporated
JPMorgan Chase Bank, National Association: Burbank Station Financial Branch at 7772 Cicero Avenue, Suite B1-B3, branch established on 2003/06/23. Info updated 2011/11/10: Bank assets: $1,811,678.0 mil, Deposits: $1,190,738.0 mil, headquarters in Columbus, OH, positive income , International Specialization, 5577 total offices , Holding Company: Jpmorgan Chase & Co.
MB Financial Bank, National Association: Burbank Branch at 5750 West 87th Street, branch established on 1991/02/11. Info updated 2010/04/27: Bank assets: $9,792.4 mil, Deposits: $7,757.4 mil, headquarters in Chicago, IL, positive income , Commercial Lending Specialization, 93 total offices , Holding Company: Mb Financial, Inc
U.S. Bank National Association: Burbank Branch at 5440 West 87th Street, branch established on 1974/11/18. Info updated 2012/01/30: Bank assets: $330,470.8 mil, Deposits: $236,091.5 mil, headquarters in Cincinnati, OH, positive income , 3121 total offices , Holding Company: U.S. Bancorp
Cole Taylor Bank: Burbank Facility at 79th And State Road, branch established on 1980/02/25. Info updated 2011/11/17: Bank assets: $4,664.7 mil, Deposits: $3,168.2 mil, headquarters in Chicago, IL, positive income , Commercial Lending Specialization, 11 total offices , Holding Company: Taylor Capital Group, Inc.
For population 15 years and over in Burbank:
Never married: 35.4%Now married: 50.0%Separated: 2.4%Widowed: 5.5%Divorced: 6.7% For population 25 years and over in Burbank:
High school or higher: 79.1%Bachelor's degree or higher: 15.0%Graduate or professional degree: 4.1%Unemployed: 5.5%Mean travel time to work (commute): 29.3 minutes
Education Gini index (Inequality in education) Here:
14.4Illinois average:
12.5
Religion statistics for Burbank, IL (based on Cook County data)
Religion Adherents Congregations Catholic 1,947,223 376 Evangelical Protestant 432,975 1,484 Other 312,636 403 Mainline Protestant 202,114 630 Black Protestant 148,895 395 Orthodox 53,276 66 None 2,097,556 -
Source: Clifford Grammich, Kirk Hadaway, Richard Houseal, Dale E.Jones, Alexei Krindatch, Richie Stanley and Richard H.Taylor. 2012. 2010 U.S.Religion Census: Religious Congregations & Membership Study. Association of Statisticians of American Religious Bodies. Jones, Dale E., et al. 2002. Congregations and Membership in the United States 2000. Nashville, TN: Glenmary Research Center. Graphs represent county-level data
Food Environment Statistics: Number of grocery stores : 1,460Cook County :
2.77 / 10,000 pop.Illinois :
2.24 / 10,000 pop.
Number of supercenters and club stores : 23This county :
0.04 / 10,000 pop.Illinois :
0.08 / 10,000 pop.
Number of convenience stores (no gas) : 490This county :
0.93 / 10,000 pop.Illinois :
0.75 / 10,000 pop.
Number of convenience stores (with gas) : 806Here :
1.53 / 10,000 pop.State :
2.61 / 10,000 pop.
Number of full-service restaurants : 3,516Cook County :
6.67 / 10,000 pop.Illinois :
6.86 / 10,000 pop.
Adult diabetes rate : This county :
8.4%Illinois :
8.3%
Adult obesity rate : Cook County :
23.5%Illinois :
25.2%
Low-income preschool obesity rate : Cook County :
16.3%Illinois :
14.5%
Health and Nutrition:
Average overall health of teeth and gums : This city:
47.1%State:
47.2%
Average BMI : Burbank:
28.7Illinois:
28.6
People feeling badly about themselves : People not drinking alcohol at all : Burbank:
10.7%Illinois:
10.8%
Average hours sleeping at night : Overweight people : Burbank:
34.6%Illinois:
33.4%
General health condition : This city:
56.2%State:
56.4%
Average condition of hearing : This city:
78.3%Illinois:
79.9%
More about Health and Nutrition of Burbank, IL Residents
Local government employment and payroll (March 2022)
Function
Full-time employees
Monthly full-time payroll
Average yearly full-time wage
Part-time employees
Monthly part-time payroll
Police Protection - Officers
29 $226,621 $93,774 0 $0 Firefighters
20 $205,987 $123,592 0 $0 Police - Other
18 $65,198 $43,465 8 $7,738 Streets and Highways
14 $89,835 $77,001 0 $0 Other Government Administration
7 $36,657 $62,841 10 $17,272 Fire - Other
5 $22,033 $52,879 0 $0 Other and Unallocable
3 $17,458 $69,832 5 $8,190 Financial Administration
2 $9,019 $54,114 1 $2,066 Housing and Community Development (Local)
1 $5,646 $67,752 1 $1,528
Totals for Government
99 $678,455 $82,237 25 $36,794
Burbank government finances - Expenditure in 2017 (per resident):
Construction - Regular Highways: $2,372,000 ($83.42)
Current Operations - Police Protection: $7,975,000 ($280.48)
Local Fire Protection: $4,420,000 ($155.45)Financial Administration: $3,201,000 ($112.58)Regular Highways: $1,775,000 ($62.43)Protective Inspection and Regulation - Other: $322,000 ($11.32)General - Other: $124,000 ($4.36)General Public Buildings: $43,000 ($1.51)General - Interest on Debt: $3,307,000 ($116.31)
Other Capital Outlay - Police Protection: $121,000 ($4.26)
Total Salaries and Wages: $10,857,000 ($381.85)
Burbank government finances - Revenue in 2017 (per resident):
Miscellaneous - Fines and Forfeits: $1,153,000 ($40.55)
General Revenue - Other: $674,000 ($23.70)Interest Earnings: $47,000 ($1.65)State Intergovernmental - General Local Government Support: $6,542,000 ($230.08)
Highways: $739,000 ($25.99)Tax - Property: $5,993,000 ($210.78)
Other Selective Sales: $2,600,000 ($91.44)Other License: $1,976,000 ($69.50)General Sales and Gross Receipts: $1,903,000 ($66.93)Public Utilities Sales: $1,170,000 ($41.15)
Burbank government finances - Debt in 2017 (per resident):
Long Term Debt - Outstanding Unspecified Public Purpose: $83,914,000 ($2951.29)
Beginning Outstanding - Unspecified Public Purpose: $82,682,000 ($2907.96)Issue, Unspecified Public Purpose: $14,102,000 ($495.97)Retired Unspecified Public Purpose: $12,870,000 ($452.64)
Burbank government finances - Cash and Securities in 2017 (per resident):
Other Funds - Cash and Securities: $14,090,000 ($495.55)
3.53% of this county's 2021 resident taxpayers lived in other counties in 2020 ($82,405 average adjusted gross income )
Here:
3.53%Illinois average:
5.09%
0.01% of residents moved from foreign countries ($114 average AGI )Cook County:
0.01%Illinois average:
0.01%
Top counties from which taxpayers relocated into this county between 2020 and 2021:
5.44% of this county's 2020 resident taxpayers moved to other counties in 2021 ($120,340 average adjusted gross income )
Here:
5.44%Illinois average:
6.10%
0.01% of residents moved to foreign countries ($140 average AGI )Cook County:
0.01%Illinois average:
0.01%
Top counties to which taxpayers relocated from this county between 2020 and 2021:
Businesses in Burbank, IL
Name Count Name Count
7-Eleven 1 McDonald's 1 Ace Hardware 1 Motherhood Maternity 1 Advance Auto Parts 1 Nike 2 Bakers Square 1 OfficeMax 1 Baskin-Robbins 1 Olive Garden 1 Best Western 1 Panera Bread 1 Burger King 2 PetSmart 1 Burlington Coat Factory 1 Popeyes 1 Cricket Wireless 5 RadioShack 2 Dunkin Donuts 1 Skechers USA 1 FedEx 2 Sprint Nextel 1 GameStop 1 Starbucks 2 H&R Block 1 Toys"R"Us 3 Jewel-Osco 1 UPS 1 Just Tires 1 Value City Furniture 1 Kohl's 1 Verizon Wireless 1 Kroger 1 Walgreens 1
Strongest AM radio stations in Burbank:
WMVP (1000 AM; 50 kW; CHICAGO, IL; Owner: ABC, INC.)
WLS (890 AM; 50 kW; CHICAGO, IL; Owner: WLS, INC.)
WGCI (1390 AM; 5 kW; CHICAGO, IL; Owner: AMFM RADIO LICENSES, L.L.C.)
WVIV (1200 AM; 20 kW; CHICAGO, IL; Owner: WLXX-AM LICENSE CORP.)
WSCR (670 AM; 50 kW; CHICAGO, IL; Owner: INFINITY BROADCASTING OPERATIONS, INC.)
WYLL (1160 AM; 50 kW; CHICAGO, IL; Owner: SCA LICENSE CORPORATION)
WRDZ (1300 AM; 4 kW; LA GRANGE, IL; Owner: ABC, INC.)
WBBM (780 AM; 50 kW; CHICAGO, IL; Owner: INFINITY BROADCASTING OPERATIONS, INC.)
WGN (720 AM; 50 kW; CHICAGO, IL; Owner: WGN CONTINENTAL BROADCASTING CO.)
WCSN (820 AM; 5 kW; CHICAGO, IL; Owner: WYPA, INC.)
WNWI (1080 AM; 3 kW; OAK LAWN, IL; Owner: BIRACH BROADCASTING CORPORATION)
WNTD (950 AM; 5 kW; CHICAGO, IL; Owner: RADIO UNICA OF CHICAGO LICENSE CORP.)
WIND (560 AM; 5 kW; CHICAGO, IL; Owner: TICHENOR LICENSE CORPORATION ("TLC"))
Strongest FM radio stations in Burbank:
WCKG (105.9 FM; ELMWOOD PARK, IL; Owner: INFINITY HOLDINGS CORPORATION OF ORLANDO)
WLIT-FM (93.9 FM; CHICAGO, IL; Owner: AMFM RADIO LICENSES, L.L.C.)
WJMK (104.3 FM; CHICAGO, IL; Owner: INFINITY BROADCASTING CORP. OF ILLINOIS)
WNUA (95.5 FM; CHICAGO, IL; Owner: AMFM RADIO LICENSES, L.L.C.)
WTMX (101.9 FM; SKOKIE, IL; Owner: BONNEVILLE HOLDING COMPANY)
WBBM-FM (96.3 FM; CHICAGO, IL; Owner: INFINITY BROADCASTING OPERATIONS, INC.)
WKSC-FM (103.5 FM; CHICAGO, IL; Owner: AMFM RADIO LICENSES, L.L.C.)
WFMT (98.7 FM; CHICAGO, IL; Owner: WINDOW TO THE WORLD COMMUNICATIONS)
WZZN (94.7 FM; CHICAGO, IL; Owner: ABC CHICAGO FM RADIO,INC.)
WGCI-FM (107.5 FM; CHICAGO, IL; Owner: AMFM RADIO LICENSES, L.L.C.)
WDRV (97.1 FM; CHICAGO, IL; Owner: BONNEVILLE HOLDING COMPANY)
WBEZ (91.5 FM; CHICAGO, IL; Owner: THE WBEZ ALLIANCE, INC.)
WKQX (101.1 FM; CHICAGO, IL; Owner: EMMIS RADIO LICENSE CORPORATION)
WLUP-FM (97.9 FM; CHICAGO, IL; Owner: BONNEVILLE HOLDING COMPANY)
WNND (100.3 FM; CHICAGO, IL; Owner: BONNEVILLE HOLDING COMPANY)
WOJO (105.1 FM; EVANSTON, IL; Owner: TICHENOR LICENSE CORPORATION ("TLC"))
WUSN (99.5 FM; CHICAGO, IL; Owner: INFINITY BROADCASTING CORPORATION OF CHICAGO)
WVAZ (102.7 FM; OAK PARK, IL; Owner: AMFM RADIO LICENSES, L.L.C.)
WXRT-FM (93.1 FM; CHICAGO, IL; Owner: INFINITY BROADCASTING OPERATIONS, INC.)
WLEY-FM (107.9 FM; AURORA, IL; Owner: WLEY LICENSING, INC.)
TV broadcast stations around Burbank:
WLS-TV (Channel 7; CHICAGO, IL; Owner: WLS TELEVISION, INC.)
WMAQ-TV (Channel 5; CHICAGO, IL; Owner: NBC SUBSIDIARY (WMAQ-TV), INC.)
WTTW (Channel 11; CHICAGO, IL; Owner: WINDOW TO THE WORLD COMMUNICATIONS, INC.)
WGN-TV (Channel 9; CHICAGO, IL; Owner: WGN CONTINENTAL BROADCASTING COMPANY)
WGBO-TV (Channel 66; JOLIET, IL; Owner: WGBO LICENSE PARTNERSHIP, G.P.)
WPWR-TV (Channel 50; GARY, IN; Owner: FOX TELEVISION STATIONS, INC.)
WXFT (Channel 60; AURORA, IL; Owner: TELEFUTURA CHICAGO LLC)
WCIU-TV (Channel 26; CHICAGO, IL; Owner: WCIU-TV LIMITED PARTNERSHIP)
WCPX (Channel 38; CHICAGO, IL; Owner: PAXSON CHICAGO LICENSE, INC.)
WBBM-TV (Channel 2; CHICAGO, IL; Owner: CBS BROADCASTING INC.)
WFLD (Channel 32; CHICAGO, IL; Owner: FOX TELEVISION STATIONS, INC.)
W68DO (Channel 68; PALATINE, IL; Owner: TRINITY BROADCASTING NETWORK)
WFBT-CA (Channel 23; CHICAGO, IL; Owner: CHANNEL 23 LIMITED PARTNERSHIP)
WJYS (Channel 62; HAMMOND, IN; Owner: JOVON BROADCASTING CORPORATION)
WSNS-TV (Channel 44; CHICAGO, IL; Owner: TELEMUNDO OF CHICAGO, INC.)
WOCH-LP (Channel 28; CHICAGO, IL; Owner: KM LPTV OF CHICAGO-28, L.L.C.)
WYCC (Channel 20; CHICAGO, IL; Owner: COLLEGE DIST. #508, COUNTY OF COOK)
WOCK-CA (Channel 13; CHICAGO, IL; Owner: KM LPTV OF CHICAGO-13, L.L.C.)
W34CK (Channel 34; ARLINGTON HEIGHTS, IL; Owner: FIRST UNITED, INC.)
WYIN (Channel 56; GARY, IN; Owner: NORTHWEST INDIANA PUBLIC BROADCASTING, INC.)
W54AP (Channel 54; BLUE ISLAND, IL; Owner: CATHOLIC VIEWS BROADCASTS, INC.)
W64CQ (Channel 64; ARLINGTON HEIGHTS, IL; Owner: TRINITY BROADCASTING NETWORK)
W24AJ (Channel 24; AURORA, IL; Owner: NELSON TV, INC.)
W57DN (Channel 57; ELGIN, IL; Owner: TRINITY BROADCASTING NETWORK)
FCC Registered Antenna Towers: 60 (
See the full list of FCC Registered Antenna Towers in Burbank )
FCC Registered Broadcast Land Mobile Towers: 9 (
See the full list of FCC Registered Broadcast Land Mobile Towers in Burbank, IL )
FCC Registered Microwave Towers: 4
CH02YC529, 6324 W 87th St (Lat: 41.734389 Lon: -87.778389), Type: Pole, Structure height: 40.2 m, Call Sign: WQJR725, Assigned Frequencies: 19325.0 MHz, 23075.0 MHz, 19325.0 MHz, 23175.0 MHz, 19325.0 MHz, 23075.0 MHz, 19325.0 MHz, 23175.0 MHz, 19325.0 MHz, 23075.0 MHz... (+8 more), Grant Date: 12/05/2008, Expiration Date: 12/05/2018, Cancellation Date: 01/04/2010, Certifier: Nadja S Sodos-Wallace, Registrant: Clearwire Corporation, 815 Connecticut Avenue, Nw, Suite 610, Washington, DC 20006, Phone: (202) 330-4011, Fax: (202) 330-4008, Email:
IL-CHI0087, 5700 West 75th Place (Ch42487a) (Lat: 41.755861 Lon: -87.763278), Type: Mtower, Structure height: 37.8 m, Call Sign: WQKZ826, Assigned Frequencies: 23125.0 MHz, 23225.0 MHz, 23075.0 MHz, Grant Date: 11/05/2009, Expiration Date: 11/05/2019, Cancellation Date: 11/04/2019, Certifier: Nadja S Sodos-Wallace, Registrant: Sprint Corporation, 12502 Sunrise Valley Drive, M/S: Varesa, Reston, VA 20196, Phone: (800) 572-8256, Fax: (703) 433-4483, Email:
IL-CHI5517, 7035 W. 83rd Street (Lat: 41.739750 Lon: -87.795778), Type: Tank, Structure height: 33.5 m, Call Sign: WQLB676, Assigned Frequencies: 11015.0 MHz, 11135.0 MHz, 11015.0 MHz, 11135.0 MHz, Grant Date: 01/07/2020, Expiration Date: 11/24/2029, Cancellation Date: 09/08/2021, Certifier: Nadja S Sodos-Wallace, Registrant: T-Mobile Usa, Inc., 12920 Se 38th Street, Bellevue, WA 98006, Phone: (425) 383-8401, Fax: (425) 383-4840, Email:
IL-CHI6091, 7801 Lavergne Ave (Lat: 41.750333 Lon: -87.746083), Type: Tank, Structure height: 38.1 m, Overall height: 39 m, Call Sign: WQLJ914, Licensee ID: L01744207, Assigned Frequencies: 10735.0 MHz, 10815.0 MHz, 10855.0 MHz, 10935.0 MHz, Grant Date: 04/07/2020, Expiration Date: 02/17/2030, Cancellation Date: 09/10/2021, Certifier: Nadja S Sodos-Wallace, Registrant: Clearwire Spectrum Holdings Iii LLC FCC Registered Amateur Radio Licenses: 54 (
See the full list of FCC Registered Amateur Radio Licenses in Burbank )
Home Mortgage Disclosure Act Aggregated Statistics For Year 2009(Based on 3 full and 3 partial tracts) A) FHA, FSA/RHS & VA B) Conventional C) Refinancings D) Home Improvement Loans E) Loans on Dwellings For 5+ Families F) Non-occupant Loans on Number Average Value Number Average Value Number Average Value Number Average Value Number Average Value Number Average Value
LOANS ORIGINATED 60 $191,972 52 $161,299 402 $180,648 18 $68,116 3 $471,673 13 $185,356 APPLICATIONS APPROVED, NOT ACCEPTED 1 $175,650 4 $165,350 41 $190,709 2 $16,000 0 $0 1 $30,000 APPLICATIONS DENIED 15 $174,842 17 $185,238 187 $218,597 14 $66,077 0 $0 5 $185,450 APPLICATIONS WITHDRAWN 13 $188,275 11 $186,084 78 $188,028 5 $98,108 0 $0 3 $108,417 FILES CLOSED FOR INCOMPLETENESS 6 $197,468 3 $193,183 34 $213,556 0 $0 0 $0 0 $0
Aggregated Statistics For Year 2008(Based on 3 full and 3 partial tracts) A) FHA, FSA/RHS & VA B) Conventional C) Refinancings D) Home Improvement Loans E) Loans on Dwellings For 5+ Families F) Non-occupant Loans on Number Average Value Number Average Value Number Average Value Number Average Value Number Average Value Number Average Value
LOANS ORIGINATED 38 $218,111 96 $191,036 331 $195,181 28 $101,031 3 $397,620 20 $243,354 APPLICATIONS APPROVED, NOT ACCEPTED 1 $247,390 8 $239,368 59 $221,191 8 $83,888 0 $0 0 $0 APPLICATIONS DENIED 16 $203,735 34 $244,264 264 $216,557 35 $81,850 1 $736,000 11 $192,485 APPLICATIONS WITHDRAWN 11 $214,522 13 $225,428 68 $236,458 8 $118,498 0 $0 3 $153,000 FILES CLOSED FOR INCOMPLETENESS 2 $155,985 9 $272,477 26 $202,067 4 $134,525 0 $0 1 $200,470
Aggregated Statistics For Year 2007(Based on 3 full and 3 partial tracts) A) FHA, FSA/RHS & VA B) Conventional C) Refinancings D) Home Improvement Loans E) Loans on Dwellings For 5+ Families F) Non-occupant Loans on Number Average Value Number Average Value Number Average Value Number Average Value Number Average Value Number Average Value
LOANS ORIGINATED 5 $241,454 225 $222,027 570 $184,984 72 $85,048 3 $487,853 45 $186,483 APPLICATIONS APPROVED, NOT ACCEPTED 0 $0 26 $174,463 106 $206,115 19 $46,582 0 $0 7 $168,197 APPLICATIONS DENIED 1 $235,000 74 $234,575 331 $201,220 71 $70,772 1 $339,490 25 $196,959 APPLICATIONS WITHDRAWN 2 $198,335 18 $223,813 106 $207,318 11 $139,234 0 $0 11 $208,508 FILES CLOSED FOR INCOMPLETENESS 0 $0 17 $252,758 58 $220,063 2 $17,500 0 $0 1 $195,030
Aggregated Statistics For Year 2006(Based on 3 full and 3 partial tracts) A) FHA, FSA/RHS & VA B) Conventional C) Refinancings D) Home Improvement Loans E) Loans on Dwellings For 5+ Families F) Non-occupant Loans on G) Loans On Manufactured Number Average Value Number Average Value Number Average Value Number Average Value Number Average Value Number Average Value Number Average Value
LOANS ORIGINATED 3 $248,543 469 $188,246 661 $173,121 89 $86,047 3 $337,083 67 $176,469 0 $0 APPLICATIONS APPROVED, NOT ACCEPTED 0 $0 67 $196,772 116 $184,165 16 $97,429 0 $0 16 $247,936 0 $0 APPLICATIONS DENIED 0 $0 161 $196,701 265 $191,246 57 $99,825 0 $0 29 $189,509 3 $145,667 APPLICATIONS WITHDRAWN 1 $275,000 52 $211,057 149 $180,059 8 $89,319 2 $316,415 6 $269,238 0 $0 FILES CLOSED FOR INCOMPLETENESS 0 $0 14 $224,309 56 $205,919 2 $123,850 1 $48,000 4 $215,080 0 $0
Aggregated Statistics For Year 2005(Based on 3 full and 3 partial tracts) A) FHA, FSA/RHS & VA B) Conventional C) Refinancings D) Home Improvement Loans E) Loans on Dwellings For 5+ Families F) Non-occupant Loans on Number Average Value Number Average Value Number Average Value Number Average Value Number Average Value Number Average Value
LOANS ORIGINATED 9 $206,823 575 $172,798 726 $169,932 73 $80,763 5 $446,698 89 $176,760 APPLICATIONS APPROVED, NOT ACCEPTED 1 $141,390 76 $169,516 108 $153,933 18 $75,329 1 $370,000 16 $137,379 APPLICATIONS DENIED 1 $194,000 99 $178,802 289 $173,259 52 $83,069 1 $400,000 14 $137,287 APPLICATIONS WITHDRAWN 0 $0 68 $169,774 205 $176,734 18 $142,593 0 $0 12 $154,759 FILES CLOSED FOR INCOMPLETENESS 0 $0 8 $150,328 68 $175,714 2 $62,500 0 $0 3 $204,700
Aggregated Statistics For Year 2004(Based on 3 full and 3 partial tracts) A) FHA, FSA/RHS & VA B) Conventional C) Refinancings D) Home Improvement Loans E) Loans on Dwellings For 5+ Families F) Non-occupant Loans on Number Average Value Number Average Value Number Average Value Number Average Value Number Average Value Number Average Value
LOANS ORIGINATED 20 $178,468 469 $165,996 722 $144,425 96 $69,308 4 $354,995 49 $151,688 APPLICATIONS APPROVED, NOT ACCEPTED 0 $0 35 $183,447 112 $148,661 12 $88,423 0 $0 6 $171,865 APPLICATIONS DENIED 4 $182,750 81 $158,466 263 $154,138 63 $69,348 2 $280,925 8 $193,896 APPLICATIONS WITHDRAWN 2 $171,205 34 $162,005 218 $160,262 6 $80,383 2 $407,665 2 $135,065 FILES CLOSED FOR INCOMPLETENESS 1 $170,970 18 $187,354 44 $176,267 2 $85,340 0 $0 0 $0
Aggregated Statistics For Year 2003(Based on 3 full and 3 partial tracts) A) FHA, FSA/RHS & VA B) Conventional C) Refinancings D) Home Improvement Loans E) Loans on Dwellings For 5+ Families F) Non-occupant Loans on Number Average Value Number Average Value Number Average Value Number Average Value Number Average Value Number Average Value
LOANS ORIGINATED 48 $171,670 389 $155,923 1,303 $121,634 81 $46,787 7 $501,496 38 $139,358 APPLICATIONS APPROVED, NOT ACCEPTED 1 $138,860 47 $180,718 168 $123,341 12 $45,412 1 $408,000 8 $218,678 APPLICATIONS DENIED 5 $168,964 60 $170,998 344 $130,485 53 $23,486 0 $0 9 $163,737 APPLICATIONS WITHDRAWN 3 $140,317 34 $165,653 286 $138,480 17 $30,825 0 $0 7 $120,621 FILES CLOSED FOR INCOMPLETENESS 3 $161,560 6 $231,707 31 $130,918 1 $20,000 0 $0 3 $194,680
Aggregated Statistics For Year 2002(Based on 3 full and 3 partial tracts) A) FHA, FSA/RHS & VA B) Conventional C) Refinancings D) Home Improvement Loans E) Loans on Dwellings For 5+ Families F) Non-occupant Loans on Number Average Value Number Average Value Number Average Value Number Average Value Number Average Value Number Average Value
LOANS ORIGINATED 53 $148,804 305 $137,357 828 $117,108 53 $30,788 9 $308,984 15 $151,755 APPLICATIONS APPROVED, NOT ACCEPTED 1 $116,990 23 $129,136 125 $120,073 12 $30,204 0 $0 6 $114,763 APPLICATIONS DENIED 5 $137,600 42 $134,004 255 $113,502 38 $16,531 1 $285,000 4 $151,798 APPLICATIONS WITHDRAWN 3 $142,263 28 $137,502 158 $128,494 2 $65,755 1 $548,000 4 $104,218 FILES CLOSED FOR INCOMPLETENESS 0 $0 7 $140,217 39 $128,564 1 $20,000 0 $0 0 $0
Aggregated Statistics For Year 2001(Based on 3 full and 3 partial tracts) A) FHA, FSA/RHS & VA B) Conventional C) Refinancings D) Home Improvement Loans E) Loans on Dwellings For 5+ Families F) Non-occupant Loans on Number Average Value Number Average Value Number Average Value Number Average Value Number Average Value Number Average Value
LOANS ORIGINATED 69 $139,344 319 $123,273 727 $109,898 62 $18,314 4 $330,930 19 $110,012 APPLICATIONS APPROVED, NOT ACCEPTED 2 $118,810 19 $110,318 94 $107,006 19 $11,851 0 $0 4 $87,375 APPLICATIONS DENIED 4 $125,958 42 $122,546 213 $105,509 52 $16,590 0 $0 3 $151,363 APPLICATIONS WITHDRAWN 3 $152,737 21 $132,246 126 $99,259 10 $28,160 0 $0 4 $176,098 FILES CLOSED FOR INCOMPLETENESS 3 $123,147 9 $129,328 46 $117,822 3 $37,137 0 $0 0 $0
Aggregated Statistics For Year 2000(Based on 3 full and 3 partial tracts) A) FHA, FSA/RHS & VA B) Conventional C) Refinancings D) Home Improvement Loans E) Loans on Dwellings For 5+ Families F) Non-occupant Loans on Number Average Value Number Average Value Number Average Value Number Average Value Number Average Value Number Average Value
LOANS ORIGINATED 72 $127,168 314 $128,931 219 $85,311 74 $21,609 4 $267,000 16 $74,662 APPLICATIONS APPROVED, NOT ACCEPTED 0 $0 23 $122,626 42 $86,911 25 $18,416 0 $0 2 $68,210 APPLICATIONS DENIED 11 $149,375 55 $91,994 157 $88,635 56 $21,889 0 $0 8 $60,468 APPLICATIONS WITHDRAWN 1 $157,460 26 $126,174 85 $84,304 9 $39,313 0 $0 3 $86,623 FILES CLOSED FOR INCOMPLETENESS 1 $84,070 8 $116,316 40 $105,694 1 $6,320 0 $0 2 $80,000
Aggregated Statistics For Year 1999(Based on 3 full and 3 partial tracts) A) FHA, FSA/RHS & VA B) Conventional C) Refinancings D) Home Improvement Loans E) Loans on Dwellings For 5+ Families F) Non-occupant Loans on Number Average Value Number Average Value Number Average Value Number Average Value Number Average Value Number Average Value
LOANS ORIGINATED 95 $125,901 298 $110,117 368 $91,408 86 $19,146 7 $349,860 17 $112,980 APPLICATIONS APPROVED, NOT ACCEPTED 4 $119,085 19 $121,570 93 $83,720 10 $38,613 1 $279,610 2 $64,215 APPLICATIONS DENIED 13 $118,675 47 $107,114 153 $96,287 44 $24,578 1 $149,790 8 $86,490 APPLICATIONS WITHDRAWN 5 $151,740 24 $102,297 89 $86,659 11 $52,362 1 $414,380 2 $58,020 FILES CLOSED FOR INCOMPLETENESS 1 $110,870 9 $93,457 49 $95,823 0 $0 0 $0 1 $95,200
Detailed HMDA statistics for the following Tracts:
8209.01
, 8209.02 , 8210.01 , 8210.02 , 8211.01 , 8211.02
Private Mortgage Insurance Companies Aggregated Statistics For Year 2009(Based on 3 full and 3 partial tracts) A) Conventional B) Refinancings Number Average Value Number Average Value
LOANS ORIGINATED 13 $200,771 7 $215,699 APPLICATIONS APPROVED, NOT ACCEPTED 10 $204,755 11 $242,838 APPLICATIONS DENIED 3 $253,900 9 $199,224 APPLICATIONS WITHDRAWN 2 $176,125 2 $214,500 FILES CLOSED FOR INCOMPLETENESS 1 $327,000 2 $108,495
Aggregated Statistics For Year 2008(Based on 3 full and 3 partial tracts) A) Conventional B) Refinancings C) Non-occupant Loans on Number Average Value Number Average Value Number Average Value
LOANS ORIGINATED 43 $226,916 34 $253,963 2 $301,000 APPLICATIONS APPROVED, NOT ACCEPTED 16 $264,846 25 $244,250 0 $0 APPLICATIONS DENIED 5 $259,388 5 $199,870 2 $134,905 APPLICATIONS WITHDRAWN 4 $314,058 2 $176,340 0 $0 FILES CLOSED FOR INCOMPLETENESS 1 $287,780 2 $167,765 0 $0
Aggregated Statistics For Year 2007(Based on 3 full and 3 partial tracts) A) Conventional B) Refinancings C) Non-occupant Loans on Number Average Value Number Average Value Number Average Value
LOANS ORIGINATED 55 $255,467 41 $270,359 0 $0 APPLICATIONS APPROVED, NOT ACCEPTED 15 $300,535 11 $227,925 1 $219,400 APPLICATIONS DENIED 0 $0 1 $306,000 0 $0 APPLICATIONS WITHDRAWN 1 $155,600 3 $194,137 0 $0 FILES CLOSED FOR INCOMPLETENESS 2 $215,795 0 $0 0 $0
Aggregated Statistics For Year 2006(Based on 3 full and 3 partial tracts) A) Conventional B) Refinancings C) Non-occupant Loans on Number Average Value Number Average Value Number Average Value
LOANS ORIGINATED 49 $239,528 24 $219,324 3 $219,453 APPLICATIONS APPROVED, NOT ACCEPTED 7 $227,757 8 $276,534 1 $182,000 APPLICATIONS DENIED 1 $340,000 0 $0 0 $0 APPLICATIONS WITHDRAWN 3 $196,443 0 $0 1 $192,810 FILES CLOSED FOR INCOMPLETENESS 0 $0 0 $0 0 $0
Aggregated Statistics For Year 2005(Based on 3 full and 3 partial tracts) A) Conventional B) Refinancings C) Non-occupant Loans on Number Average Value Number Average Value Number Average Value
LOANS ORIGINATED 64 $217,610 40 $203,775 2 $256,905 APPLICATIONS APPROVED, NOT ACCEPTED 8 $229,089 14 $185,067 0 $0 APPLICATIONS DENIED 2 $259,310 1 $248,000 0 $0 APPLICATIONS WITHDRAWN 5 $180,098 7 $205,083 0 $0 FILES CLOSED FOR INCOMPLETENESS 0 $0 0 $0 0 $0
Aggregated Statistics For Year 2004(Based on 3 full and 3 partial tracts) A) Conventional B) Refinancings C) Non-occupant Loans on Number Average Value Number Average Value Number Average Value
LOANS ORIGINATED 103 $195,413 42 $186,089 3 $158,237 APPLICATIONS APPROVED, NOT ACCEPTED 11 $183,399 13 $173,285 0 $0 APPLICATIONS DENIED 4 $256,442 0 $0 1 $306,000 APPLICATIONS WITHDRAWN 5 $236,518 6 $203,540 1 $230,650 FILES CLOSED FOR INCOMPLETENESS 1 $129,350 1 $180,000 0 $0
Aggregated Statistics For Year 2003(Based on 3 full and 3 partial tracts) A) Conventional B) Refinancings C) Non-occupant Loans on Number Average Value Number Average Value Number Average Value
LOANS ORIGINATED 142 $172,367 104 $151,686 1 $79,530 APPLICATIONS APPROVED, NOT ACCEPTED 16 $169,391 27 $155,547 1 $152,000 APPLICATIONS DENIED 5 $126,990 4 $137,962 3 $106,103 APPLICATIONS WITHDRAWN 8 $197,189 5 $134,566 0 $0 FILES CLOSED FOR INCOMPLETENESS 0 $0 0 $0 0 $0
Aggregated Statistics For Year 2002(Based on 3 full and 3 partial tracts) A) Conventional B) Refinancings Number Average Value Number Average Value
LOANS ORIGINATED 125 $141,786 91 $145,154 APPLICATIONS APPROVED, NOT ACCEPTED 15 $143,916 19 $133,847 APPLICATIONS DENIED 5 $137,664 3 $122,860 APPLICATIONS WITHDRAWN 4 $140,295 5 $120,094 FILES CLOSED FOR INCOMPLETENESS 0 $0 0 $0
Aggregated Statistics For Year 2001(Based on 3 full and 3 partial tracts) A) Conventional B) Refinancings C) Non-occupant Loans on Number Average Value Number Average Value Number Average Value
LOANS ORIGINATED 105 $137,338 107 $136,119 3 $139,603 APPLICATIONS APPROVED, NOT ACCEPTED 16 $122,855 13 $128,610 3 $116,667 APPLICATIONS DENIED 1 $284,860 2 $181,480 1 $167,480 APPLICATIONS WITHDRAWN 5 $150,702 5 $154,096 0 $0 FILES CLOSED FOR INCOMPLETENESS 2 $91,065 1 $103,540 0 $0
Aggregated Statistics For Year 2000(Based on 3 full and 3 partial tracts) A) Conventional B) Refinancings C) Non-occupant Loans on Number Average Value Number Average Value Number Average Value
LOANS ORIGINATED 100 $127,895 18 $133,157 2 $96,920 APPLICATIONS APPROVED, NOT ACCEPTED 10 $103,527 3 $127,230 0 $0 APPLICATIONS DENIED 6 $128,938 3 $156,193 0 $0 APPLICATIONS WITHDRAWN 2 $127,490 0 $0 0 $0 FILES CLOSED FOR INCOMPLETENESS 1 $92,120 0 $0 0 $0
Aggregated Statistics For Year 1999(Based on 3 full and 3 partial tracts) A) Conventional B) Refinancings C) Non-occupant Loans on Number Average Value Number Average Value Number Average Value
LOANS ORIGINATED 94 $120,948 42 $123,555 2 $101,905 APPLICATIONS APPROVED, NOT ACCEPTED 3 $108,357 11 $116,843 0 $0 APPLICATIONS DENIED 10 $150,739 3 $119,887 0 $0 APPLICATIONS WITHDRAWN 1 $67,860 2 $99,675 0 $0 FILES CLOSED FOR INCOMPLETENESS 0 $0 0 $0 0 $0
Detailed PMIC statistics for the following Tracts:
8209.01
, 8209.02 , 8210.01 , 8210.02 , 8211.01 , 8211.02 Fire-safe hotels and motels in Burbank, Illinois:
Crown II Motel, 8450 S Cicero Ave, Burbank, Illinois 60459 Phone: (708) 499-6262
Americas Best Value Inn, 5001 W 79TH St, Burbank, Illinois 60459 Phone: (708) 581-7390, Fax: (708) 581-7391
Budget Inn, 8450 S Cicero Ave, Burbank, Illinois Phone: (708) 499-4111
Best Western Inn & Suites Midway Airport, 8220 S Cicero Ave, Burbank, Illinois 60459 Phone: (708) 497-3000, Fax: (708) 497-3019
All 4 fire-safe hotels and motels in Burbank, Illinois
Most common first names in Burbank, IL among deceased individuals Name Count Lived (average)
John 264 71.9 years Mary 205 76.4 years Joseph 175 72.8 years Frank 146 74.3 years Edward 142 74.5 years James 136 71.5 years George 135 73.9 years Robert 134 67.4 years William 133 72.2 years Helen 122 76.4 years
Most common last names in Burbank, IL among deceased individuals Last name Count Lived (average)
Smith 38 74.6 years Miller 29 75.2 years Johnson 28 76.2 years Rogers 18 74.7 years Novak 14 72.7 years Martin 14 66.6 years Jones 14 67.4 years Murphy 14 72.1 years Nelson 14 71.2 years Peterson 13 77.4 years
Burbank compared to Illinois state average:
Unemployed percentage below state average. Black race population percentage significantly below state average. Hispanic race population percentage above state average. Foreign-born population percentage above state average. Renting percentage below state average. Length of stay since moving in significantly above state average. Percentage of population with a bachelor's degree or higher below state average.
#7 on the list of "Top 101 cities with the most residents born in Poland (population 500+)"
#13 on the list of "Top 101 cities with the most residents born in Eastern Europe (population 500+)"
#18 on the list of "Top 101 cities with the most residents born in Europe (population 500+)"
#46 on the list of "Top 101 cities with the most residents born in Jordan (population 500+)"
#56 (60459) on the list of "Top 101 zip codes with the largest percentage of Polish first ancestries"
#84 (60459) on the list of "Top 101 zip codes with the largest percentage of Arab first ancestries"
#99 (60459) on the list of "Top 101 zip codes with the largest percentage of Lithuanian first ancestries (pop 5,000+)"
#1 on the list of "Top 101 counties with the most Black Protestant congregations"
#1 on the list of "Top 101 counties with the most Catholic congregations"
#1 on the list of "Top 101 counties with the highest surface withdrawal of fresh water for public supply"
#2 on the list of "Top 101 counties with the most Black Protestant adherents"
#2 on the list of "Top 101 counties with the most Orthodox congregations (pop. 50,000+)"
Top Patent Applicants
Edwin Dizon Manalang (9)
Stanley Landis (2)
Zbigniew Bochenek (2)
Christopher M. Dyszkiewicz (1)
Elizabeth Ann Kovick (1)
J. Kevin Corrigan (1)
Manuel Luna Diaz, Jr. (1)
Colm K. Corrigan (1)
Michael S. O'Hara (1)
Bozena Takuski (1)
Total of 24 patent applications in 2008-2024.


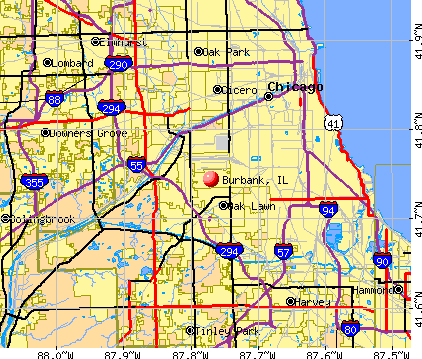


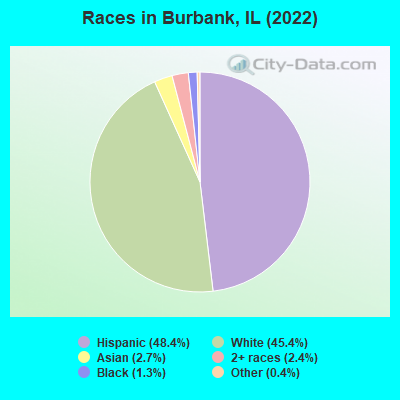
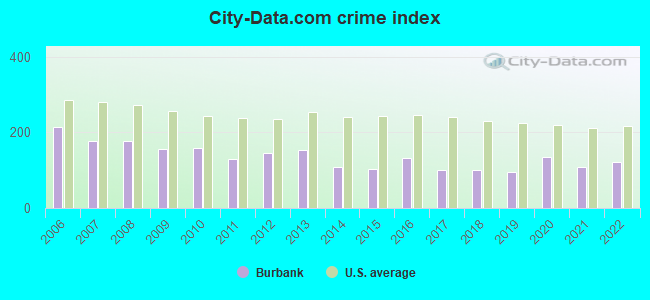
 Recent articles from our blog. Our writers, many of them Ph.D. graduates or candidates, create easy-to-read articles on a wide variety of topics.

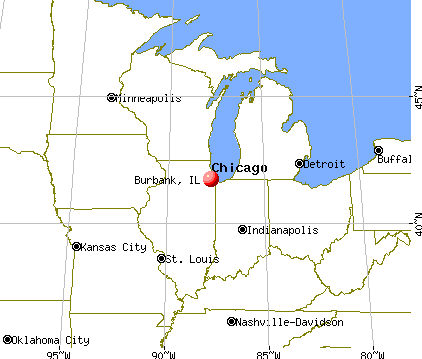
 (2.2 miles
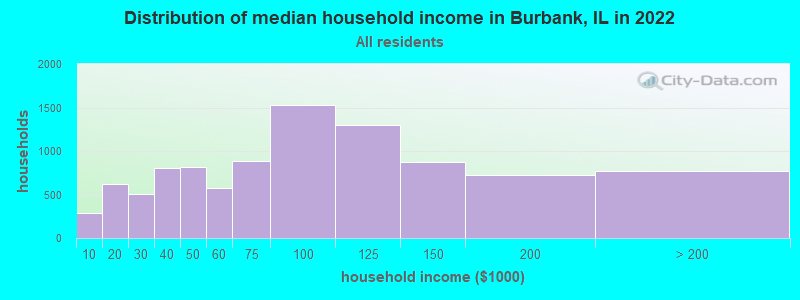
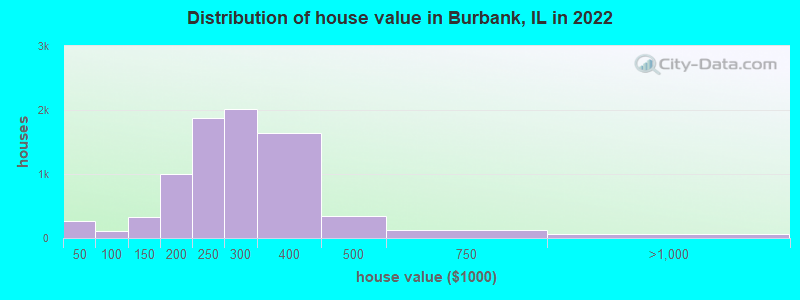
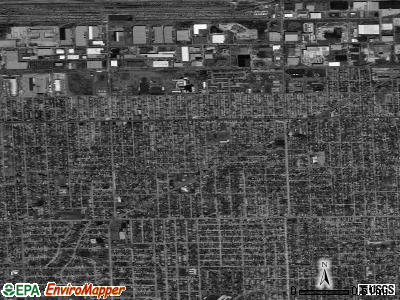
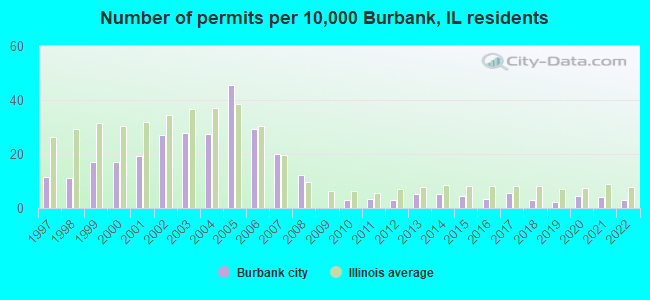
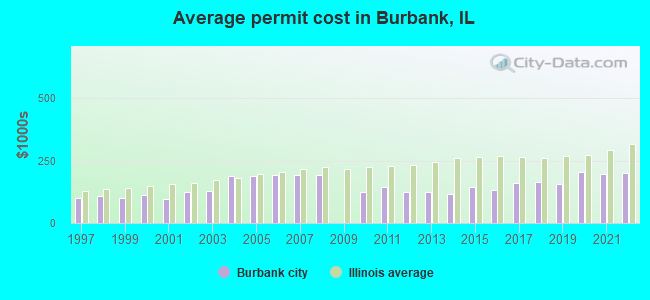
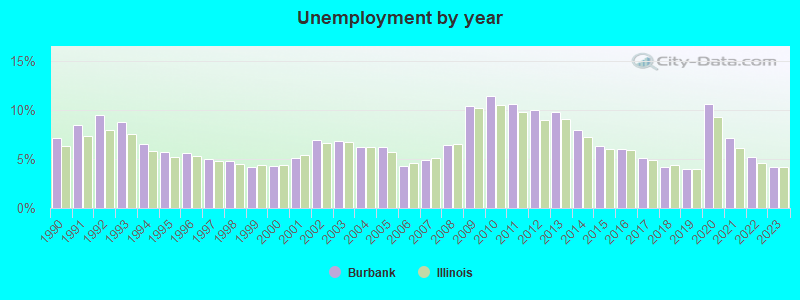
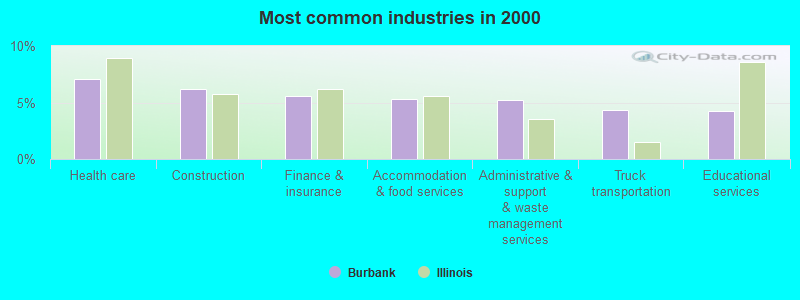
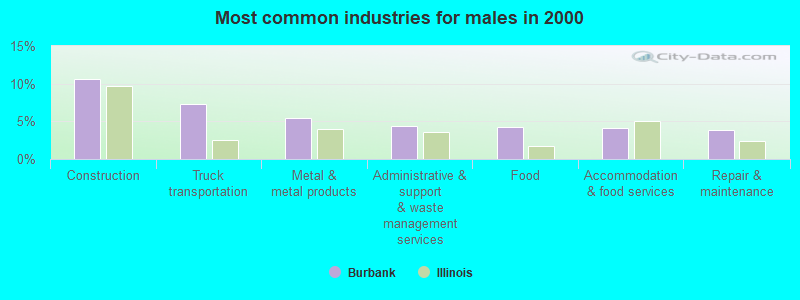
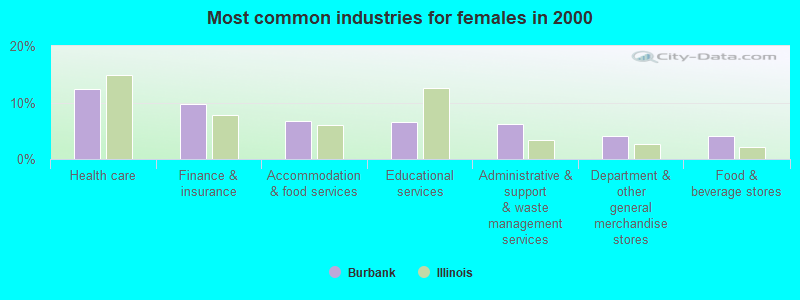
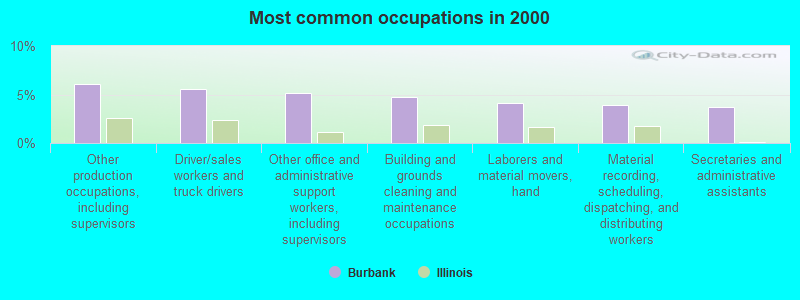
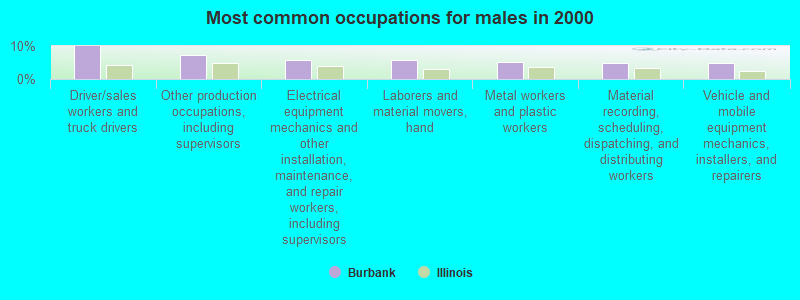
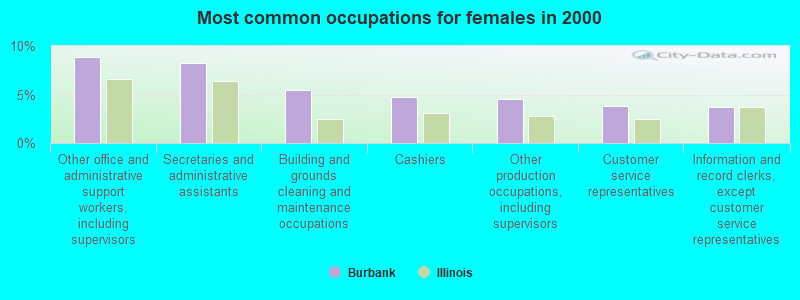
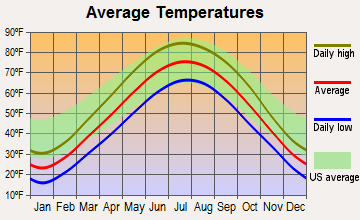
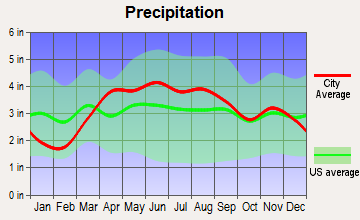
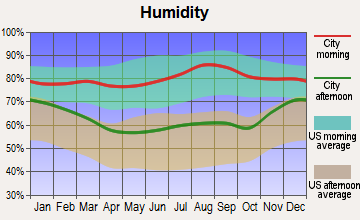
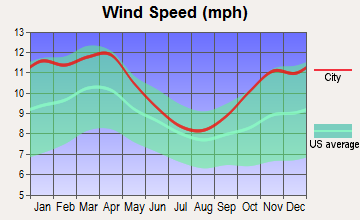
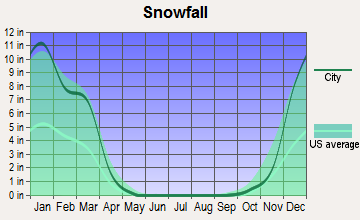
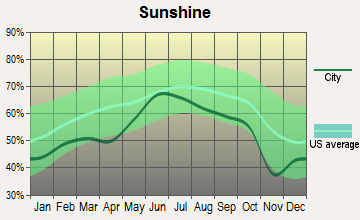
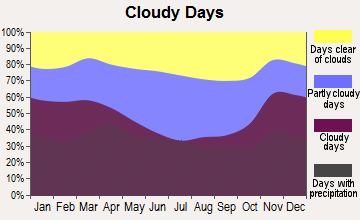


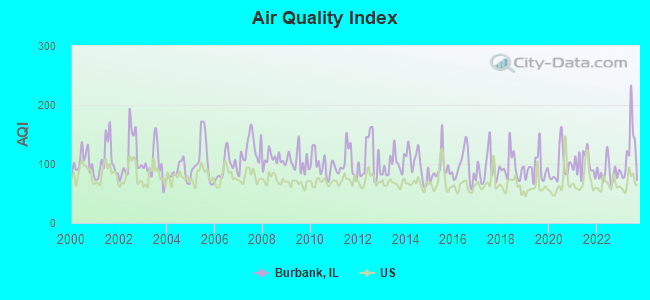
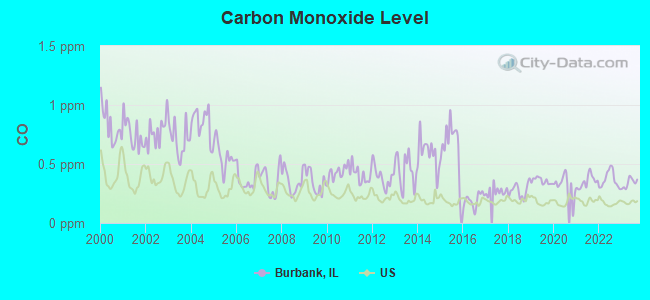
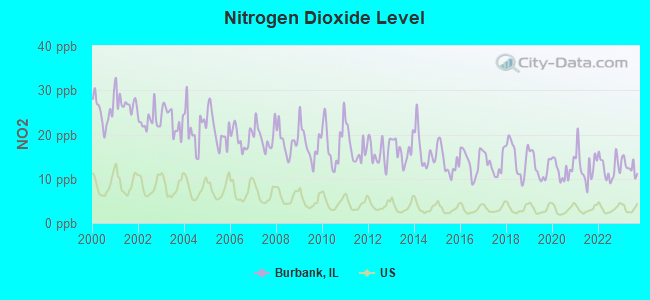
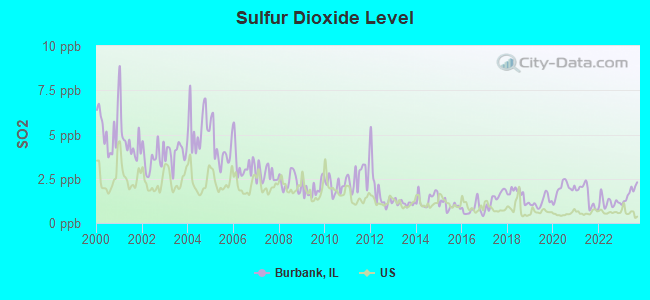
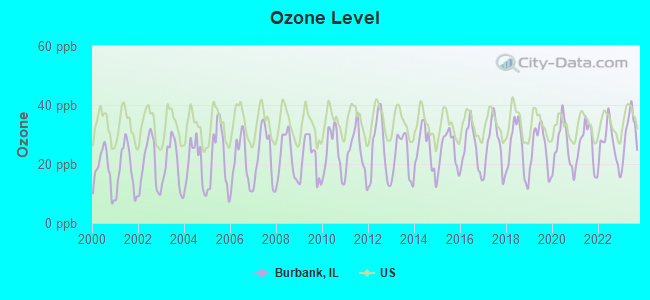
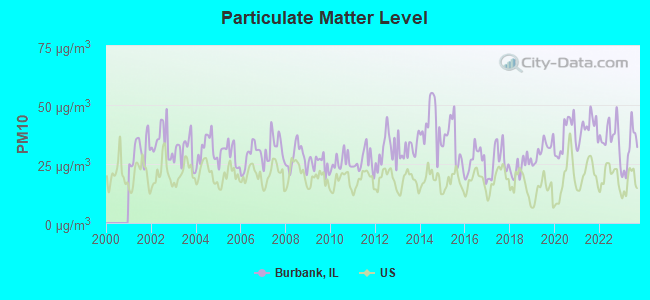
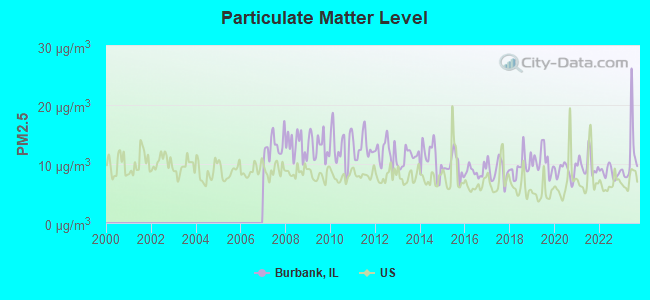
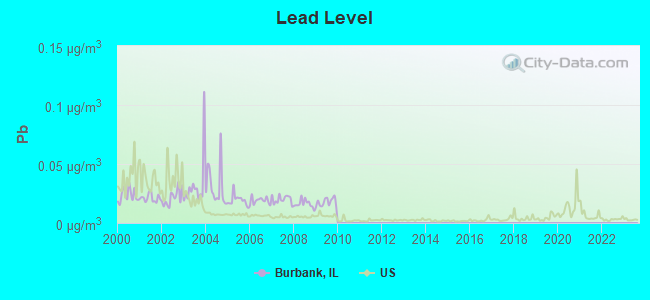
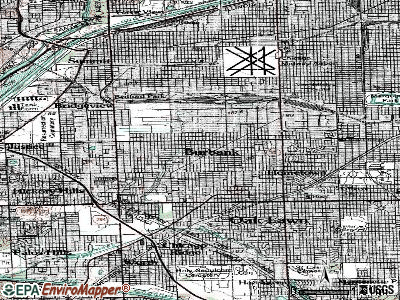
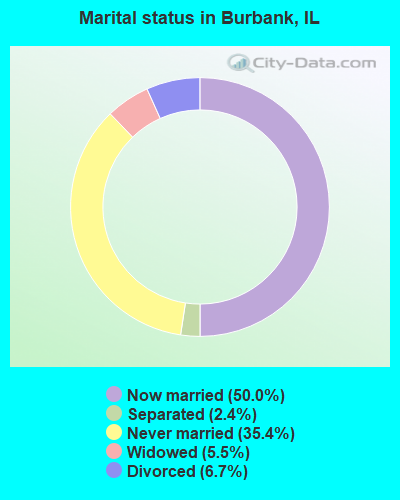
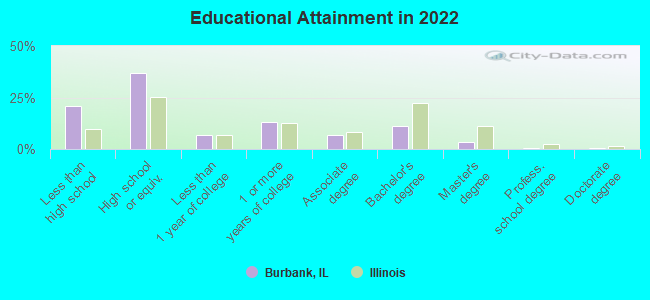
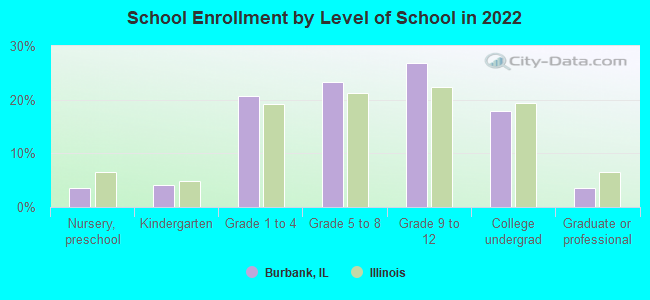
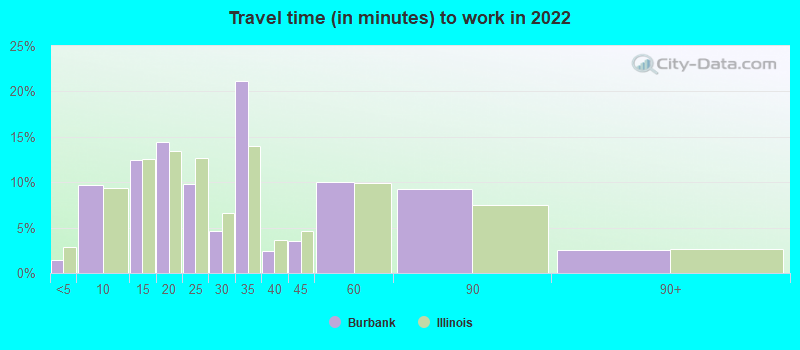
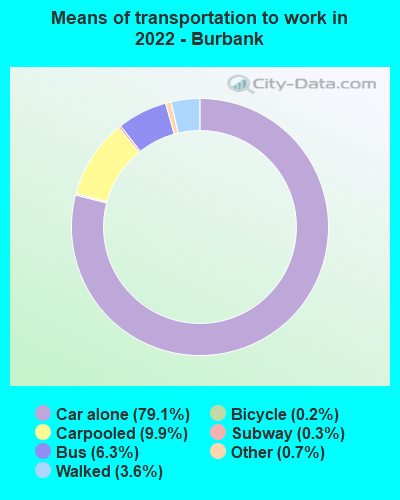


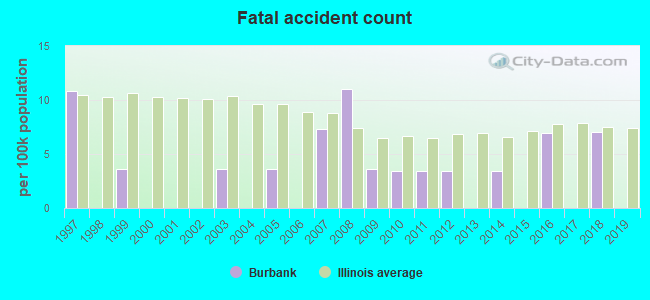
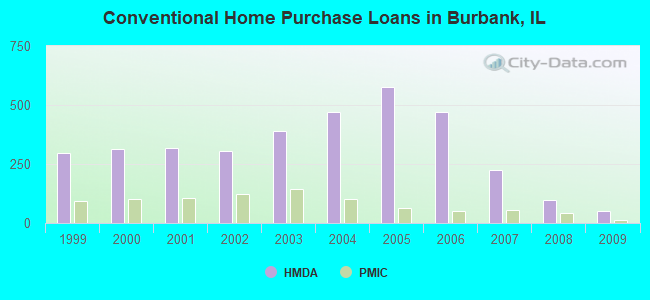
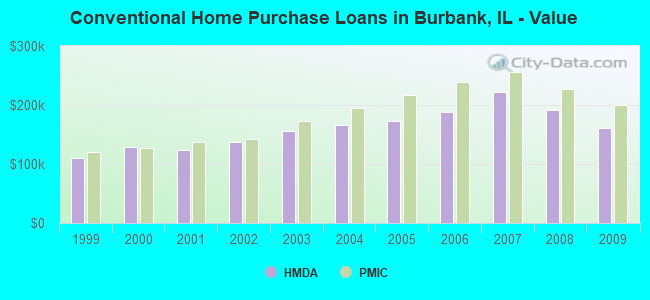
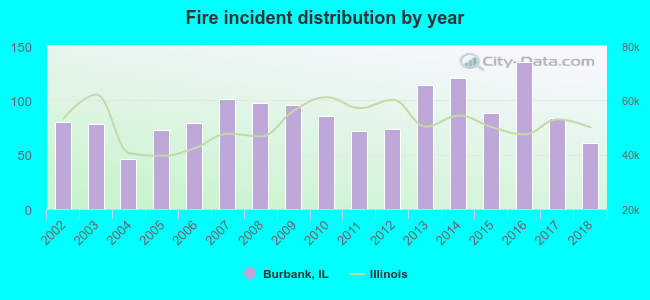 Based on the data from the years 2002 - 2018 the average number of fires per year is 87. The highest number of fire incidents - 135 took place in 2016, and the least - 46 in 2004. The data has a declining trend.
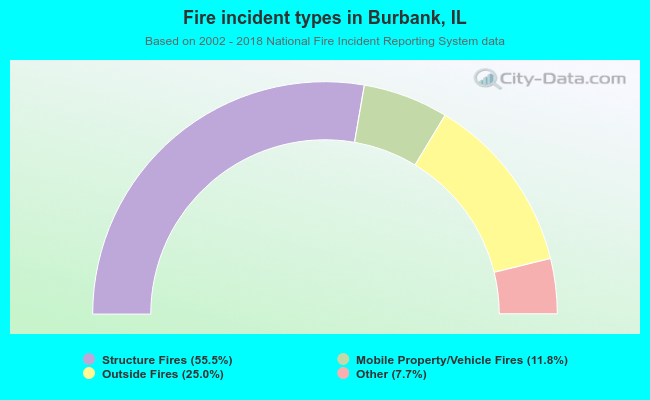 When looking into fire subcategories, the most reports belonged to: Structure Fires (55.5%), and Outside Fires (25.0%).