Oak Lawn, Illinois Submit your own pictures of this village and show them to the world
OSM Map
General Map
Google Map
MSN Map
OSM Map
General Map
Google Map
MSN Map
OSM Map
General Map
Google Map
MSN Map
OSM Map
General Map
Google Map
MSN Map
Please wait while loading the map...
Population in 2022: 56,286 (100% urban, 0% rural). Population change since 2000: +1.9%Males: 27,470 Females: 28,816
March 2022 cost of living index in Oak Lawn: 101.1 (near average, U.S. average is 100) Percentage of residents living in poverty in 2022: 10.8%for White Non-Hispanic residents , 12.8% for Black residents , 10.6% for Hispanic or Latino residents , 8.0% for other race residents , 14.2% for two or more races residents )
Profiles of local businesses
Business Search - 14 Million verified businesses
Data:
Median household income ($)
Median household income (% change since 2000)
Household income diversity
Ratio of average income to average house value (%)
Ratio of average income to average rent
Median household income ($) - White
Median household income ($) - Black or African American
Median household income ($) - Asian
Median household income ($) - Hispanic or Latino
Median household income ($) - American Indian and Alaska Native
Median household income ($) - Multirace
Median household income ($) - Other Race
Median household income for houses/condos with a mortgage ($)
Median household income for apartments without a mortgage ($)
Races - White alone (%)
Races - White alone (% change since 2000)
Races - Black alone (%)
Races - Black alone (% change since 2000)
Races - American Indian alone (%)
Races - American Indian alone (% change since 2000)
Races - Asian alone (%)
Races - Asian alone (% change since 2000)
Races - Hispanic (%)
Races - Hispanic (% change since 2000)
Races - Native Hawaiian and Other Pacific Islander alone (%)
Races - Native Hawaiian and Other Pacific Islander alone (% change since 2000)
Races - Two or more races (%)
Races - Two or more races (% change since 2000)
Races - Other race alone (%)
Races - Other race alone (% change since 2000)
Racial diversity
Unemployment (%)
Unemployment (% change since 2000)
Unemployment (%) - White
Unemployment (%) - Black or African American
Unemployment (%) - Asian
Unemployment (%) - Hispanic or Latino
Unemployment (%) - American Indian and Alaska Native
Unemployment (%) - Multirace
Unemployment (%) - Other Race
Population density (people per square mile)
Population - Males (%)
Population - Females (%)
Population - Males (%) - White
Population - Males (%) - Black or African American
Population - Males (%) - Asian
Population - Males (%) - Hispanic or Latino
Population - Males (%) - American Indian and Alaska Native
Population - Males (%) - Multirace
Population - Males (%) - Other Race
Population - Females (%) - White
Population - Females (%) - Black or African American
Population - Females (%) - Asian
Population - Females (%) - Hispanic or Latino
Population - Females (%) - American Indian and Alaska Native
Population - Females (%) - Multirace
Population - Females (%) - Other Race
Coronavirus confirmed cases (Apr 27, 2024)
Deaths caused by coronavirus (Apr 27, 2024)
Coronavirus confirmed cases (per 100k population) (Apr 27, 2024)
Deaths caused by coronavirus (per 100k population) (Apr 27, 2024)
Daily increase in number of cases (Apr 27, 2024)
Weekly increase in number of cases (Apr 27, 2024)
Cases doubled (in days) (Apr 27, 2024)
Hospitalized patients (Apr 18, 2022)
Negative test results (Apr 18, 2022)
Total test results (Apr 18, 2022)
COVID Vaccine doses distributed (per 100k population) (Sep 19, 2023)
COVID Vaccine doses administered (per 100k population) (Sep 19, 2023)
COVID Vaccine doses distributed (Sep 19, 2023)
COVID Vaccine doses administered (Sep 19, 2023)
Likely homosexual households (%)
Likely homosexual households (% change since 2000)
Likely homosexual households - Lesbian couples (%)
Likely homosexual households - Lesbian couples (% change since 2000)
Likely homosexual households - Gay men (%)
Likely homosexual households - Gay men (% change since 2000)
Cost of living index
Median gross rent ($)
Median contract rent ($)
Median monthly housing costs ($)
Median house or condo value ($)
Median house or condo value ($ change since 2000)
Mean house or condo value by units in structure - 1, detached ($)
Mean house or condo value by units in structure - 1, attached ($)
Mean house or condo value by units in structure - 2 ($)
Mean house or condo value by units in structure by units in structure - 3 or 4 ($)
Mean house or condo value by units in structure - 5 or more ($)
Mean house or condo value by units in structure - Boat, RV, van, etc. ($)
Mean house or condo value by units in structure - Mobile home ($)
Median house or condo value ($) - White
Median house or condo value ($) - Black or African American
Median house or condo value ($) - Asian
Median house or condo value ($) - Hispanic or Latino
Median house or condo value ($) - American Indian and Alaska Native
Median house or condo value ($) - Multirace
Median house or condo value ($) - Other Race
Median resident age
Resident age diversity
Median resident age - Males
Median resident age - Females
Median resident age - White
Median resident age - Black or African American
Median resident age - Asian
Median resident age - Hispanic or Latino
Median resident age - American Indian and Alaska Native
Median resident age - Multirace
Median resident age - Other Race
Median resident age - Males - White
Median resident age - Males - Black or African American
Median resident age - Males - Asian
Median resident age - Males - Hispanic or Latino
Median resident age - Males - American Indian and Alaska Native
Median resident age - Males - Multirace
Median resident age - Males - Other Race
Median resident age - Females - White
Median resident age - Females - Black or African American
Median resident age - Females - Asian
Median resident age - Females - Hispanic or Latino
Median resident age - Females - American Indian and Alaska Native
Median resident age - Females - Multirace
Median resident age - Females - Other Race
Commute - mean travel time to work (minutes)
Travel time to work - Less than 5 minutes (%)
Travel time to work - Less than 5 minutes (% change since 2000)
Travel time to work - 5 to 9 minutes (%)
Travel time to work - 5 to 9 minutes (% change since 2000)
Travel time to work - 10 to 19 minutes (%)
Travel time to work - 10 to 19 minutes (% change since 2000)
Travel time to work - 20 to 29 minutes (%)
Travel time to work - 20 to 29 minutes (% change since 2000)
Travel time to work - 30 to 39 minutes (%)
Travel time to work - 30 to 39 minutes (% change since 2000)
Travel time to work - 40 to 59 minutes (%)
Travel time to work - 40 to 59 minutes (% change since 2000)
Travel time to work - 60 to 89 minutes (%)
Travel time to work - 60 to 89 minutes (% change since 2000)
Travel time to work - 90 or more minutes (%)
Travel time to work - 90 or more minutes (% change since 2000)
Marital status - Never married (%)
Marital status - Now married (%)
Marital status - Separated (%)
Marital status - Widowed (%)
Marital status - Divorced (%)
Median family income ($)
Median family income (% change since 2000)
Median non-family income ($)
Median non-family income (% change since 2000)
Median per capita income ($)
Median per capita income (% change since 2000)
Median family income ($) - White
Median family income ($) - Black or African American
Median family income ($) - Asian
Median family income ($) - Hispanic or Latino
Median family income ($) - American Indian and Alaska Native
Median family income ($) - Multirace
Median family income ($) - Other Race
Median year house/condo built
Median year apartment built
Year house built - Built 2005 or later (%)
Year house built - Built 2000 to 2004 (%)
Year house built - Built 1990 to 1999 (%)
Year house built - Built 1980 to 1989 (%)
Year house built - Built 1970 to 1979 (%)
Year house built - Built 1960 to 1969 (%)
Year house built - Built 1950 to 1959 (%)
Year house built - Built 1940 to 1949 (%)
Year house built - Built 1939 or earlier (%)
Average household size
Household density (households per square mile)
Average household size - White
Average household size - Black or African American
Average household size - Asian
Average household size - Hispanic or Latino
Average household size - American Indian and Alaska Native
Average household size - Multirace
Average household size - Other Race
Occupied housing units (%)
Vacant housing units (%)
Owner occupied housing units (%)
Renter occupied housing units (%)
Vacancy status - For rent (%)
Vacancy status - For sale only (%)
Vacancy status - Rented or sold, not occupied (%)
Vacancy status - For seasonal, recreational, or occasional use (%)
Vacancy status - For migrant workers (%)
Vacancy status - Other vacant (%)
Residents with income below the poverty level (%)
Residents with income below 50% of the poverty level (%)
Children below poverty level (%)
Poor families by family type - Married-couple family (%)
Poor families by family type - Male, no wife present (%)
Poor families by family type - Female, no husband present (%)
Poverty status for native-born residents (%)
Poverty status for foreign-born residents (%)
Poverty among high school graduates not in families (%)
Poverty among people who did not graduate high school not in families (%)
Residents with income below the poverty level (%) - White
Residents with income below the poverty level (%) - Black or African American
Residents with income below the poverty level (%) - Asian
Residents with income below the poverty level (%) - Hispanic or Latino
Residents with income below the poverty level (%) - American Indian and Alaska Native
Residents with income below the poverty level (%) - Multirace
Residents with income below the poverty level (%) - Other Race
Air pollution - Air Quality Index (AQI)
Air pollution - CO
Air pollution - NO2
Air pollution - SO2
Air pollution - Ozone
Air pollution - PM10
Air pollution - PM25
Air pollution - Pb
Crime - Murders per 100,000 population
Crime - Rapes per 100,000 population
Crime - Robberies per 100,000 population
Crime - Assaults per 100,000 population
Crime - Burglaries per 100,000 population
Crime - Thefts per 100,000 population
Crime - Auto thefts per 100,000 population
Crime - Arson per 100,000 population
Crime - City-data.com crime index
Crime - Violent crime index
Crime - Property crime index
Crime - Murders per 100,000 population (5 year average)
Crime - Rapes per 100,000 population (5 year average)
Crime - Robberies per 100,000 population (5 year average)
Crime - Assaults per 100,000 population (5 year average)
Crime - Burglaries per 100,000 population (5 year average)
Crime - Thefts per 100,000 population (5 year average)
Crime - Auto thefts per 100,000 population (5 year average)
Crime - Arson per 100,000 population (5 year average)
Crime - City-data.com crime index (5 year average)
Crime - Violent crime index (5 year average)
Crime - Property crime index (5 year average)
1996 Presidential Elections Results (%) - Democratic Party (Clinton)
1996 Presidential Elections Results (%) - Republican Party (Dole)
1996 Presidential Elections Results (%) - Other
2000 Presidential Elections Results (%) - Democratic Party (Gore)
2000 Presidential Elections Results (%) - Republican Party (Bush)
2000 Presidential Elections Results (%) - Other
2004 Presidential Elections Results (%) - Democratic Party (Kerry)
2004 Presidential Elections Results (%) - Republican Party (Bush)
2004 Presidential Elections Results (%) - Other
2008 Presidential Elections Results (%) - Democratic Party (Obama)
2008 Presidential Elections Results (%) - Republican Party (McCain)
2008 Presidential Elections Results (%) - Other
2012 Presidential Elections Results (%) - Democratic Party (Obama)
2012 Presidential Elections Results (%) - Republican Party (Romney)
2012 Presidential Elections Results (%) - Other
2016 Presidential Elections Results (%) - Democratic Party (Clinton)
2016 Presidential Elections Results (%) - Republican Party (Trump)
2016 Presidential Elections Results (%) - Other
2020 Presidential Elections Results (%) - Democratic Party (Biden)
2020 Presidential Elections Results (%) - Republican Party (Trump)
2020 Presidential Elections Results (%) - Other
Ancestries Reported - Arab (%)
Ancestries Reported - Czech (%)
Ancestries Reported - Danish (%)
Ancestries Reported - Dutch (%)
Ancestries Reported - English (%)
Ancestries Reported - French (%)
Ancestries Reported - French Canadian (%)
Ancestries Reported - German (%)
Ancestries Reported - Greek (%)
Ancestries Reported - Hungarian (%)
Ancestries Reported - Irish (%)
Ancestries Reported - Italian (%)
Ancestries Reported - Lithuanian (%)
Ancestries Reported - Norwegian (%)
Ancestries Reported - Polish (%)
Ancestries Reported - Portuguese (%)
Ancestries Reported - Russian (%)
Ancestries Reported - Scotch-Irish (%)
Ancestries Reported - Scottish (%)
Ancestries Reported - Slovak (%)
Ancestries Reported - Subsaharan African (%)
Ancestries Reported - Swedish (%)
Ancestries Reported - Swiss (%)
Ancestries Reported - Ukrainian (%)
Ancestries Reported - United States (%)
Ancestries Reported - Welsh (%)
Ancestries Reported - West Indian (%)
Ancestries Reported - Other (%)
Educational Attainment - No schooling completed (%)
Educational Attainment - Less than high school (%)
Educational Attainment - High school or equivalent (%)
Educational Attainment - Less than 1 year of college (%)
Educational Attainment - 1 or more years of college (%)
Educational Attainment - Associate degree (%)
Educational Attainment - Bachelor's degree (%)
Educational Attainment - Master's degree (%)
Educational Attainment - Professional school degree (%)
Educational Attainment - Doctorate degree (%)
School Enrollment - Nursery, preschool (%)
School Enrollment - Kindergarten (%)
School Enrollment - Grade 1 to 4 (%)
School Enrollment - Grade 5 to 8 (%)
School Enrollment - Grade 9 to 12 (%)
School Enrollment - College undergrad (%)
School Enrollment - Graduate or professional (%)
School Enrollment - Not enrolled in school (%)
School enrollment - Public schools (%)
School enrollment - Private schools (%)
School enrollment - Not enrolled (%)
Median number of rooms in houses and condos
Median number of rooms in apartments
Housing units lacking complete plumbing facilities (%)
Housing units lacking complete kitchen facilities (%)
Density of houses
Urban houses (%)
Rural houses (%)
Households with people 60 years and over (%)
Households with people 65 years and over (%)
Households with people 75 years and over (%)
Households with one or more nonrelatives (%)
Households with no nonrelatives (%)
Population in households (%)
Family households (%)
Nonfamily households (%)
Population in families (%)
Family households with own children (%)
Median number of bedrooms in owner occupied houses
Mean number of bedrooms in owner occupied houses
Median number of bedrooms in renter occupied houses
Mean number of bedrooms in renter occupied houses
Median number of vehichles in owner occupied houses
Mean number of vehichles in owner occupied houses
Median number of vehichles in renter occupied houses
Mean number of vehichles in renter occupied houses
Mortgage status - with mortgage (%)
Mortgage status - with second mortgage (%)
Mortgage status - with home equity loan (%)
Mortgage status - with both second mortgage and home equity loan (%)
Mortgage status - without a mortgage (%)
Average family size
Average family size - White
Average family size - Black or African American
Average family size - Asian
Average family size - Hispanic or Latino
Average family size - American Indian and Alaska Native
Average family size - Multirace
Average family size - Other Race
Geographical mobility - Same house 1 year ago (%)
Geographical mobility - Moved within same county (%)
Geographical mobility - Moved from different county within same state (%)
Geographical mobility - Moved from different state (%)
Geographical mobility - Moved from abroad (%)
Place of birth - Born in state of residence (%)
Place of birth - Born in other state (%)
Place of birth - Native, outside of US (%)
Place of birth - Foreign born (%)
Housing units in structures - 1, detached (%)
Housing units in structures - 1, attached (%)
Housing units in structures - 2 (%)
Housing units in structures - 3 or 4 (%)
Housing units in structures - 5 to 9 (%)
Housing units in structures - 10 to 19 (%)
Housing units in structures - 20 to 49 (%)
Housing units in structures - 50 or more (%)
Housing units in structures - Mobile home (%)
Housing units in structures - Boat, RV, van, etc. (%)
House/condo owner moved in on average (years ago)
Renter moved in on average (years ago)
Year householder moved into unit - Moved in 1999 to March 2000 (%)
Year householder moved into unit - Moved in 1995 to 1998 (%)
Year householder moved into unit - Moved in 1990 to 1994 (%)
Year householder moved into unit - Moved in 1980 to 1989 (%)
Year householder moved into unit - Moved in 1970 to 1979 (%)
Year householder moved into unit - Moved in 1969 or earlier (%)
Means of transportation to work - Drove car alone (%)
Means of transportation to work - Carpooled (%)
Means of transportation to work - Public transportation (%)
Means of transportation to work - Bus or trolley bus (%)
Means of transportation to work - Streetcar or trolley car (%)
Means of transportation to work - Subway or elevated (%)
Means of transportation to work - Railroad (%)
Means of transportation to work - Ferryboat (%)
Means of transportation to work - Taxicab (%)
Means of transportation to work - Motorcycle (%)
Means of transportation to work - Bicycle (%)
Means of transportation to work - Walked (%)
Means of transportation to work - Other means (%)
Working at home (%)
Industry diversity
Most Common Industries - Agriculture, forestry, fishing and hunting, and mining (%)
Most Common Industries - Agriculture, forestry, fishing and hunting (%)
Most Common Industries - Mining, quarrying, and oil and gas extraction (%)
Most Common Industries - Construction (%)
Most Common Industries - Manufacturing (%)
Most Common Industries - Wholesale trade (%)
Most Common Industries - Retail trade (%)
Most Common Industries - Transportation and warehousing, and utilities (%)
Most Common Industries - Transportation and warehousing (%)
Most Common Industries - Utilities (%)
Most Common Industries - Information (%)
Most Common Industries - Finance and insurance, and real estate and rental and leasing (%)
Most Common Industries - Finance and insurance (%)
Most Common Industries - Real estate and rental and leasing (%)
Most Common Industries - Professional, scientific, and management, and administrative and waste management services (%)
Most Common Industries - Professional, scientific, and technical services (%)
Most Common Industries - Management of companies and enterprises (%)
Most Common Industries - Administrative and support and waste management services (%)
Most Common Industries - Educational services, and health care and social assistance (%)
Most Common Industries - Educational services (%)
Most Common Industries - Health care and social assistance (%)
Most Common Industries - Arts, entertainment, and recreation, and accommodation and food services (%)
Most Common Industries - Arts, entertainment, and recreation (%)
Most Common Industries - Accommodation and food services (%)
Most Common Industries - Other services, except public administration (%)
Most Common Industries - Public administration (%)
Occupation diversity
Most Common Occupations - Management, business, science, and arts occupations (%)
Most Common Occupations - Management, business, and financial occupations (%)
Most Common Occupations - Management occupations (%)
Most Common Occupations - Business and financial operations occupations (%)
Most Common Occupations - Computer, engineering, and science occupations (%)
Most Common Occupations - Computer and mathematical occupations (%)
Most Common Occupations - Architecture and engineering occupations (%)
Most Common Occupations - Life, physical, and social science occupations (%)
Most Common Occupations - Education, legal, community service, arts, and media occupations (%)
Most Common Occupations - Community and social service occupations (%)
Most Common Occupations - Legal occupations (%)
Most Common Occupations - Education, training, and library occupations (%)
Most Common Occupations - Arts, design, entertainment, sports, and media occupations (%)
Most Common Occupations - Healthcare practitioners and technical occupations (%)
Most Common Occupations - Health diagnosing and treating practitioners and other technical occupations (%)
Most Common Occupations - Health technologists and technicians (%)
Most Common Occupations - Service occupations (%)
Most Common Occupations - Healthcare support occupations (%)
Most Common Occupations - Protective service occupations (%)
Most Common Occupations - Fire fighting and prevention, and other protective service workers including supervisors (%)
Most Common Occupations - Law enforcement workers including supervisors (%)
Most Common Occupations - Food preparation and serving related occupations (%)
Most Common Occupations - Building and grounds cleaning and maintenance occupations (%)
Most Common Occupations - Personal care and service occupations (%)
Most Common Occupations - Sales and office occupations (%)
Most Common Occupations - Sales and related occupations (%)
Most Common Occupations - Office and administrative support occupations (%)
Most Common Occupations - Natural resources, construction, and maintenance occupations (%)
Most Common Occupations - Farming, fishing, and forestry occupations (%)
Most Common Occupations - Construction and extraction occupations (%)
Most Common Occupations - Installation, maintenance, and repair occupations (%)
Most Common Occupations - Production, transportation, and material moving occupations (%)
Most Common Occupations - Production occupations (%)
Most Common Occupations - Transportation occupations (%)
Most Common Occupations - Material moving occupations (%)
People in Group quarters - Institutionalized population (%)
People in Group quarters - Correctional institutions (%)
People in Group quarters - Federal prisons and detention centers (%)
People in Group quarters - Halfway houses (%)
People in Group quarters - Local jails and other confinement facilities (including police lockups) (%)
People in Group quarters - Military disciplinary barracks (%)
People in Group quarters - State prisons (%)
People in Group quarters - Other types of correctional institutions (%)
People in Group quarters - Nursing homes (%)
People in Group quarters - Hospitals/wards, hospices, and schools for the handicapped (%)
People in Group quarters - Hospitals/wards and hospices for chronically ill (%)
People in Group quarters - Hospices or homes for chronically ill (%)
People in Group quarters - Military hospitals or wards for chronically ill (%)
People in Group quarters - Other hospitals or wards for chronically ill (%)
People in Group quarters - Hospitals or wards for drug/alcohol abuse (%)
People in Group quarters - Mental (Psychiatric) hospitals or wards (%)
People in Group quarters - Schools, hospitals, or wards for the mentally retarded (%)
People in Group quarters - Schools, hospitals, or wards for the physically handicapped (%)
People in Group quarters - Institutions for the deaf (%)
People in Group quarters - Institutions for the blind (%)
People in Group quarters - Orthopedic wards and institutions for the physically handicapped (%)
People in Group quarters - Wards in general hospitals for patients who have no usual home elsewhere (%)
People in Group quarters - Wards in military hospitals for patients who have no usual home elsewhere (%)
People in Group quarters - Juvenile institutions (%)
People in Group quarters - Long-term care (%)
People in Group quarters - Homes for abused, dependent, and neglected children (%)
People in Group quarters - Residential treatment centers for emotionally disturbed children (%)
People in Group quarters - Training schools for juvenile delinquents (%)
People in Group quarters - Short-term care, detention or diagnostic centers for delinquent children (%)
People in Group quarters - Type of juvenile institution unknown (%)
People in Group quarters - Noninstitutionalized population (%)
People in Group quarters - College dormitories (includes college quarters off campus) (%)
People in Group quarters - Military quarters (%)
People in Group quarters - On base (%)
People in Group quarters - Barracks, unaccompanied personnel housing (UPH), (Enlisted/Officer), ;and similar group living quarters for military personnel (%)
People in Group quarters - Transient quarters for temporary residents (%)
People in Group quarters - Military ships (%)
People in Group quarters - Group homes (%)
People in Group quarters - Homes or halfway houses for drug/alcohol abuse (%)
People in Group quarters - Homes for the mentally ill (%)
People in Group quarters - Homes for the mentally retarded (%)
People in Group quarters - Homes for the physically handicapped (%)
People in Group quarters - Other group homes (%)
People in Group quarters - Religious group quarters (%)
People in Group quarters - Dormitories (%)
People in Group quarters - Agriculture workers' dormitories on farms (%)
People in Group quarters - Job Corps and vocational training facilities (%)
People in Group quarters - Other workers' dormitories (%)
People in Group quarters - Crews of maritime vessels (%)
People in Group quarters - Other nonhousehold living situations (%)
People in Group quarters - Other noninstitutional group quarters (%)
Residents speaking English at home (%)
Residents speaking English at home - Born in the United States (%)
Residents speaking English at home - Native, born elsewhere (%)
Residents speaking English at home - Foreign born (%)
Residents speaking Spanish at home (%)
Residents speaking Spanish at home - Born in the United States (%)
Residents speaking Spanish at home - Native, born elsewhere (%)
Residents speaking Spanish at home - Foreign born (%)
Residents speaking other language at home (%)
Residents speaking other language at home - Born in the United States (%)
Residents speaking other language at home - Native, born elsewhere (%)
Residents speaking other language at home - Foreign born (%)
Class of Workers - Employee of private company (%)
Class of Workers - Self-employed in own incorporated business (%)
Class of Workers - Private not-for-profit wage and salary workers (%)
Class of Workers - Local government workers (%)
Class of Workers - State government workers (%)
Class of Workers - Federal government workers (%)
Class of Workers - Self-employed workers in own not incorporated business and Unpaid family workers (%)
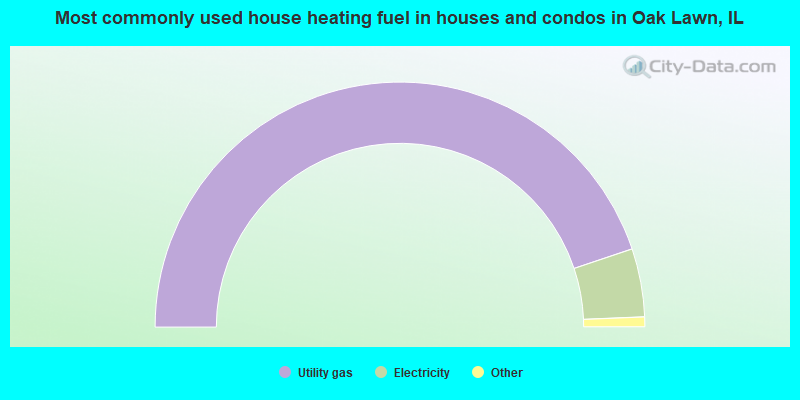
House heating fuel used in houses and condos - Utility gas (%)
House heating fuel used in houses and condos - Bottled, tank, or LP gas (%)
House heating fuel used in houses and condos - Electricity (%)
House heating fuel used in houses and condos - Fuel oil, kerosene, etc. (%)
House heating fuel used in houses and condos - Coal or coke (%)
House heating fuel used in houses and condos - Wood (%)
House heating fuel used in houses and condos - Solar energy (%)
House heating fuel used in houses and condos - Other fuel (%)
House heating fuel used in houses and condos - No fuel used (%)
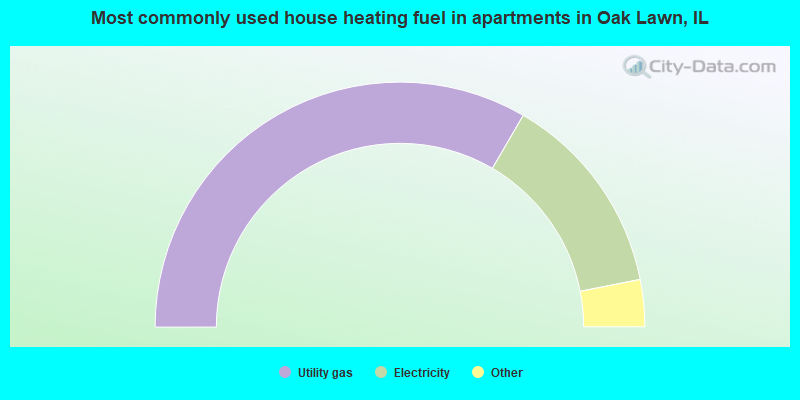
House heating fuel used in apartments - Utility gas (%)
House heating fuel used in apartments - Bottled, tank, or LP gas (%)
House heating fuel used in apartments - Electricity (%)
House heating fuel used in apartments - Fuel oil, kerosene, etc. (%)
House heating fuel used in apartments - Coal or coke (%)
House heating fuel used in apartments - Wood (%)
House heating fuel used in apartments - Solar energy (%)
House heating fuel used in apartments - Other fuel (%)
House heating fuel used in apartments - No fuel used (%)
Armed forces status - In Armed Forces (%)
Armed forces status - Civilian (%)
Armed forces status - Civilian - Veteran (%)
Armed forces status - Civilian - Nonveteran (%)
Fatal accidents locations in years 2005-2021
Fatal accidents locations in 2005
Fatal accidents locations in 2006
Fatal accidents locations in 2007
Fatal accidents locations in 2008
Fatal accidents locations in 2009
Fatal accidents locations in 2010
Fatal accidents locations in 2011
Fatal accidents locations in 2012
Fatal accidents locations in 2013
Fatal accidents locations in 2014
Fatal accidents locations in 2015
Fatal accidents locations in 2016
Fatal accidents locations in 2017
Fatal accidents locations in 2018
Fatal accidents locations in 2019
Fatal accidents locations in 2020
Fatal accidents locations in 2021
Alcohol use - People drinking some alcohol every month (%)
Alcohol use - People not drinking at all (%)
Alcohol use - Average days/month drinking alcohol
Alcohol use - Average drinks/week
Alcohol use - Average days/year people drink much
Audiometry - Average condition of hearing (%)
Audiometry - People that can hear a whisper from across a quiet room (%)
Audiometry - People that can hear normal voice from across a quiet room (%)
Audiometry - Ears ringing, roaring, buzzing (%)
Audiometry - Had a job exposure to loud noise (%)
Audiometry - Had off-work exposure to loud noise (%)
Blood Pressure & Cholesterol - Has high blood pressure (%)
Blood Pressure & Cholesterol - Checking blood pressure at home (%)
Blood Pressure & Cholesterol - Frequently checking blood cholesterol (%)
Blood Pressure & Cholesterol - Has high cholesterol level (%)
Consumer Behavior - Money monthly spent on food at supermarket/grocery store
Consumer Behavior - Money monthly spent on food at other stores
Consumer Behavior - Money monthly spent on eating out
Consumer Behavior - Money monthly spent on carryout/delivered foods
Consumer Behavior - Income spent on food at supermarket/grocery store (%)
Consumer Behavior - Income spent on food at other stores (%)
Consumer Behavior - Income spent on eating out (%)
Consumer Behavior - Income spent on carryout/delivered foods (%)
Current Health Status - General health condition (%)
Current Health Status - Blood donors (%)
Current Health Status - Has blood ever tested for HIV virus (%)
Current Health Status - Left-handed people (%)
Dermatology - People using sunscreen (%)
Diabetes - Diabetics (%)
Diabetes - Had a blood test for high blood sugar (%)
Diabetes - People taking insulin (%)
Diet Behavior & Nutrition - Diet health (%)
Diet Behavior & Nutrition - Milk product consumption (# of products/month)
Diet Behavior & Nutrition - Meals not home prepared (#/week)
Diet Behavior & Nutrition - Meals from fast food or pizza place (#/week)
Diet Behavior & Nutrition - Ready-to-eat foods (#/month)
Diet Behavior & Nutrition - Frozen meals/pizza (#/month)
Drug Use - People that ever used marijuana or hashish (%)
Drug Use - Ever used hard drugs (%)
Drug Use - Ever used any form of cocaine (%)
Drug Use - Ever used heroin (%)
Drug Use - Ever used methamphetamine (%)
Health Insurance - People covered by health insurance (%)
Kidney Conditions-Urology - Avg. # of times urinating at night
Medical Conditions - People with asthma (%)
Medical Conditions - People with anemia (%)
Medical Conditions - People with psoriasis (%)
Medical Conditions - People with overweight (%)
Medical Conditions - Elderly people having difficulties in thinking or remembering (%)
Medical Conditions - People who ever received blood transfusion (%)
Medical Conditions - People having trouble seeing even with glass/contacts (%)
Medical Conditions - People with arthritis (%)
Medical Conditions - People with gout (%)
Medical Conditions - People with congestive heart failure (%)
Medical Conditions - People with coronary heart disease (%)
Medical Conditions - People with angina pectoris (%)
Medical Conditions - People who ever had heart attack (%)
Medical Conditions - People who ever had stroke (%)
Medical Conditions - People with emphysema (%)
Medical Conditions - People with thyroid problem (%)
Medical Conditions - People with chronic bronchitis (%)
Medical Conditions - People with any liver condition (%)
Medical Conditions - People who ever had cancer or malignancy (%)
Mental Health - People who have little interest in doing things (%)
Mental Health - People feeling down, depressed, or hopeless (%)
Mental Health - People who have trouble sleeping or sleeping too much (%)
Mental Health - People feeling tired or having little energy (%)
Mental Health - People with poor appetite or overeating (%)
Mental Health - People feeling bad about themself (%)
Mental Health - People who have trouble concentrating on things (%)
Mental Health - People moving or speaking slowly or too fast (%)
Mental Health - People having thoughts they would be better off dead (%)
Oral Health - Average years since last visit a dentist
Oral Health - People embarrassed because of mouth (%)
Oral Health - People with gum disease (%)
Oral Health - General health of teeth and gums (%)
Oral Health - Average days a week using dental floss/device
Oral Health - Average days a week using mouthwash for dental problem
Oral Health - Average number of teeth
Pesticide Use - Households using pesticides to control insects (%)
Pesticide Use - Households using pesticides to kill weeds (%)
Physical Activity - People doing vigorous-intensity work activities (%)
Physical Activity - People doing moderate-intensity work activities (%)
Physical Activity - People walking or bicycling (%)
Physical Activity - People doing vigorous-intensity recreational activities (%)
Physical Activity - People doing moderate-intensity recreational activities (%)
Physical Activity - Average hours a day doing sedentary activities
Physical Activity - Average hours a day watching TV or videos
Physical Activity - Average hours a day using computer
Physical Functioning - People having limitations keeping them from working (%)
Physical Functioning - People limited in amount of work they can do (%)
Physical Functioning - People that need special equipment to walk (%)
Physical Functioning - People experiencing confusion/memory problems (%)
Physical Functioning - People requiring special healthcare equipment (%)
Prescription Medications - Average number of prescription medicines taking
Preventive Aspirin Use - Adults 40+ taking low-dose aspirin (%)
Reproductive Health - Vaginal deliveries (%)
Reproductive Health - Cesarean deliveries (%)
Reproductive Health - Deliveries resulted in a live birth (%)
Reproductive Health - Pregnancies resulted in a delivery (%)
Reproductive Health - Women breastfeeding newborns (%)
Reproductive Health - Women that had a hysterectomy (%)
Reproductive Health - Women that had both ovaries removed (%)
Reproductive Health - Women that have ever taken birth control pills (%)
Reproductive Health - Women taking birth control pills (%)
Reproductive Health - Women that have ever used Depo-Provera or injectables (%)
Reproductive Health - Women that have ever used female hormones (%)
Sexual Behavior - People 18+ that ever had sex (vaginal, anal, or oral) (%)
Sexual Behavior - Males 18+ that ever had vaginal sex with a woman (%)
Sexual Behavior - Males 18+ that ever performed oral sex on a woman (%)
Sexual Behavior - Males 18+ that ever had anal sex with a woman (%)
Sexual Behavior - Males 18+ that ever had any sex with a man (%)
Sexual Behavior - Females 18+ that ever had vaginal sex with a man (%)
Sexual Behavior - Females 18+ that ever performed oral sex on a man (%)
Sexual Behavior - Females 18+ that ever had anal sex with a man (%)
Sexual Behavior - Females 18+ that ever had any kind of sex with a woman (%)
Sexual Behavior - Average age people first had sex
Sexual Behavior - Average number of female sex partners in lifetime (males 18+)
Sexual Behavior - Average number of female vaginal sex partners in lifetime (males 18+)
Sexual Behavior - Average age people first performed oral sex on a woman (18+)
Sexual Behavior - Average number of woman performed oral sex on in lifetime (18+)
Sexual Behavior - Average number of male sex partners in lifetime (males 18+)
Sexual Behavior - Average number of male anal sex partners in lifetime (males 18+)
Sexual Behavior - Average age people first performed oral sex on a man (18+)
Sexual Behavior - Average number of male oral sex partners in lifetime (18+)
Sexual Behavior - People using protection when performing oral sex (%)
Sexual Behavior - Average number of times people have vaginal or anal sex a year
Sexual Behavior - People having sex without condom (%)
Sexual Behavior - Average number of male sex partners in lifetime (females 18+)
Sexual Behavior - Average number of male vaginal sex partners in lifetime (females 18+)
Sexual Behavior - Average number of female sex partners in lifetime (females 18+)
Sexual Behavior - Circumcised males 18+ (%)
Sleep Disorders - Average hours sleeping at night
Sleep Disorders - People that has trouble sleeping (%)
Smoking-Cigarette Use - People smoking cigarettes (%)
Taste & Smell - People 40+ having problems with smell (%)
Taste & Smell - People 40+ having problems with taste (%)
Taste & Smell - People 40+ that ever had wisdom teeth removed (%)
Taste & Smell - People 40+ that ever had tonsils teeth removed (%)
Taste & Smell - People 40+ that ever had a loss of consciousness because of a head injury (%)
Taste & Smell - People 40+ that ever had a broken nose or other serious injury to face or skull (%)
Taste & Smell - People 40+ that ever had two or more sinus infections (%)
Weight - Average height (inches)
Weight - Average weight (pounds)
Weight - Average BMI
Weight - People that are obese (%)
Weight - People that ever were obese (%)
Weight - People trying to lose weight (%)
According to our research of Illinois and other state lists, there were 38 registered sex offenders living in Oak Lawn, Illinois as of April 27, 2024 . The ratio of all residents to sex offenders in Oak Lawn is 1,487 to 1.The ratio of registered sex offenders to all residents in this city is lower than the state average.
Officers per 1,000 residents here:
2.04Illinois average:
3.06
Latest news from Oak Lawn, IL collected exclusively by city-data.com from local newspapers, TV, and radio stations
Ancestries: Irish (12.8%), Polish (11.8%), Italian (4.4%), German (4.3%), Arab (3.8%), American (3.7%).
Current Local Time:
Incorporated on 05/13/1909
Land area: 8.60 square miles.
Population density: 6,548 people per square mile (high).
9,407 residents are foreign born (5.5% Europe , 5.3% Asia , 5.0% Latin America ).
This village:
16.7%Illinois:
14.1%
Median real estate property taxes paid for housing units with mortgages in 2022: $5,929 (2.3%)Median real estate property taxes paid for housing units with no mortgage in 2022: $5,717 (2.2%)
Nearest city with pop. 200,000+: Chicago, IL
Nearest cities:
Latitude: 41.72 N, Longitude: 87.75 W
Daytime population change due to commuting: -2,937 (-5.2%)Workers who live and work in this village: 5,359 (20.5%)
Single-family new house construction building permits:
2022: 8 buildings , average cost: $278,8002021: 13 buildings , average cost: $297,1002020: 17 buildings , average cost: $215,0002019: 13 buildings , average cost: $233,8002018: 3 buildings , average cost: $263,3002017: 9 buildings , average cost: $218,3002016: 14 buildings , average cost: $214,6002015: 10 buildings , average cost: $174,5002014: 5 buildings , average cost: $215,8002013: 6 buildings , average cost: $202,0002012: 5 buildings , average cost: $149,7002011: 2 buildings , average cost: $230,0002010: 5 buildings , average cost: $180,2002009: 1 building , cost: $250,0002008: 11 buildings , average cost: $202,1002007: 30 buildings , average cost: $218,9002006: 56 buildings , average cost: $200,1002005: 66 buildings , average cost: $198,5002004: 49 buildings , average cost: $169,4002003: 57 buildings , average cost: $148,4002002: 106 buildings , average cost: $105,2002001: 84 buildings , average cost: $125,6002000: 68 buildings , average cost: $96,6001999: 86 buildings , average cost: $107,8001998: 56 buildings , average cost: $97,9001997: 65 buildings , average cost: $109,500Unemployment in December 2023:
Most common occupations in Oak Lawn, IL (%)
Both Males Females
Other office and administrative support workers, including supervisors (4.8%)
Secretaries and administrative assistants (4.4%)
Other sales and related occupations, including supervisors (3.7%)
Electrical equipment mechanics and other installation, maintenance, and repair workers, including supervisors (3.5%)
Other management occupations, except farmers and farm managers (3.3%)
Driver/sales workers and truck drivers (3.2%)
Material recording, scheduling, dispatching, and distributing workers (3.2%)
Electrical equipment mechanics and other installation, maintenance, and repair workers, including supervisors (6.3%)
Driver/sales workers and truck drivers (5.9%)
Other sales and related occupations, including supervisors (4.8%)
Other production occupations, including supervisors (4.5%)
Material recording, scheduling, dispatching, and distributing workers (4.2%)
Sales representatives, services, wholesale and manufacturing (4.1%)
Other management occupations, except farmers and farm managers (3.9%)
Secretaries and administrative assistants (9.1%)
Other office and administrative support workers, including supervisors (7.6%)
Registered nurses (5.5%)
Preschool, kindergarten, elementary, and middle school teachers (5.4%)
Information and record clerks, except customer service representatives (4.9%)
Cashiers (3.8%)
Retail sales workers, except cashiers (3.1%)
Tornado activity:
Oak Lawn-area historical tornado activity is near Illinois state average. It is 53% greater than the overall U.S. average.
On 8/28/1990, a category F5 (max. wind speeds 261-318 mph) tornado 22.4 miles away from the Oak Lawn village center killed 29 people and injured 350 people and caused between $50,000 and $500,000 in damages.
On 4/21/1967, a category F4 (max. wind speeds 207-260 mph) tornado 5.0 miles away from the village center killed 33 people and injured 500 people and caused between $5,000,000 and $50,000,000 in damages.
Earthquake activity:
Oak Lawn-area historical earthquake activity is significantly above Illinois state average. It is 42% greater than the overall U.S. average. On 4/18/2008 at 09:36:59, a magnitude 5.4 (5.1 MB, 4.8 MS, 5.4 MW, 5.2 MW, Class: Moderate, Intensity: VI - VII) earthquake occurred 225.8 miles away from the city center On 6/10/1987 at 23:48:54, a magnitude 5.1 (4.9 MB, 4.4 MS, 4.6 MS, 5.1 LG) earthquake occurred 200.3 miles away from Oak Lawn center On 4/18/2008 at 09:36:59, a magnitude 5.2 (5.2 MW, Depth: 8.9 mi) earthquake occurred 225.8 miles away from the city center On 6/28/2004 at 06:10:52, a magnitude 4.2 (4.2 MW, Depth: 6.2 mi, Class: Light, Intensity: IV - V) earthquake occurred 61.9 miles away from Oak Lawn center On 6/18/2002 at 17:37:15, a magnitude 5.0 (4.3 MB, 4.6 MW, 5.0 LG) earthquake occurred 257.9 miles away from the city center On 4/18/2008 at 15:14:16, a magnitude 4.8 (4.5 MB, 4.8 MW, 4.6 MW) earthquake occurred 224.1 miles away from the city center Magnitude types: regional Lg-wave magnitude (LG), body-wave magnitude (MB), surface-wave magnitude (MS), moment magnitude (MW) Natural disasters: The number of natural disasters in Cook County (20) is greater than the US average (15).Major Disasters (Presidential) Declared: 15Emergencies Declared: 4Floods: 13, Storms: 12, Tornadoes: 3, Snowstorms: 2, Winter Storms: 2, Blizzard: 1, Hurricane: 1, Snow: 1, Wind: 1, Other: 1 (Note: some incidents may be assigned to more than one category). Hospitals in Oak Lawn: ADVOCATE CHRIST HOSPITAL & MEDICAL CENTER (Voluntary non-profit - Church, provides emergency services, 4440 W 95TH STREET) HOSPICE OF LITTLE CO OF MARY H (9800 SOUTHWEST HIGHWAY) Nursing Homes in Oak Lawn: CONCORD NURSING AND REHAB CENTER (9401 SOUTH RIDGELAND AVENUE) MANORCARE OF OAK LAWN EAST (9401 SOUTH KOSTNER AVENUE) MANORCARE OF OAK LAWN WEST (6300 WEST 95TH STREET) OAK LAWN CONV HOME (9525 S MAYFIELD AVE) OAK LAWN RESPIRATORY AND REHAB (9525 SOUTH MAYFIELD) Dialysis Facilities in Oak Lawn: STONY CREEK DIALYSIS (9115 S CICERO AVENUE) Home Health Centers in Oak Lawn: ACTIVE HOME HEALTH CARE SERV (4700 W 95TH STREET, STE 203) ALL AMERICAN HOME CARE, INC (6815 WEST 95TH STREET, STE 7, 3RD FLOOR) F J HOME HEALTH CARE INC (4507 WEST 95TH STREET) HOME HEALTH PROVIDERS, PC (9115 SOUTH CICERO AVENUE, 2ND FLOOR) INTEGRITY HOME HEALTHCARE, INC (6535 CRESCENT COURT) LAKEWOOD HOME HEALTH CARE (9205 S KEATING) LITTLE COMPANY OF MARY HOSPITAL (9800 SOUTHWEST HIGHWAY) PHYSICIANS PREFERRED HOME CARE, INC (9732 SOUTHWEST HWY) PLATINUM HOME HEALTH CARE, INC (4903 WEST 95TH STREET) SACRED HEART HOME HEALTH, INC (9850 S CICERO AVE, STE 6) SUNNY HILL HOME HEALTH CARE, INC (4632 W 105TH PLACE) Heliports located in Oak Lawn: Amtrak stations near Oak Lawn: 7 miles: SUMMIT (ARCHER & CENTER AVE.) Services: public payphones, free short-term parking, free long-term parking, call for taxi service, public transit connection.
10 miles: LA GRANGE ROAD (LA GRANGE, 25 W. BURLINGTON AVE.) Services: enclosed waiting area, public payphones, taxi stand, public transit connection.
12 miles: HOMEWOOD (181 1ST ST. & PARK AVE.) Services: ticket office, enclosed waiting area, public restrooms, public payphones, paid short-term parking, paid long-term parking, public transit connection.
College/University in Oak Lawn: Cameo Beauty Academy Full-time enrollment: 111; Location: 9714 S Cicero; Private, for-profit; Website: www.cameobeautyacademy.com)
Colleges/universities with over 2000 students nearest to Oak Lawn:
Saint Xavier University (about 3 miles; Chicago, IL ; Full-time enrollment: 3,576)
City Colleges of Chicago-Richard J Daley College (about 4 miles; Chicago, IL ; FT enrollment: 7,497)
Moraine Valley Community College (about 5 miles; Palos Hills, IL ; FT enrollment: 12,008)
City Colleges of Chicago-Kennedy-King College (about 8 miles; Chicago, IL ; FT enrollment: 5,044)
Chicago State University (about 8 miles; Chicago, IL ; FT enrollment: 4,352)
Morton College (about 8 miles; Cicero, IL ; FT enrollment: 3,236)
City Colleges of Chicago-Olive-Harvey College (about 9 miles; Chicago, IL ; FT enrollment: 4,110)
Public high schools in Oak Lawn:
Private high school in Oak Lawn: SOUTH SIDE BAPTIST SCHOOL Students: 138, Location: 5220 W. 105TH ST., Grades: PK-12)
Biggest public elementary/middle schools in Oak Lawn: OAK LAWN-HOMETOWN MIDDLE SCH Students: 1,038, Location: 5345 W 99TH ST, Grades: 6-8)HARNEW ELEM SCHOOL Students: 643, Location: 9101 MEADE AVE, Grades: PK-5)SIMMONS MIDDLE SCHOOL Students: 513, Location: 6450 W 95TH ST, Grades: 6-8)SWARD ELEM SCHOOL Students: 389, Location: 9830 BRANDT AVE, Grades: KG-5)J COVINGTON ELEM SCHOOL Students: 378, Location: 9130 S 52ND AVE, Grades: KG-5)KOLMAR AVENUE ELEM SCHOOL Students: 367, Location: 10425 S KOLMAR AVE, Grades: PK-5)COLUMBUS MANOR ELEM SCHOOL Students: 367, Location: 9700 MAYFIELD AVE, Grades: PK-5)J M HANNUM ELEM SCHOOL Students: 349, Location: 9800 S TRIPP AVE, Grades: KG-5)ERNEST F KOLB ELEM SCHOOL Students: 348, Location: 9620 NORMANDY AVE, Grades: KG-5)LAWN MANOR SCHOOL Students: 247, Location: 4300 W 108TH PL, Grades: PK-2)Private elementary/middle schools in Oak Lawn: ST CATHERINE OF ALEXANDRIA SCHOOL Students: 440, Location: 10621 S KEDVALE AVE, Grades: PK-8)
ST GERALD SCHOOL Students: 414, Location: 9320 S 55TH CT, Grades: PK-8)
ST LINUS ELEMENTARY SCHOOL Students: 364, Location: 10400 LAWLER AVE, Grades: PK-8)
ST GERMAINE SCHOOL Students: 305, Location: 9735 S KOLIN AVE, Grades: PK-8)
ST LOUIS DE MONTFORT SCHOOL Students: 239, Location: 8840 RIDGELAND AVE, Grades: PK-8)
ST PAUL LUTHERAN SCHOOL Students: 113, Location: 4660 W 94TH ST, Grades: PK-8)
See full list of schools located in Oak Lawn Library in Oak Lawn: OAK LAWN PUBLIC LIBRARY Operating income: $4,564,217; Location: 9427 SOUTH RAYMOND AVENUE; 316,815 books ; 768 e-books ; 19,460 audio materials ; 14,144 video materials ; 20 local licensed databases ; 15 state licensed databases ; 708 print serial subscriptions ; 64 electronic serial subscriptions )
User-submitted facts and corrections:
Lincoln Technical Institute no longer exists in Oak Lawn
Lincoln Tech was knocked down and rebuilt as an auto dealer. Very nice town summary. added by Dickie Jim
Notable locations in Oak Lawn: (A) , Oak Lawn Village Hall (B) , Oak Lawn Fire Department Station 1 (C) , Oak Lawn Fire Department Station 3 (D) , Oak Lawn Fire Department Station 2 (E) , Oak Lawn Public Library (F) . Display/hide their locations on the map
Shopping Centers: (1) , State Road Plaza Shopping Center (2) . Display/hide their locations on the map
Churches in Oak Lawn include: (A) , Saint Marys Church (B) , Saint Nicholas Hellenic Orthodox Church (C) , Elim Evangelical Free Church (D) , First Church of the Nazarene (E) , Hope Chapel Foursquare Church (F) , Kedvale Avenue Christian Reformed Church (G) , Oak Lawn Bible Chapel (H) , Oak Lawn Bible Church (I) . Display/hide their locations on the map
Cemetery: (1) . Display/hide its location on the map
Parks in Oak Lawn include: (1) , Wolfe Wildlife Refuge (2) , Lewandowski Park (3) , Brandt Park (4) , Dillon Park (5) , Columbus Manor Park (6) , Centennial Park (7) , Worthbrook Park (8) , Central Park (9) . Display/hide their locations on the map
Tourist attractions:
Hotels:
Court:
Birthplace of: Robb Thompson - Christian cleric, Billy Sawilchik - Rock guitarist, Bobby Madritsch - 2005 Major League Baseball player (Seattle Mariners, born : Feb 28, 1976), Dan Donegan - Rock guitarist, Marc Rzepczynski - Baseball player, Mary Lou Studnicka - Baseball player, Mike Mollo - Boxer, Rob Mackowiak - 2005 Major League Baseball player (Pittsburgh Pirates, born : Jun 20, 1976), Rory Markham - Martial artist, Tim Byrdak - 2005 Major League Baseball player (Baltimore Orioles, born : Oct 31, 1973).
Cook County has a predicted average indoor radon screening level between 2 and 4 pCi/L (pico curies per liter) - Moderate Potential Average household size: This village:
2.5 peopleIllinois:
2.6 people
Percentage of family households: This village:
64.4%Whole state:
65.8%
Percentage of households with unmarried partners: This village:
4.4%Whole state:
6.3%
Likely homosexual households (counted as self-reported same-sex unmarried-partner households)
Lesbian couples: 0.3% of all households Gay men: 0.3% of all households
479 people in nursing facilities/skilled-nursing facilities in 2010people in other noninstitutional facilities in 2010people in nursing homes in 2000people in religious group quarters in 2000
Banks with most branches in Oak Lawn (2011 data):
TCF National Bank: Oak Lawn Branch #2110, S. Pulaski/Oak Lawn Jewel Branch, Oak Lawn Jewel Branch #2299, Oak Lawn Branch #2106, Ridgeland/87th St Jewel Branch #2206. Info updated 2009/11/23: Bank assets: $19,007.0 mil, Deposits: $12,377.0 mil, headquarters in Sioux Falls, SD, positive income , Commercial Lending Specialization, 441 total offices , Holding Company: Tcf Financial Corporation
JPMorgan Chase Bank, National Association: Oak Lawn 95th Street Banking Center, Oak Lawn Branch, Oak Lawn - Cicero & 106th Branch, Oak Lawn Keeler Banking Center. Info updated 2011/11/10: Bank assets: $1,811,678.0 mil, Deposits: $1,190,738.0 mil, headquarters in Columbus, OH, positive income , International Specialization, 5577 total offices , Holding Company: Jpmorgan Chase & Co.
Bank of America, National Association: Oak Lawn East at 4200 West 95th Street, branch established on 1993/02/26; Ranch Manor Branch at 4046 West 111th Street, branch established on 1922/01/01. Info updated 2009/11/18: Bank assets: $1,451,969.3 mil, Deposits: $1,077,176.8 mil, headquarters in Charlotte, NC, positive income , 5782 total offices , Holding Company: Bank Of America Corporation
Firstmerit Bank, National Association: Oak Lawn Branch at 10240 S Cicero Avenue, branch established on 2005/06/30; Oak Lawn Fb Branch at 5665 West 95th Street, branch established on 1999/10/28. Info updated 2010/05/17: Bank assets: $14,420.6 mil, Deposits: $11,497.6 mil, headquarters in Akron, OH, positive income , Commercial Lending Specialization, 213 total offices , Holding Company: Firstmerit Corporation
Marquette Bank: Oak Lawn Branch at 10419 South Cicero Avenue, branch established on 1996/03/16; 8855 S Ridgeland Avenue Branch at 8855 South Ridgeland Avenue, branch established on 1904/01/01. Info updated 2006/11/15: Bank assets: $1,703.1 mil, Deposits: $1,439.1 mil, headquarters in Chicago, IL, positive income , Commercial Lending Specialization, 27 total offices , Holding Company: Marquette National Corporation
Standard Bank and Trust Company: Oak Lawn Facility at 4001 West 95th Street, branch established on 1980/04/01; Oak Lawn 111th Branch at 4700 W 111th Street, branch established on 2005/06/28. Info updated 2006/11/03: Bank assets: $2,140.2 mil, Deposits: $1,872.8 mil, headquarters in Hickory Hills, IL, positive income , Commercial Lending Specialization, 43 total offices , Holding Company: Standard Bancshares, Inc.
RBS Citizens, National Association: Central Ave / Oakl Lawn at 10270 Central Avenue, branch established on 1993/06/01; Oak Lawn at 9401 S. Cicero Avenue, branch established on 1988/06/30. Info updated 2007/09/19: Bank assets: $106,940.6 mil, Deposits: $75,690.2 mil, headquarters in Providence, RI, positive income , 1135 total offices , Holding Company: Uk Financial Investments Limited
Prospect Federal Savings Bank: Oak Lawn Branch at 4646 West 103rd Street, branch established on 2002/06/30. Info updated 2011/07/21: Bank assets: $287.3 mil, Deposits: $246.5 mil, headquarters in Worth, IL, negative income in the last year , 3 total offices
Citibank, National Association: Oak Lawn Branch at 5102 West Museum Drive, branch established on 2006/10/30. Info updated 2012/01/10: Bank assets: $1,288,658.0 mil, Deposits: $882,541.0 mil, headquarters in Sioux Falls, SD, positive income , International Specialization, 1048 total offices , Holding Company: Citigroup Inc.
8 other banks with 8 local branches
For population 15 years and over in Oak Lawn:
Never married: 34.1%Now married: 48.6%Separated: 1.2%Widowed: 7.7%Divorced: 8.4% For population 25 years and over in Oak Lawn:
High school or higher: 89.8%Bachelor's degree or higher: 29.3%Graduate or professional degree: 9.8%Unemployed: 4.3%Mean travel time to work (commute): 27.1 minutes
Education Gini index (Inequality in education) Here:
12.7Illinois average:
12.5
Religion statistics for Oak Lawn, IL (based on Cook County data)
Religion Adherents Congregations Catholic 1,947,223 376 Evangelical Protestant 432,975 1,484 Other 312,636 403 Mainline Protestant 202,114 630 Black Protestant 148,895 395 Orthodox 53,276 66 None 2,097,556 -
Source: Clifford Grammich, Kirk Hadaway, Richard Houseal, Dale E.Jones, Alexei Krindatch, Richie Stanley and Richard H.Taylor. 2012. 2010 U.S.Religion Census: Religious Congregations & Membership Study. Association of Statisticians of American Religious Bodies. Jones, Dale E., et al. 2002. Congregations and Membership in the United States 2000. Nashville, TN: Glenmary Research Center. Graphs represent county-level data
Food Environment Statistics: Number of grocery stores : 1,460Here :
2.77 / 10,000 pop.Illinois :
2.24 / 10,000 pop.
Number of supercenters and club stores : 23This county :
0.04 / 10,000 pop.Illinois :
0.08 / 10,000 pop.
Number of convenience stores (no gas) : 490This county :
0.93 / 10,000 pop.Illinois :
0.75 / 10,000 pop.
Number of convenience stores (with gas) : 806Cook County :
1.53 / 10,000 pop.Illinois :
2.61 / 10,000 pop.
Number of full-service restaurants : 3,516This county :
6.67 / 10,000 pop.Illinois :
6.86 / 10,000 pop.
Adult diabetes rate : Cook County :
8.4%Illinois :
8.3%
Low-income preschool obesity rate : Cook County :
16.3%State :
14.5%
Health and Nutrition: Healthy diet rate : This city:
52.7%Illinois:
49.5%
Average overall health of teeth and gums : Oak Lawn:
50.1%Illinois:
47.2%
People feeling badly about themselves : This city:
19.9%Illinois:
20.5%
People not drinking alcohol at all : Oak Lawn:
10.7%State:
10.8%
Average hours sleeping at night : This city:
6.9Illinois:
6.8
Overweight people : This city:
35.0%Illinois:
33.4%
General health condition : Oak Lawn:
57.8%Illinois:
56.4%
Average condition of hearing : Oak Lawn:
77.4%Illinois:
79.9%
More about Health and Nutrition of Oak Lawn, IL Residents
Local government employment and payroll (March 2022)
Function
Full-time employees
Monthly full-time payroll
Average yearly full-time wage
Part-time employees
Monthly part-time payroll
Police Protection - Officers
103 $1,009,150 $117,571 0 $0 Firefighters
73 $823,588 $135,384 0 $0 Local Libraries
36 $164,967 $54,989 39 $47,676 Other and Unallocable
35 $259,545 $88,987 2 $1,915 Streets and Highways
22 $151,001 $82,364 0 $0 Other Government Administration
18 $158,722 $105,815 8 $9,068 Sewerage
14 $99,645 $85,410 0 $0 Water Supply
14 $102,428 $87,795 0 $0 Financial Administration
11 $87,345 $95,285 2 $537 Correction
9 $49,095 $65,460 0 $0 Police - Other
6 $31,715 $63,430 3 $4,674 Health
4 $10,000 $30,000 0 $0 Natural Resources
1 $7,050 $84,600 0 $0 Fire - Other
1 $9,366 $112,392 0 $0
Totals for Government
347 $2,963,619 $102,488 54 $63,870
Oak Lawn government finances - Expenditure in 2021 (per resident):
Construction - Central Staff Services: $724,000 ($12.86)
Current Operations - Water Utilities: $47,709,000 ($847.62)
Police Protection: $20,317,000 ($360.96)Local Fire Protection: $15,559,000 ($276.43)Central Staff Services: $8,178,000 ($145.29)Regular Highways: $6,470,000 ($114.95)Libraries: $5,065,000 ($89.99)General - Other: $4,444,000 ($78.95)Solid Waste Management: $3,891,000 ($69.13)Sewerage: $2,314,000 ($41.11)Financial Administration: $1,240,000 ($22.03)Parks and Recreation: $505,000 ($8.97)Public Welfare - Other: $103,000 ($1.83)General - Interest on Debt: $5,149,000 ($91.48)
Total Salaries and Wages: $32,074,000 ($569.84)
Oak Lawn government finances - Revenue in 2021 (per resident):
Charges - Other: $5,204,000 ($92.46)
Solid Waste Management: $3,650,000 ($64.85)Sewerage: $3,240,000 ($57.56)Parks and Recreation: $23,000 ($0.41)Federal Intergovernmental - Other: $470,000 ($8.35)
Housing and Community Development: $180,000 ($3.20)Miscellaneous - General Revenue - Other: $5,716,000 ($101.55)
Fines and Forfeits: $1,320,000 ($23.45)Interest Earnings: $368,000 ($6.54)Revenue - Water Utilities: $50,430,000 ($895.96)
State Intergovernmental - General Local Government Support: $18,518,000 ($329.00)
Highways: $3,308,000 ($58.77)Other: $1,325,000 ($23.54)Tax - Property: $23,492,000 ($417.37)
Public Utilities Sales: $6,561,000 ($116.57)Other Selective Sales: $5,447,000 ($96.77)General Sales and Gross Receipts: $4,003,000 ($71.12)Other License: $3,070,000 ($54.54)
Oak Lawn government finances - Debt in 2021 (per resident):
Long Term Debt - Beginning Outstanding - Unspecified Public Purpose: $88,275,000 ($1568.33)
Outstanding Unspecified Public Purpose: $85,996,000 ($1527.84)Retired Unspecified Public Purpose: $37,999,000 ($675.11)Issue, Unspecified Public Purpose: $35,719,000 ($634.60)
Oak Lawn government finances - Cash and Securities in 2021 (per resident):
Other Funds - Cash and Securities: $24,819,000 ($440.94)
3.53% of this county's 2021 resident taxpayers lived in other counties in 2020 ($82,405 average adjusted gross income )
Here:
3.53%Illinois average:
5.09%
0.01% of residents moved from foreign countries ($114 average AGI )Cook County:
0.01%Illinois average:
0.01%
Top counties from which taxpayers relocated into this county between 2020 and 2021:
5.44% of this county's 2020 resident taxpayers moved to other counties in 2021 ($120,340 average adjusted gross income )
Here:
5.44%Illinois average:
6.10%
0.01% of residents moved to foreign countries ($140 average AGI )Cook County:
0.01%Illinois average:
0.01%
Top counties to which taxpayers relocated from this county between 2020 and 2021:
Businesses in Oak Lawn, IL
Name Count Name Count
7-Eleven 4 Kmart 2 AT&T 1 LA Fitness 2 Arby's 1 Lane Furniture 1 AutoZone 1 Little Caesars Pizza 1 Bally Total Fitness 1 Long John Silver's 1 Baskin-Robbins 2 MasterBrand Cabinets 1 Brunswick Bowling & Billiards 1 Mazda 1 Budget Car Rental 1 McDonald's 3 Burger King 1 Men's Wearhouse 2 CarMax 1 Nike 4 Chevrolet 1 Nissan 1 Chipotle 1 Panda Express 1 Circle K 1 Panera Bread 1 Cold Stone Creamery 1 Payless 2 Cricket Wireless 2 Qdoba Mexican Grill 1 Curves 1 Quiznos 1 Decora Cabinetry 1 Red Lobster 1 Dennys 1 Safeway 1 Discount Tire 1 Sears 1 Domino's Pizza 1 Sprint Nextel 1 DressBarn 1 Staples 1 Dressbarn 1 Starbucks 4 Dunkin Donuts 4 Subway 2 FedEx 4 T.G.I. Driday's 1 Firestone Complete Auto Care 1 Taco Bell 1 GameStop 1 Target 1 H&R Block 2 Toyota 1 Hilton 2 U-Haul 2 Home Depot 1 UPS 12 Honda 1 Volkswagen 1 Hyundai 1 Vons 1 Jewel-Osco 3 Walgreens 3 Jones New York 3 White Castle 1 KFC 1
Strongest AM radio stations in Oak Lawn:
WRDZ (1300 AM; 4 kW; LA GRANGE, IL; Owner: ABC, INC.)
WLS (890 AM; 50 kW; CHICAGO, IL; Owner: WLS, INC.)
WGCI (1390 AM; 5 kW; CHICAGO, IL; Owner: AMFM RADIO LICENSES, L.L.C.)
WVIV (1200 AM; 20 kW; CHICAGO, IL; Owner: WLXX-AM LICENSE CORP.)
WMVP (1000 AM; 50 kW; CHICAGO, IL; Owner: ABC, INC.)
WYLL (1160 AM; 50 kW; CHICAGO, IL; Owner: SCA LICENSE CORPORATION)
WSCR (670 AM; 50 kW; CHICAGO, IL; Owner: INFINITY BROADCASTING OPERATIONS, INC.)
WBBM (780 AM; 50 kW; CHICAGO, IL; Owner: INFINITY BROADCASTING OPERATIONS, INC.)
WGN (720 AM; 50 kW; CHICAGO, IL; Owner: WGN CONTINENTAL BROADCASTING CO.)
WNWI (1080 AM; 3 kW; OAK LAWN, IL; Owner: BIRACH BROADCASTING CORPORATION)
WNTD (950 AM; 5 kW; CHICAGO, IL; Owner: RADIO UNICA OF CHICAGO LICENSE CORP.)
WCSN (820 AM; 5 kW; CHICAGO, IL; Owner: WYPA, INC.)
WIND (560 AM; 5 kW; CHICAGO, IL; Owner: TICHENOR LICENSE CORPORATION ("TLC"))
Strongest FM radio stations in Oak Lawn:
WCKG (105.9 FM; ELMWOOD PARK, IL; Owner: INFINITY HOLDINGS CORPORATION OF ORLANDO)
WLIT-FM (93.9 FM; CHICAGO, IL; Owner: AMFM RADIO LICENSES, L.L.C.)
WJMK (104.3 FM; CHICAGO, IL; Owner: INFINITY BROADCASTING CORP. OF ILLINOIS)
WNUA (95.5 FM; CHICAGO, IL; Owner: AMFM RADIO LICENSES, L.L.C.)
WTMX (101.9 FM; SKOKIE, IL; Owner: BONNEVILLE HOLDING COMPANY)
WBBM-FM (96.3 FM; CHICAGO, IL; Owner: INFINITY BROADCASTING OPERATIONS, INC.)
WKSC-FM (103.5 FM; CHICAGO, IL; Owner: AMFM RADIO LICENSES, L.L.C.)
WFMT (98.7 FM; CHICAGO, IL; Owner: WINDOW TO THE WORLD COMMUNICATIONS)
WZZN (94.7 FM; CHICAGO, IL; Owner: ABC CHICAGO FM RADIO,INC.)
WGCI-FM (107.5 FM; CHICAGO, IL; Owner: AMFM RADIO LICENSES, L.L.C.)
WXAV (88.3 FM; CHICAGO, IL; Owner: ST. XAVIER COLLEGE)
WDRV (97.1 FM; CHICAGO, IL; Owner: BONNEVILLE HOLDING COMPANY)
WBEZ (91.5 FM; CHICAGO, IL; Owner: THE WBEZ ALLIANCE, INC.)
WKQX (101.1 FM; CHICAGO, IL; Owner: EMMIS RADIO LICENSE CORPORATION)
WLUP-FM (97.9 FM; CHICAGO, IL; Owner: BONNEVILLE HOLDING COMPANY)
WNND (100.3 FM; CHICAGO, IL; Owner: BONNEVILLE HOLDING COMPANY)
WOJO (105.1 FM; EVANSTON, IL; Owner: TICHENOR LICENSE CORPORATION ("TLC"))
WUSN (99.5 FM; CHICAGO, IL; Owner: INFINITY BROADCASTING CORPORATION OF CHICAGO)
WVAZ (102.7 FM; OAK PARK, IL; Owner: AMFM RADIO LICENSES, L.L.C.)
WXRT-FM (93.1 FM; CHICAGO, IL; Owner: INFINITY BROADCASTING OPERATIONS, INC.)
TV broadcast stations around Oak Lawn:
WLS-TV (Channel 7; CHICAGO, IL; Owner: WLS TELEVISION, INC.)
WMAQ-TV (Channel 5; CHICAGO, IL; Owner: NBC SUBSIDIARY (WMAQ-TV), INC.)
WTTW (Channel 11; CHICAGO, IL; Owner: WINDOW TO THE WORLD COMMUNICATIONS, INC.)
WGN-TV (Channel 9; CHICAGO, IL; Owner: WGN CONTINENTAL BROADCASTING COMPANY)
WGBO-TV (Channel 66; JOLIET, IL; Owner: WGBO LICENSE PARTNERSHIP, G.P.)
WPWR-TV (Channel 50; GARY, IN; Owner: FOX TELEVISION STATIONS, INC.)
WXFT (Channel 60; AURORA, IL; Owner: TELEFUTURA CHICAGO LLC)
WBBM-TV (Channel 2; CHICAGO, IL; Owner: CBS BROADCASTING INC.)
WCIU-TV (Channel 26; CHICAGO, IL; Owner: WCIU-TV LIMITED PARTNERSHIP)
WCPX (Channel 38; CHICAGO, IL; Owner: PAXSON CHICAGO LICENSE, INC.)
WFLD (Channel 32; CHICAGO, IL; Owner: FOX TELEVISION STATIONS, INC.)
W68DO (Channel 68; PALATINE, IL; Owner: TRINITY BROADCASTING NETWORK)
WFBT-CA (Channel 23; CHICAGO, IL; Owner: CHANNEL 23 LIMITED PARTNERSHIP)
WJYS (Channel 62; HAMMOND, IN; Owner: JOVON BROADCASTING CORPORATION)
WSNS-TV (Channel 44; CHICAGO, IL; Owner: TELEMUNDO OF CHICAGO, INC.)
WOCH-LP (Channel 28; CHICAGO, IL; Owner: KM LPTV OF CHICAGO-28, L.L.C.)
WYCC (Channel 20; CHICAGO, IL; Owner: COLLEGE DIST. #508, COUNTY OF COOK)
WOCK-CA (Channel 13; CHICAGO, IL; Owner: KM LPTV OF CHICAGO-13, L.L.C.)
W34CK (Channel 34; ARLINGTON HEIGHTS, IL; Owner: FIRST UNITED, INC.)
WYIN (Channel 56; GARY, IN; Owner: NORTHWEST INDIANA PUBLIC BROADCASTING, INC.)
W54AP (Channel 54; BLUE ISLAND, IL; Owner: CATHOLIC VIEWS BROADCASTS, INC.)
W64CQ (Channel 64; ARLINGTON HEIGHTS, IL; Owner: TRINITY BROADCASTING NETWORK)
W24AJ (Channel 24; AURORA, IL; Owner: NELSON TV, INC.)
National Bridge Inventory (NBI) Statistics 3 Number of bridges7ft / 1.6m Total length77,100 Total average daily traffic3,678 Total average daily truck traffic
Home Mortgage Disclosure Act Aggregated Statistics For Year 2009(Based on 12 full and 2 partial tracts) A) FHA, FSA/RHS & VA B) Conventional C) Refinancings D) Home Improvement Loans E) Loans on Dwellings For 5+ Families F) Non-occupant Loans on G) Loans On Manufactured Number Average Value Number Average Value Number Average Value Number Average Value Number Average Value Number Average Value Number Average Value
LOANS ORIGINATED 221 $179,231 211 $140,030 1,280 $177,250 35 $86,374 12 $498,075 42 $144,176 0 $0 APPLICATIONS APPROVED, NOT ACCEPTED 15 $165,317 13 $164,870 116 $193,285 3 $16,680 0 $0 5 $104,200 0 $0 APPLICATIONS DENIED 64 $178,338 52 $146,571 466 $196,496 31 $61,290 3 $467,637 30 $153,469 1 $32,000 APPLICATIONS WITHDRAWN 26 $186,844 14 $149,888 173 $189,185 6 $90,500 2 $3,106,055 5 $133,380 0 $0 FILES CLOSED FOR INCOMPLETENESS 10 $209,898 10 $122,474 91 $205,472 4 $67,000 0 $0 4 $153,770 0 $0
Aggregated Statistics For Year 2008(Based on 12 full and 2 partial tracts) A) FHA, FSA/RHS & VA B) Conventional C) Refinancings D) Home Improvement Loans E) Loans on Dwellings For 5+ Families F) Non-occupant Loans on G) Loans On Manufactured Number Average Value Number Average Value Number Average Value Number Average Value Number Average Value Number Average Value Number Average Value
LOANS ORIGINATED 113 $195,821 412 $165,727 897 $182,146 68 $79,392 23 $476,153 87 $150,487 0 $0 APPLICATIONS APPROVED, NOT ACCEPTED 8 $158,829 45 $167,420 132 $176,591 20 $67,629 2 $229,355 16 $160,692 1 $29,950 APPLICATIONS DENIED 38 $182,716 127 $177,026 603 $194,602 70 $80,309 0 $0 33 $150,390 3 $39,757 APPLICATIONS WITHDRAWN 22 $188,802 46 $193,288 187 $201,882 11 $136,469 2 $661,855 10 $152,895 0 $0 FILES CLOSED FOR INCOMPLETENESS 4 $205,000 22 $209,559 65 $182,940 5 $60,232 0 $0 6 $203,667 0 $0
Aggregated Statistics For Year 2007(Based on 12 full and 2 partial tracts) A) FHA, FSA/RHS & VA B) Conventional C) Refinancings D) Home Improvement Loans E) Loans on Dwellings For 5+ Families F) Non-occupant Loans on G) Loans On Manufactured Number Average Value Number Average Value Number Average Value Number Average Value Number Average Value Number Average Value Number Average Value
LOANS ORIGINATED 19 $213,609 789 $159,881 1,284 $175,873 206 $75,132 24 $1,047,235 97 $150,369 2 $19,470 APPLICATIONS APPROVED, NOT ACCEPTED 0 $0 91 $161,198 205 $179,074 28 $59,621 2 $2,365,000 13 $150,085 1 $11,980 APPLICATIONS DENIED 6 $195,847 238 $166,908 716 $189,168 131 $78,491 1 $875,000 43 $169,068 7 $41,353 APPLICATIONS WITHDRAWN 2 $220,645 72 $184,815 285 $183,403 21 $118,148 0 $0 6 $166,000 0 $0 FILES CLOSED FOR INCOMPLETENESS 3 $117,333 10 $161,568 135 $200,688 3 $55,143 0 $0 3 $156,793 0 $0
Aggregated Statistics For Year 2006(Based on 12 full and 2 partial tracts) A) FHA, FSA/RHS & VA B) Conventional C) Refinancings D) Home Improvement Loans E) Loans on Dwellings For 5+ Families F) Non-occupant Loans on G) Loans On Manufactured Number Average Value Number Average Value Number Average Value Number Average Value Number Average Value Number Average Value Number Average Value
LOANS ORIGINATED 18 $195,114 1,371 $149,581 1,491 $161,688 218 $71,982 10 $480,794 163 $154,312 1 $31,950 APPLICATIONS APPROVED, NOT ACCEPTED 2 $156,500 147 $148,764 212 $169,444 39 $82,381 0 $0 19 $142,753 1 $63,000 APPLICATIONS DENIED 4 $110,608 355 $146,158 623 $167,540 133 $81,592 1 $800,140 68 $153,124 3 $38,070 APPLICATIONS WITHDRAWN 2 $180,500 190 $147,606 338 $174,520 30 $119,804 1 $1,600,000 31 $176,311 0 $0 FILES CLOSED FOR INCOMPLETENESS 0 $0 54 $156,207 117 $180,056 11 $81,648 0 $0 9 $163,274 0 $0
Aggregated Statistics For Year 2005(Based on 12 full and 2 partial tracts) A) FHA, FSA/RHS & VA B) Conventional C) Refinancings D) Home Improvement Loans E) Loans on Dwellings For 5+ Families F) Non-occupant Loans on G) Loans On Manufactured Number Average Value Number Average Value Number Average Value Number Average Value Number Average Value Number Average Value Number Average Value
LOANS ORIGINATED 22 $218,824 1,536 $143,034 1,717 $152,454 166 $70,313 18 $519,433 169 $138,881 1 $8,990 APPLICATIONS APPROVED, NOT ACCEPTED 2 $213,000 149 $129,080 233 $144,572 33 $56,400 0 $0 22 $134,736 3 $58,770 APPLICATIONS DENIED 4 $185,968 300 $127,490 730 $164,783 138 $63,185 1 $1,200,000 51 $125,045 10 $45,281 APPLICATIONS WITHDRAWN 2 $167,490 153 $142,562 450 $176,918 44 $175,868 1 $500,000 31 $140,492 0 $0 FILES CLOSED FOR INCOMPLETENESS 2 $109,500 44 $146,560 110 $185,507 5 $105,200 0 $0 5 $202,200 0 $0
Aggregated Statistics For Year 2004(Based on 12 full and 2 partial tracts) A) FHA, FSA/RHS & VA B) Conventional C) Refinancings D) Home Improvement Loans E) Loans on Dwellings For 5+ Families F) Non-occupant Loans on G) Loans On Manufactured Number Average Value Number Average Value Number Average Value Number Average Value Number Average Value Number Average Value Number Average Value
LOANS ORIGINATED 47 $176,963 1,255 $139,456 1,652 $140,122 173 $53,264 31 $403,505 107 $121,073 10 $56,763 APPLICATIONS APPROVED, NOT ACCEPTED 2 $91,000 148 $140,149 242 $143,279 45 $50,114 0 $0 11 $125,985 1 $3,990 APPLICATIONS DENIED 10 $172,328 200 $146,440 663 $145,529 146 $51,949 1 $20,000 27 $159,984 8 $73,941 APPLICATIONS WITHDRAWN 11 $164,430 89 $155,493 460 $152,553 31 $58,673 2 $423,000 9 $185,051 0 $0 FILES CLOSED FOR INCOMPLETENESS 3 $203,547 32 $138,693 105 $166,949 13 $44,061 0 $0 3 $149,000 0 $0
Aggregated Statistics For Year 2003(Based on 12 full and 2 partial tracts) A) FHA, FSA/RHS & VA B) Conventional C) Refinancings D) Home Improvement Loans E) Loans on Dwellings For 5+ Families F) Non-occupant Loans on Number Average Value Number Average Value Number Average Value Number Average Value Number Average Value Number Average Value
LOANS ORIGINATED 98 $159,284 1,063 $140,141 3,583 $124,185 156 $43,344 45 $399,645 120 $117,192 APPLICATIONS APPROVED, NOT ACCEPTED 4 $157,455 91 $152,690 372 $121,714 25 $50,584 1 $1,011,670 11 $185,068 APPLICATIONS DENIED 13 $156,915 117 $139,492 757 $127,799 103 $27,700 0 $0 17 $128,014 APPLICATIONS WITHDRAWN 11 $193,330 86 $161,256 590 $136,574 27 $41,939 5 $408,844 7 $166,484 FILES CLOSED FOR INCOMPLETENESS 11 $144,071 30 $123,713 88 $140,209 9 $28,042 0 $0 4 $99,055
Aggregated Statistics For Year 2002(Based on 12 full and 2 partial tracts) A) FHA, FSA/RHS & VA B) Conventional C) Refinancings D) Home Improvement Loans E) Loans on Dwellings For 5+ Families F) Non-occupant Loans on Number Average Value Number Average Value Number Average Value Number Average Value Number Average Value Number Average Value
LOANS ORIGINATED 112 $139,468 1,025 $124,227 2,259 $121,327 117 $28,634 38 $328,421 91 $102,611 APPLICATIONS APPROVED, NOT ACCEPTED 6 $127,832 91 $138,567 312 $116,322 27 $32,454 0 $0 9 $66,731 APPLICATIONS DENIED 9 $166,166 106 $119,556 459 $114,104 72 $23,018 1 $540,000 13 $105,935 APPLICATIONS WITHDRAWN 14 $114,146 65 $139,418 347 $126,447 16 $43,839 1 $440,000 6 $125,857 FILES CLOSED FOR INCOMPLETENESS 4 $181,945 18 $129,698 89 $119,071 7 $30,886 1 $281,380 1 $163,000
Aggregated Statistics For Year 2001(Based on 12 full and 2 partial tracts) A) FHA, FSA/RHS & VA B) Conventional C) Refinancings D) Home Improvement Loans E) Loans on Dwellings For 5+ Families F) Non-occupant Loans on Number Average Value Number Average Value Number Average Value Number Average Value Number Average Value Number Average Value
LOANS ORIGINATED 162 $144,750 958 $114,172 1,755 $111,410 146 $31,256 20 $359,034 65 $107,474 APPLICATIONS APPROVED, NOT ACCEPTED 9 $138,782 55 $113,557 178 $100,454 30 $23,150 0 $0 3 $109,940 APPLICATIONS DENIED 18 $146,985 86 $133,638 463 $101,469 74 $21,631 0 $0 16 $128,496 APPLICATIONS WITHDRAWN 14 $130,626 64 $139,712 255 $112,053 27 $21,466 0 $0 9 $119,969 FILES CLOSED FOR INCOMPLETENESS 2 $150,885 14 $98,914 89 $119,661 3 $40,000 1 $255,000 2 $55,230
Aggregated Statistics For Year 2000(Based on 12 full and 2 partial tracts) A) FHA, FSA/RHS & VA B) Conventional C) Refinancings D) Home Improvement Loans E) Loans on Dwellings For 5+ Families F) Non-occupant Loans on Number Average Value Number Average Value Number Average Value Number Average Value Number Average Value Number Average Value
LOANS ORIGINATED 149 $126,010 953 $102,449 430 $85,382 185 $25,708 14 $385,086 41 $103,891 APPLICATIONS APPROVED, NOT ACCEPTED 5 $142,400 54 $106,191 112 $70,439 52 $26,110 0 $0 4 $72,418 APPLICATIONS DENIED 23 $118,468 113 $104,170 276 $82,290 119 $27,128 0 $0 6 $94,392 APPLICATIONS WITHDRAWN 10 $119,915 67 $104,931 150 $87,534 21 $33,167 0 $0 4 $78,715 FILES CLOSED FOR INCOMPLETENESS 4 $148,000 26 $130,728 52 $111,289 2 $32,500 0 $0 0 $0
Aggregated Statistics For Year 1999(Based on 12 full and 2 partial tracts) A) FHA, FSA/RHS & VA B) Conventional C) Refinancings D) Home Improvement Loans E) Loans on Dwellings For 5+ Families F) Non-occupant Loans on Number Average Value Number Average Value Number Average Value Number Average Value Number Average Value Number Average Value
LOANS ORIGINATED 154 $121,431 923 $102,430 963 $93,596 190 $23,172 23 $361,226 65 $85,396 APPLICATIONS APPROVED, NOT ACCEPTED 5 $124,924 51 $99,891 162 $94,167 34 $26,219 0 $0 4 $50,558 APPLICATIONS DENIED 10 $120,656 90 $81,941 311 $103,245 76 $18,902 0 $0 14 $74,985 APPLICATIONS WITHDRAWN 10 $105,098 53 $110,281 179 $97,111 32 $48,248 0 $0 7 $75,514 FILES CLOSED FOR INCOMPLETENESS 3 $141,640 10 $124,242 66 $106,071 6 $12,805 0 $0 2 $56,450
Detailed mortgage data for all 14 tracts in Oak Lawn, IL
Private Mortgage Insurance Companies Aggregated Statistics For Year 2009(Based on 12 full and 2 partial tracts) A) Conventional B) Refinancings Number Average Value Number Average Value
LOANS ORIGINATED 58 $155,016 39 $215,293 APPLICATIONS APPROVED, NOT ACCEPTED 29 $190,401 23 $227,532 APPLICATIONS DENIED 9 $135,796 19 $210,696 APPLICATIONS WITHDRAWN 6 $227,578 8 $229,000 FILES CLOSED FOR INCOMPLETENESS 1 $136,250 2 $182,135
Aggregated Statistics For Year 2008(Based on 12 full and 2 partial tracts) A) Conventional B) Refinancings C) Non-occupant Loans on Number Average Value Number Average Value Number Average Value
LOANS ORIGINATED 203 $184,967 115 $220,554 10 $162,601 APPLICATIONS APPROVED, NOT ACCEPTED 87 $191,065 75 $218,315 9 $176,993 APPLICATIONS DENIED 34 $179,590 18 $245,704 8 $209,176 APPLICATIONS WITHDRAWN 14 $182,396 7 $244,089 2 $194,500 FILES CLOSED FOR INCOMPLETENESS 10 $202,110 5 $242,000 3 $231,457
Aggregated Statistics For Year 2007(Based on 12 full and 2 partial tracts) A) Conventional B) Refinancings C) Non-occupant Loans on Number Average Value Number Average Value Number Average Value
LOANS ORIGINATED 310 $173,474 136 $220,569 10 $141,191 APPLICATIONS APPROVED, NOT ACCEPTED 40 $186,718 39 $220,408 1 $231,000 APPLICATIONS DENIED 4 $199,868 5 $212,304 2 $116,215 APPLICATIONS WITHDRAWN 11 $209,342 15 $216,287 0 $0 FILES CLOSED FOR INCOMPLETENESS 0 $0 1 $254,000 0 $0
Aggregated Statistics For Year 2006(Based on 12 full and 2 partial tracts) A) Conventional B) Refinancings C) Non-occupant Loans on Number Average Value Number Average Value Number Average Value
LOANS ORIGINATED 235 $179,198 71 $220,061 12 $170,782 APPLICATIONS APPROVED, NOT ACCEPTED 20 $219,454 18 $237,141 1 $191,960 APPLICATIONS DENIED 5 $130,720 1 $387,880 0 $0 APPLICATIONS WITHDRAWN 10 $138,726 8 $215,574 0 $0 FILES CLOSED FOR INCOMPLETENESS 1 $120,000 0 $0 0 $0
Aggregated Statistics For Year 2005(Based on 12 full and 2 partial tracts) A) Conventional B) Refinancings C) Non-occupant Loans on Number Average Value Number Average Value Number Average Value
LOANS ORIGINATED 260 $161,249 88 $173,975 14 $132,324 APPLICATIONS APPROVED, NOT ACCEPTED 36 $176,684 33 $183,108 5 $99,752 APPLICATIONS DENIED 1 $284,370 4 $137,185 1 $135,000 APPLICATIONS WITHDRAWN 14 $136,887 5 $122,544 3 $140,287 FILES CLOSED FOR INCOMPLETENESS 0 $0 3 $209,667 0 $0
Aggregated Statistics For Year 2004(Based on 12 full and 2 partial tracts) A) Conventional B) Refinancings C) Non-occupant Loans on Number Average Value Number Average Value Number Average Value
LOANS ORIGINATED 331 $154,754 109 $158,209 6 $139,500 APPLICATIONS APPROVED, NOT ACCEPTED 48 $163,044 41 $161,533 3 $110,333 APPLICATIONS DENIED 5 $145,288 0 $0 1 $165,000 APPLICATIONS WITHDRAWN 17 $153,935 11 $174,380 1 $183,000 FILES CLOSED FOR INCOMPLETENESS 21 $127,082 0 $0 0 $0
Aggregated Statistics For Year 2003(Based on 12 full and 2 partial tracts) A) Conventional B) Refinancings C) Non-occupant Loans on Number Average Value Number Average Value Number Average Value
LOANS ORIGINATED 408 $149,902 295 $149,511 11 $144,831 APPLICATIONS APPROVED, NOT ACCEPTED 45 $143,587 76 $151,890 4 $70,250 APPLICATIONS DENIED 8 $175,905 5 $129,426 2 $154,215 APPLICATIONS WITHDRAWN 21 $151,434 14 $147,722 0 $0 FILES CLOSED FOR INCOMPLETENESS 1 $83,000 0 $0 0 $0
Aggregated Statistics For Year 2002(Based on 12 full and 2 partial tracts) A) Conventional B) Refinancings C) Non-occupant Loans on Number Average Value Number Average Value Number Average Value
LOANS ORIGINATED 432 $133,808 255 $146,265 22 $94,620 APPLICATIONS APPROVED, NOT ACCEPTED 52 $132,635 56 $147,388 0 $0 APPLICATIONS DENIED 8 $131,672 5 $165,872 2 $85,415 APPLICATIONS WITHDRAWN 14 $116,415 11 $162,176 1 $152,760 FILES CLOSED FOR INCOMPLETENESS 0 $0 0 $0 0 $0
Aggregated Statistics For Year 2001(Based on 12 full and 2 partial tracts) A) Conventional B) Refinancings C) Non-occupant Loans on Number Average Value Number Average Value Number Average Value
LOANS ORIGINATED 410 $120,972 221 $138,489 12 $100,495 APPLICATIONS APPROVED, NOT ACCEPTED 39 $133,627 33 $133,975 3 $118,880 APPLICATIONS DENIED 8 $140,334 9 $131,372 2 $91,500 APPLICATIONS WITHDRAWN 7 $106,293 13 $140,834 0 $0 FILES CLOSED FOR INCOMPLETENESS 1 $71,000 0 $0 0 $0
Aggregated Statistics For Year 2000(Based on 12 full and 2 partial tracts) A) Conventional B) Refinancings C) Non-occupant Loans on Number Average Value Number Average Value Number Average Value
LOANS ORIGINATED 364 $109,973 39 $130,939 10 $86,490 APPLICATIONS APPROVED, NOT ACCEPTED 38 $122,451 11 $130,686 2 $84,000 APPLICATIONS DENIED 14 $110,615 2 $154,500 0 $0 APPLICATIONS WITHDRAWN 7 $80,564 2 $109,905 0 $0 FILES CLOSED FOR INCOMPLETENESS 2 $98,500 2 $129,845 0 $0
Aggregated Statistics For Year 1999(Based on 12 full and 2 partial tracts) A) Conventional B) Refinancings C) Non-occupant Loans on Number Average Value Number Average Value Number Average Value
LOANS ORIGINATED 349 $108,018 109 $124,636 7 $76,014 APPLICATIONS APPROVED, NOT ACCEPTED 13 $85,314 19 $108,965 1 $59,870 APPLICATIONS DENIED 12 $94,155 4 $169,200 1 $71,110 APPLICATIONS WITHDRAWN 6 $79,013 5 $151,340 0 $0 FILES CLOSED FOR INCOMPLETENESS 1 $123,960 0 $0 0 $0
Fire-safe hotels and motels in Oak Lawn, Illinois:
Bridgeview Inn, 10030 S Harlem Ave, Oak Lawn, Illinois 60455 Phone: (708) 430-5810
J C Miami Motel, 9041 S Cicero Ave, Oak Lawn, Illinois 60453 Phone: (708) 424-5750, Fax: (708) 448-2067
Hilton Oak Lawn, 9333 S Cicero, Oak Lawn, Illinois 60453 Phone: (708) 425-7000, Fax: (708) 425-1665
All 3 fire-safe hotels and motels in Oak Lawn, Illinois
Most common first names in Oak Lawn, IL among deceased individuals Name Count Lived (average)
John 925 74.8 years Mary 845 80.6 years William 519 74.0 years Joseph 509 75.6 years James 445 72.3 years Helen 442 80.3 years Edward 414 74.8 years Margaret 382 79.5 years Frank 367 76.3 years Anna 363 83.1 years
Most common last names in Oak Lawn, IL among deceased individuals Last name Count Lived (average)
Johnson 107 78.1 years Smith 95 75.2 years Miller 85 73.9 years Anderson 80 78.5 years Murphy 74 76.7 years Sullivan 65 75.4 years Kelly 63 74.4 years Walsh 63 75.9 years Burke 54 78.3 years Nelson 46 77.2 years
Oak Lawn compared to Illinois state average:
Unemployed percentage significantly below state average. Renting percentage below state average. Length of stay since moving in significantly above state average.
#18 on the list of "Top 101 cities with the largest percentage of elementary and middle school students in private schools (5,000+ students)"
#19 on the list of "Top 101 cities with the lowest number of burglaries per 100,000 residents (population 50,000+)"
#22 on the list of "Top 101 cities with the lowest number of murders per 100,000 residents (population 50,000+)"
#29 on the list of "Top 101 cities with the smallest city-data.com crime index per police officer (population 50,000+)"
#29 on the list of "Top 101 cities where residents moved in more then 10 years ago (10,000+ households)"
#31 on the list of "Top 101 cities with the most people born in the same U.S. state as the city (population 50,000+)"
#39 on the list of "Top 100 high-educated but low-earning cities (pop. 50,000+)"
#40 on the list of "Top 101 cities with largest percentage of females in industries: transportation and warehousing (population 50,000+)"
#44 on the list of "Top 101 cities with largest percentage of males in occupations: fire fighting and prevention workers including supervisors (population 50,000+)"
#47 on the list of "Top 101 cities with largest percentage of females in occupations: transportation occupations (population 50,000+)"
#55 on the list of "Top 101 cities with largest percentage of males in industries: wholesale trade (population 50,000+)"
#55 on the list of "Top 101 cities with the most residents born in Jordan (population 500+)"
#62 on the list of "Top 101 cities with largest percentage of females in occupations: construction and extraction occupations (population 50,000+)"
#63 on the list of "Top 101 cities with the largest temperature differences during a year (population 50,000+)"
#63 on the list of "Top 101 cities with the most local government spending on current operations of libraries per resident (population 10,000+)"
#69 on the list of "Top 100 cities with longest commuting times (pop. 50,000+)"
#70 on the list of "Top 101 cities with the largest percentage of high school students in private schools (500+ students)"
#71 on the list of "Top 101 cities with the most residents born in Poland (population 500+)"
#72 on the list of "Top 100 safest cities (lowest city-data.com crime index) (pop. 50,000+)"
#79 on the list of "Top 101 cities with the lowest city-data.com crime index (population 50,000+)"
#41 (60453) on the list of "Top 101 zip codes with the largest percentage of Lithuanian first ancestries (pop 5,000+)"
#1 on the list of "Top 101 counties with the most Black Protestant congregations"
#1 on the list of "Top 101 counties with the most Catholic congregations"
#1 on the list of "Top 101 counties with the highest surface withdrawal of fresh water for public supply"
#2 on the list of "Top 101 counties with the most Black Protestant adherents"
#2 on the list of "Top 101 counties with the most Orthodox congregations (pop. 50,000+)"
Top Patent Applicants
James A. Hubbard, Jr. (11)
Trevor Stanhope (7)
Marquita Johnson (5)
Jeffrey Carson (4)
Daniel Mcnicholas (4)
John Joseph Savaglio (4)
Kimberly L. Stefanisin (3)
Indika Edirisinghe (3)
Terrianne Erickson (3)
Enrique Valdez (3)
Total of 118 patent applications in 2008-2024.

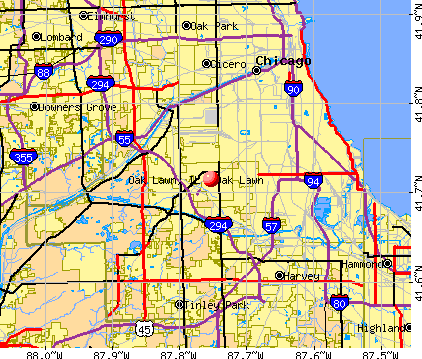


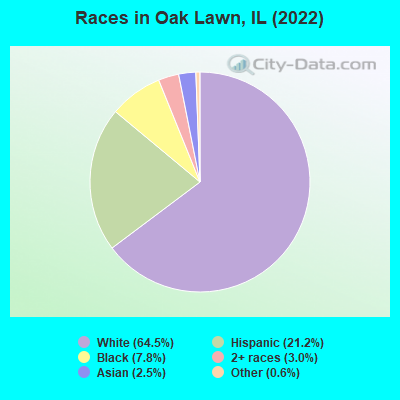
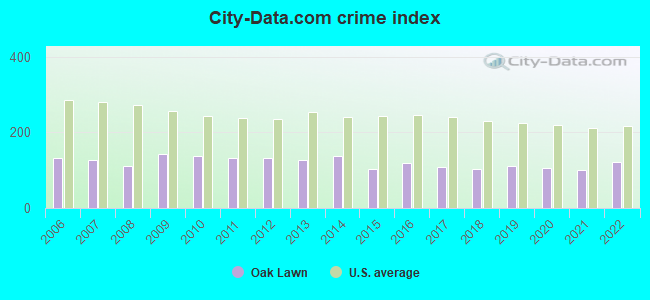
 Recent articles from our blog. Our writers, many of them Ph.D. graduates or candidates, create easy-to-read articles on a wide variety of topics.

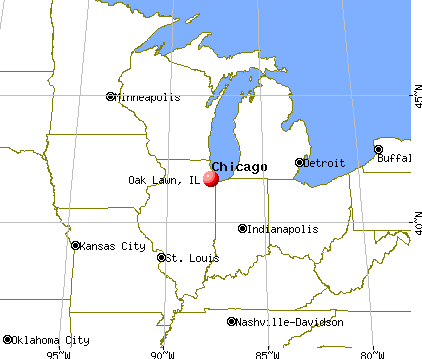
 (9.5 miles
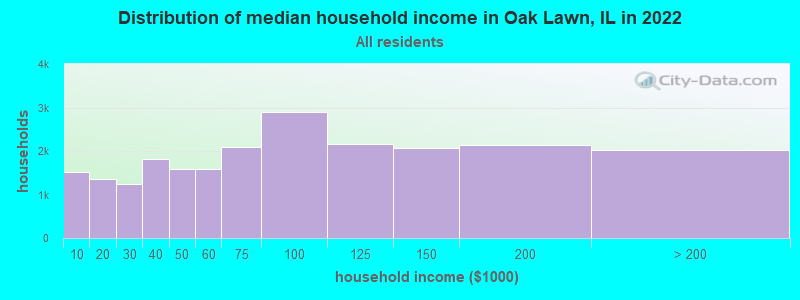
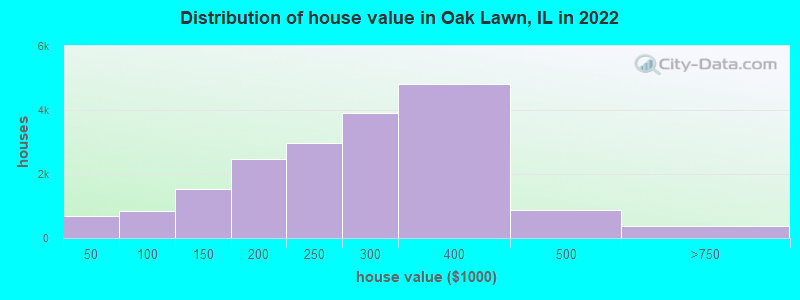

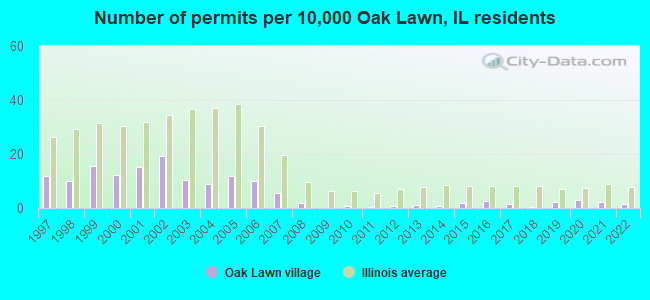
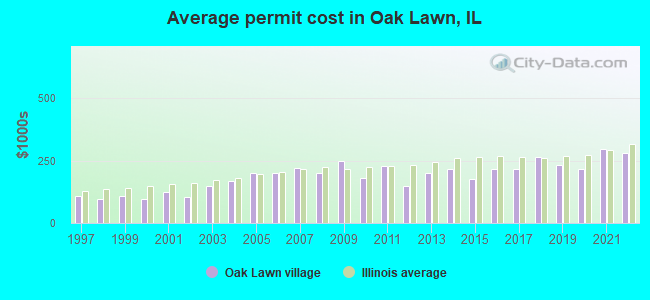
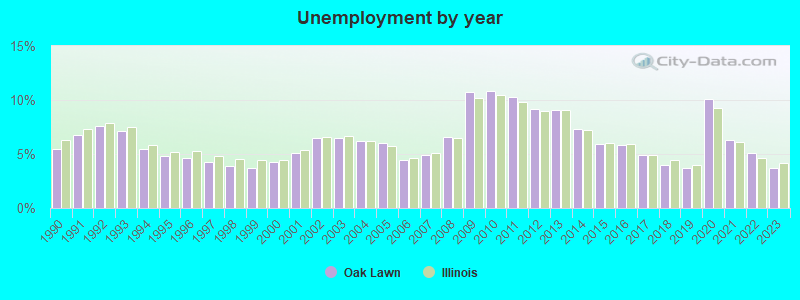
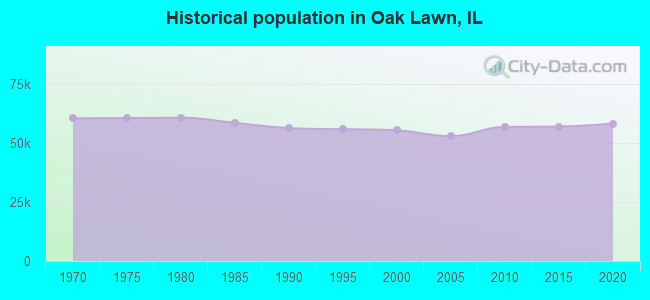
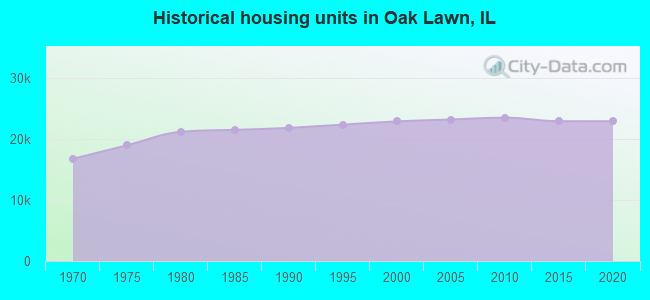
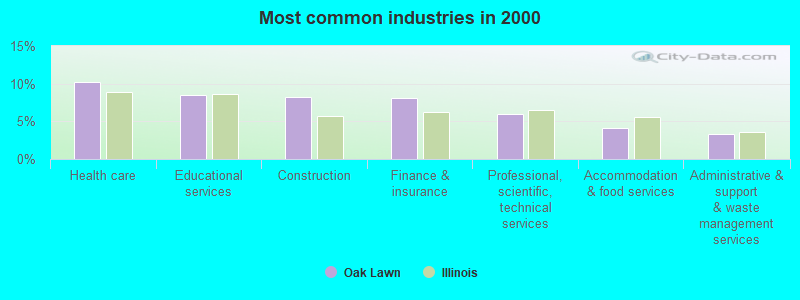
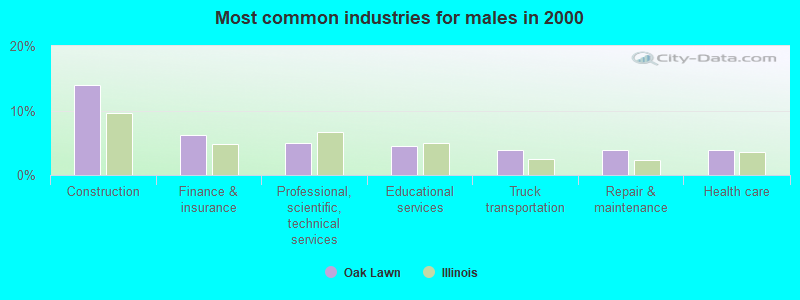
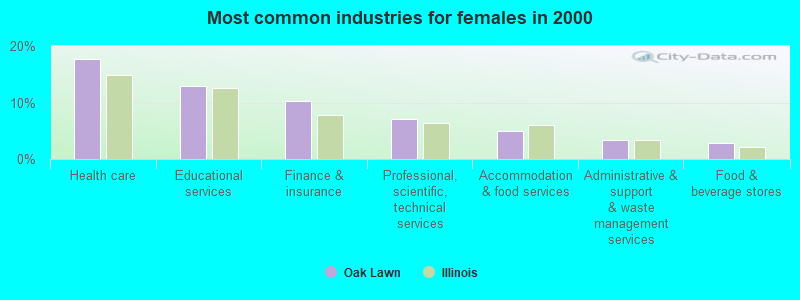
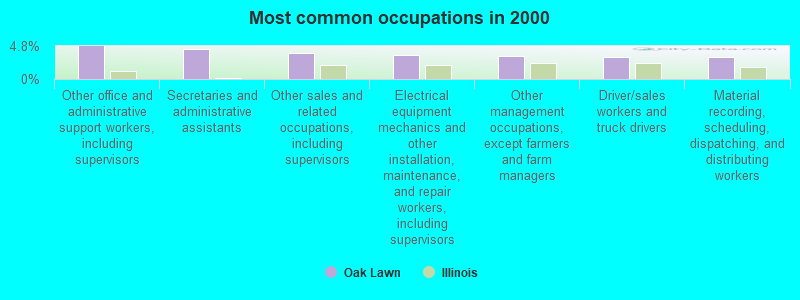
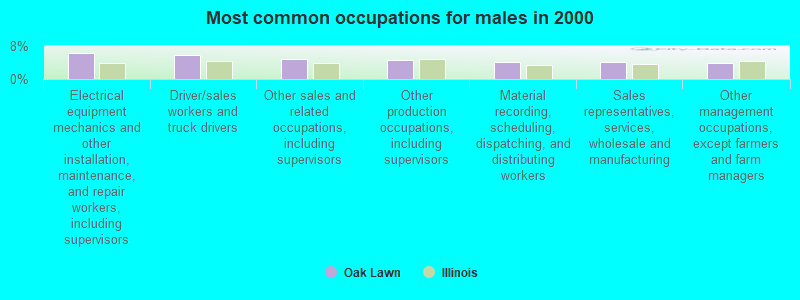
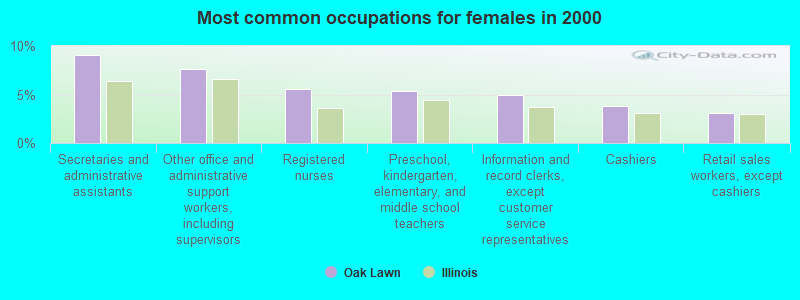
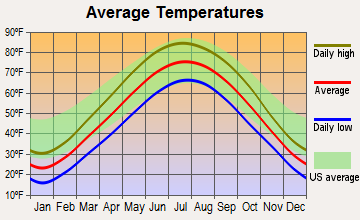
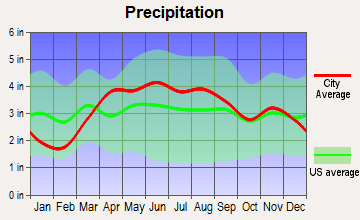
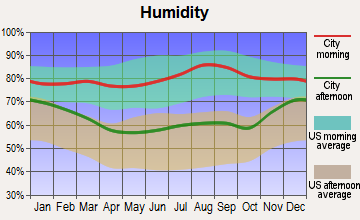
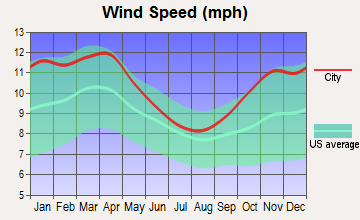
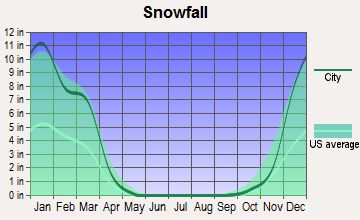
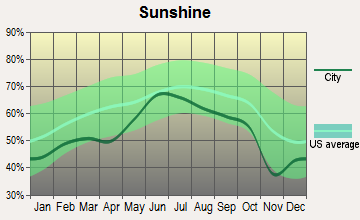
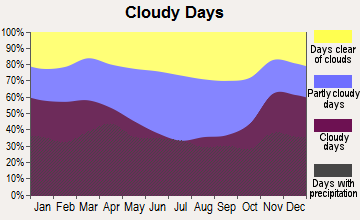
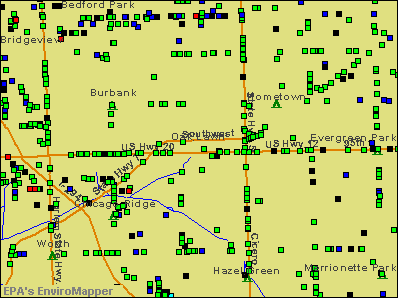

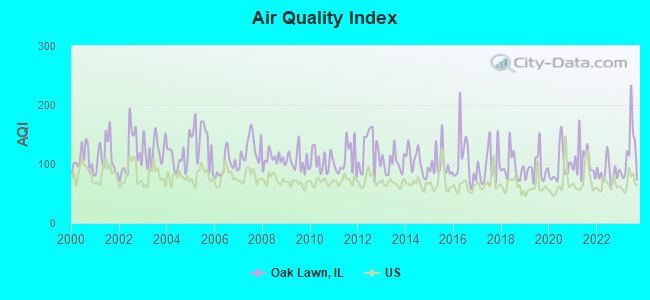
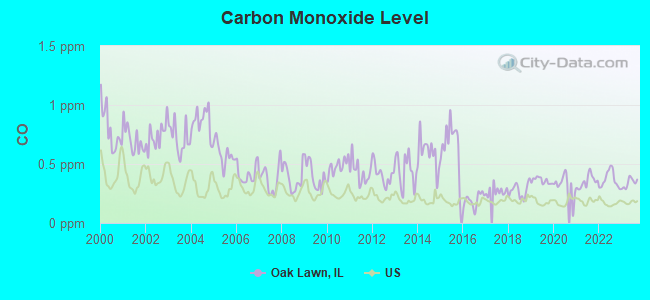
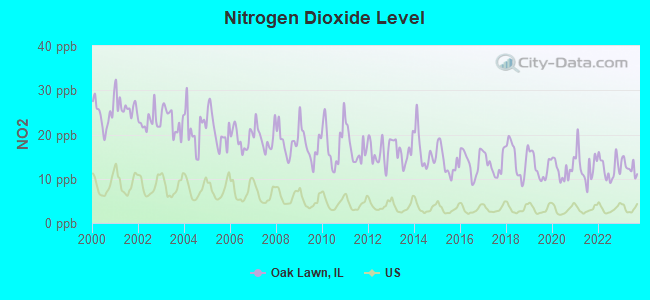
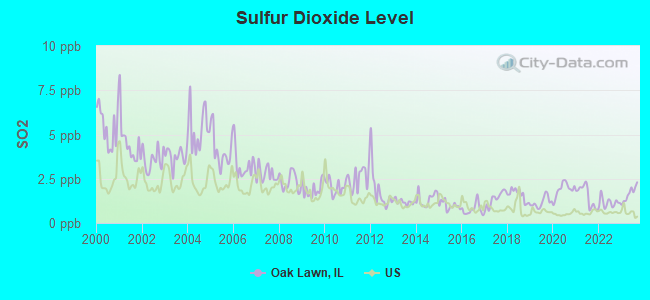
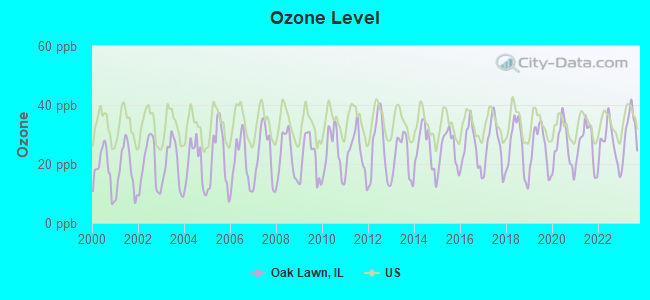
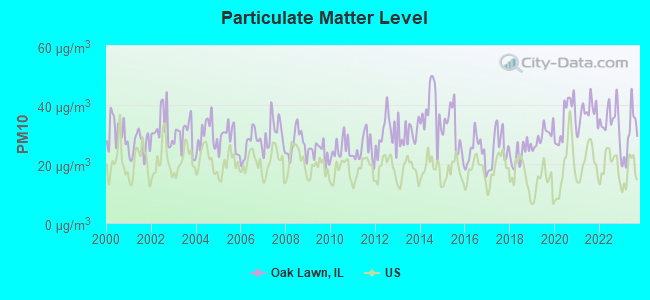
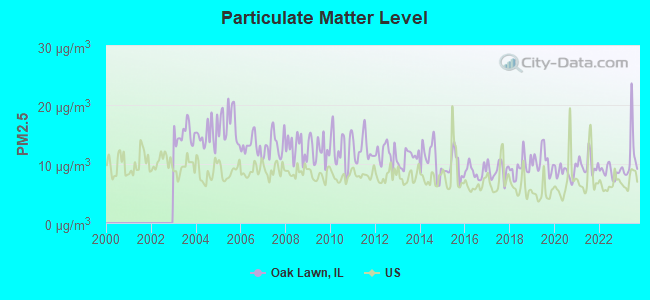
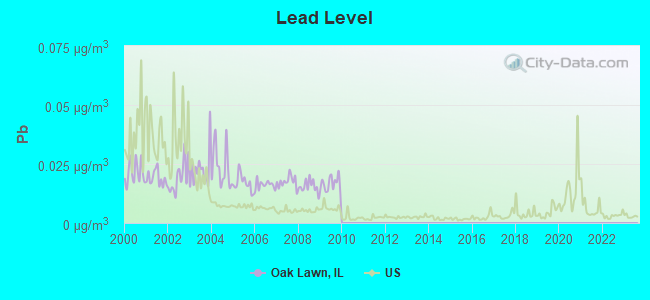
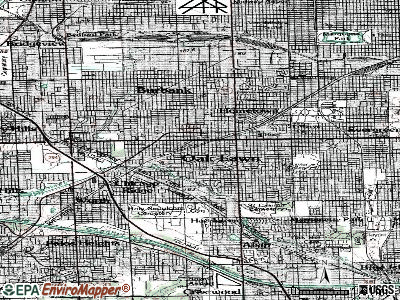
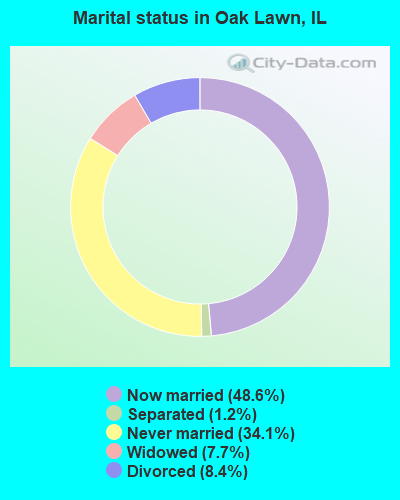
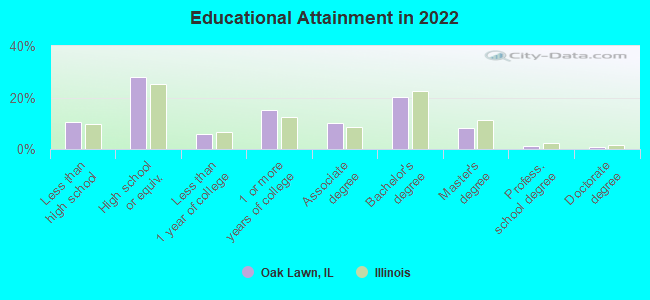
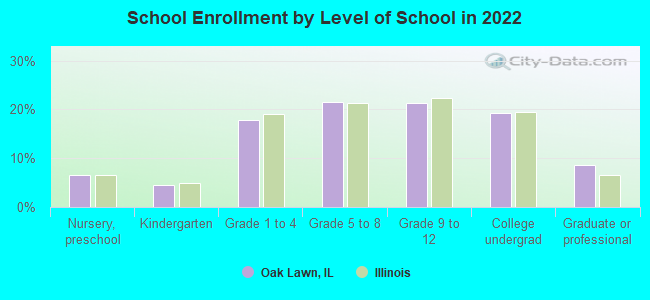
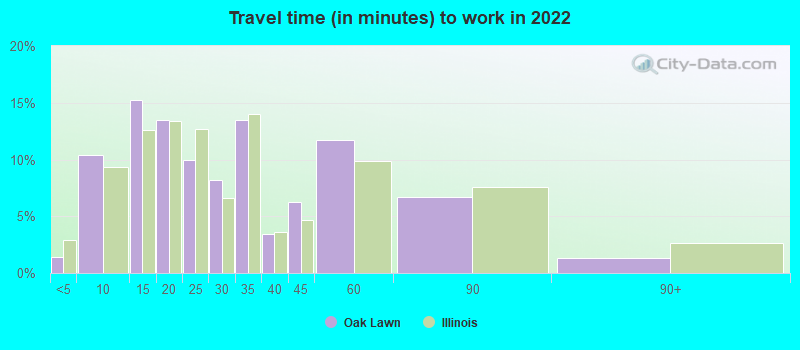
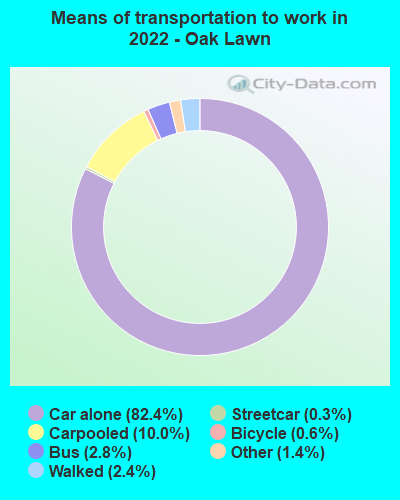


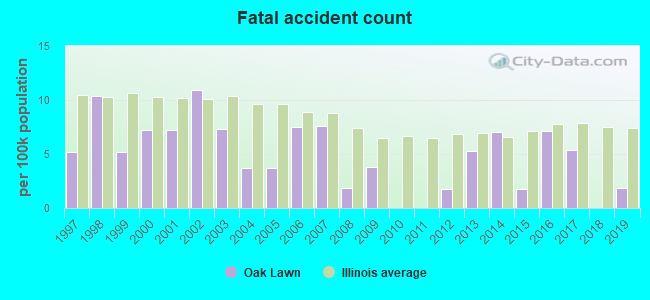
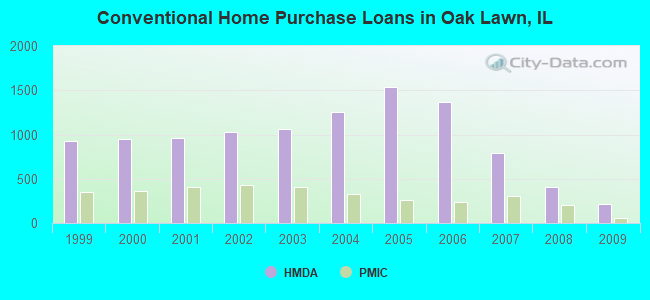
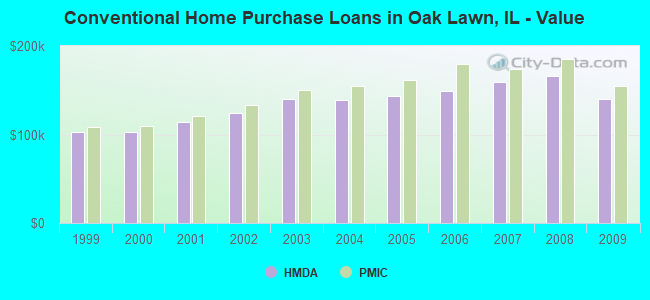
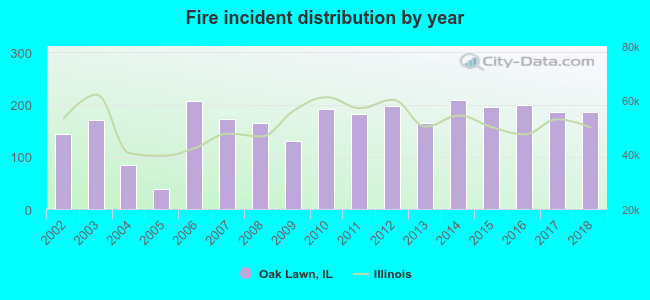 According to the data from the years 2002 - 2018 the average number of fires per year is 166. The highest number of fire incidents - 208 took place in 2014, and the least - 39 in 2005. The data has a growing trend.
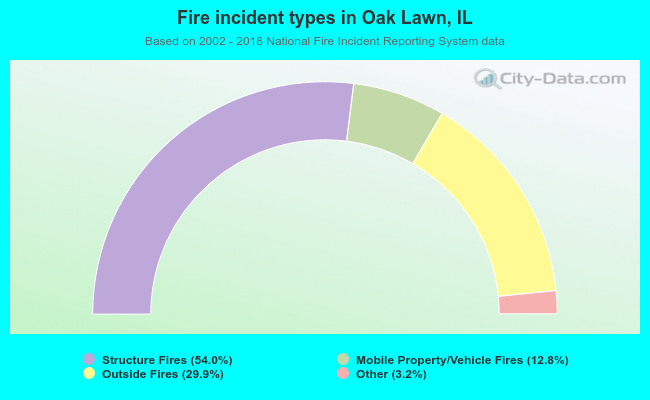 When looking into fire subcategories, the most reports belonged to: Structure Fires (54.0%), and Outside Fires (29.9%).