Estimated zip code population in 2022: 4,919 Zip code population in 2010: 4,836 Zip code population in 2000: 4,637
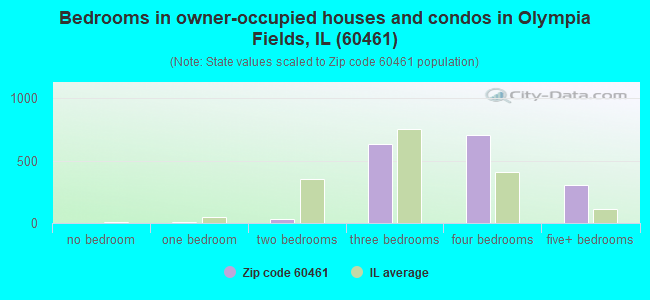
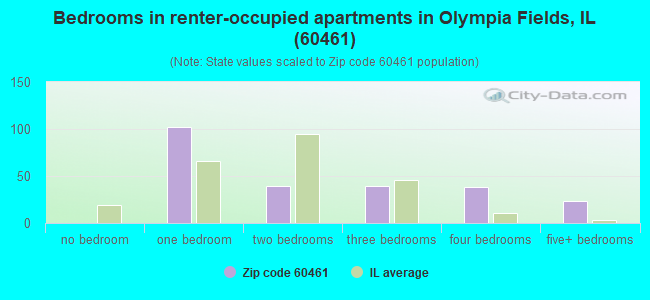
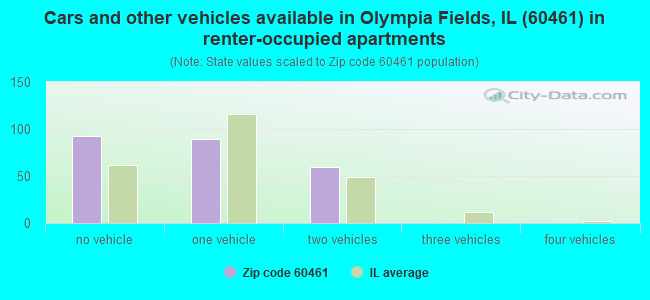
Houses and condos: 2,100 Renter-occupied apartments: 242
% of renters here:
13%
State:
33%
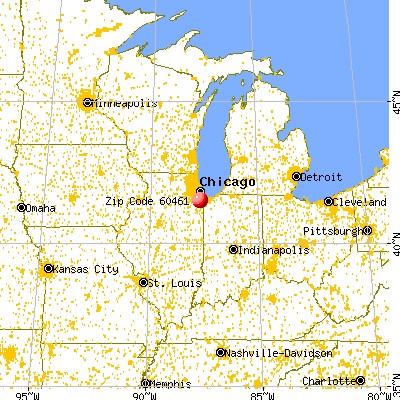
March 2022 cost of living index in zip code 60461: 107.8 (more than average, U.S. average is 100)
Land area: 2.8 sq. mi. Water area: 0.0 sq. mi.
Population density: 1,769 people per square mile
(low).
OSM Map
General Map
Google Map
MSN Map
OSM Map
General Map
Google Map
MSN Map
OSM Map
General Map
Google Map
MSN Map
OSM Map
General Map
Google Map
MSN Map
Please wait while loading the map...
Real estate property taxes paid for housing units in 2022:
This zip code:
2.9% ($8,429)
Illinois:
2.0% ($4,912)
Median real estate property taxes paid for housing units with mortgages in 2022: $7,983 (2.8%) Median real estate property taxes paid for housing units with no mortgage in 2022: $9,049 (3.0%)
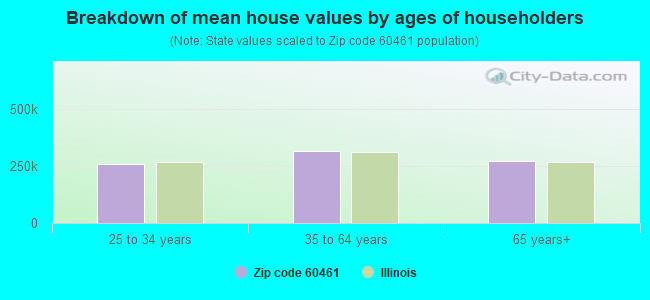
Estimated median house/condo value in 2022: $289,482
60461:
$289,482
Illinois:
$251,600
According to our research of Illinois and other state lists, there were 4 registered sex offenders living in 60461 zip code as of April 26, 2024. The ratio of all residents to sex offenders in zip code 60461 is 1,201 to 1. The ratio of registered sex offenders to all residents in this zip code is lower than the state average.
Median resident age:
This zip code:
42.4 years
Illinois median age:
39.1 years
Average household size:
This zip code:
2.5 people
Illinois:
2.4 people
Averages for the 2020 tax year for zip code 60461, filed in 2021:
Average Adjusted Gross Income (AGI) in 2020: $88,019 (Individual Income Tax Returns)
Here:
$88,019
State:
$82,626
Salary/wage: $69,711 (reported on 71.5% of returns)
Here:
$69,711
State:
$66,640
(% of AGI for various income ranges: 1277.0% for AGIs below $25k, 3443.2% for AGIs $25k-50k, 5776.8% for AGIs $50k-75k, 8564.1% for AGIs $75k-100k, 16766.5% for AGIs $100k-200k, 71326.0% for AGIs over 200k)
Taxable interest for individuals: $1,689 (reported on 28.1% of returns)
This zip code:
$1,689
Illinois:
$2,376
(% of AGI for various income ranges: 13.3% for AGIs below $25k, 11.2% for AGIs $25k-50k, 41.8% for AGIs $50k-75k, 111.8% for AGIs $75k-100k, 174.2% for AGIs $100k-200k, 714.0% for AGIs over 200k)
Ordinary dividends: $8,235 (reported on 21.1% of returns)
Here:
$8,235
State:
$9,061
(% of AGI for various income ranges: 24.1% for AGIs below $25k, 38.8% for AGIs $25k-50k, 117.1% for AGIs $50k-75k, 283.5% for AGIs $75k-100k, 391.9% for AGIs $100k-200k, 4750.0% for AGIs over 200k)
Net capital gain/loss in AGI: +$15,978 (reported on 18.0% of returns)
Here:
+$15,978
State:
+$31,684
(% of AGI for various income ranges: 7.0% for AGIs below $25k, 78.5% for AGIs $25k-50k, 73.9% for AGIs $50k-75k, 158.2% for AGIs $75k-100k, 433.5% for AGIs $100k-200k, 10896.0% for AGIs over 200k)
Profit/loss from business: +$2,518 (reported on 22.3% of returns)
Here:
+$2,518
State:
+$12,175
(% of AGI for various income ranges: 64.7% for AGIs $75k-100k, 275.8% for AGIs $100k-200k, 2604.0% for AGIs over 200k)
Taxable individual retirement arrangement distribution: $28,803 (reported on 14.1% of returns)
60461:
$28,803
Illinois:
$21,613
(% of AGI for various income ranges: 90.4% for AGIs below $25k, 168.2% for AGIs $25k-50k, 269.6% for AGIs $50k-75k, 635.9% for AGIs $75k-100k, 1339.6% for AGIs $100k-200k, 8124.0% for AGIs over 200k)
Total itemized deductions: $30,861 (reported on 26.2% of returns)
Here:
$30,861
State:
$34,948
(% of AGI for various income ranges: 178.7% for AGIs below $25k, 381.8% for AGIs $25k-50k, 1252.5% for AGIs $50k-75k, 1900.6% for AGIs $75k-100k, 2760.4% for AGIs $100k-200k, 9284.0% for AGIs over 200k)
Charity contributions: $11,773 (reported on 23.4% of returns)
Here:
$11,773
State:
$13,122
(% of AGI for various income ranges: 23.3% for AGIs below $25k, 72.6% for AGIs $25k-50k, 289.6% for AGIs $50k-75k, 459.4% for AGIs $75k-100k, 995.8% for AGIs $100k-200k, 5058.0% for AGIs over 200k)
Taxes paid: $8,448 (reported on 26.2% of returns)
60461:
$8,448
State:
$8,563
(% of AGI for various income ranges: 57.6% for AGIs below $25k, 120.3% for AGIs $25k-50k, 374.3% for AGIs $50k-75k, 555.9% for AGIs $75k-100k, 817.3% for AGIs $100k-200k, 1736.0% for AGIs over 200k)
Earned income credit: $2,272 (reported on 9.8% of returns)
Here:
$2,272
State:
$2,311
(% of AGI for various income ranges: 88.0% for AGIs below $25k, 47.9% for AGIs $25k-50k)
Percentage of individuals using paid preparers for their 2020 taxes: 89.1%
Here:
89%
State:
93%
(% for various income ranges: 88.9% for AGIs below $25k, 91.3% for AGIs $25k-50k, 90.0% for AGIs $50k-75k, 86.7% for AGIs $75k-100k, 87.9% for AGIs $100k-200k, 89.5% for AGIs over 200k)
Averages for the 2012 tax year for zip code 60461, filed in 2013:
Average Adjusted Gross Income (AGI) in 2012: $86,231 (Individual Income Tax Returns)
Here:
$86,231
State:
$68,058
Salary/wage: $66,987 (reported on 73.1% of returns)
Here:
$66,987
State:
$55,396
(% of AGI for various income ranges: 64.1% for AGIs below $25k, 67.3% for AGIs $25k-50k, 60.2% for AGIs $50k-75k, 60.6% for AGIs $75k-100k, 56.9% for AGIs $100k-200k, 51.2% for AGIs over 200k)
Taxable interest for individuals: $2,167 (reported on 41.8% of returns)
This zip code:
$2,167
Illinois:
$1,969
(% of AGI for various income ranges: 1.9% for AGIs below $25k, 0.9% for AGIs $25k-50k, 1.2% for AGIs $50k-75k, 0.7% for AGIs $75k-100k, 1.3% for AGIs $100k-200k, 0.8% for AGIs over 200k)
Ordinary dividends: $8,577 (reported on 28.5% of returns)
Here:
$8,577
State:
$7,786
(% of AGI for various income ranges: 3.5% for AGIs below $25k, 2.1% for AGIs $25k-50k, 2.0% for AGIs $50k-75k, 1.4% for AGIs $75k-100k, 2.5% for AGIs $100k-200k, 4.0% for AGIs over 200k)
Net capital gain/loss in AGI: +$11,623 (reported on 20.9% of returns)
Here:
+$11,623
State:
+$22,183
(% of AGI for various income ranges: 0.3% for AGIs $100k-200k, 8.2% for AGIs over 200k)
Profit/loss from business: +$12,663 (reported on 21.7% of returns)
Here:
+$12,663
State:
+$12,903
(% of AGI for various income ranges: 9.7% for AGIs below $25k, 0.5% for AGIs $25k-50k, 1.5% for AGIs $50k-75k, 1.2% for AGIs $75k-100k, 2.8% for AGIs $100k-200k, 4.5% for AGIs over 200k)
Taxable individual retirement arrangement distribution: $26,894 (reported on 19.3% of returns)
60461:
$26,894
Illinois:
$17,929
(% of AGI for various income ranges: 4.3% for AGIs below $25k, 4.1% for AGIs $25k-50k, 7.4% for AGIs $50k-75k, 4.4% for AGIs $75k-100k, 6.4% for AGIs $100k-200k, 6.4% for AGIs over 200k)
Total itemized deductions: $31,044 (25% of AGI, reported on 59.8% of returns)
Here:
$31,044
State:
$26,433
Here:
24.9% of AGI
State:
19.2% of AGI
(% of AGI for various income ranges: 25.2% for AGIs below $25k, 24.6% for AGIs $25k-50k, 28.2% for AGIs $50k-75k, 26.0% for AGIs $75k-100k, 22.5% for AGIs $100k-200k, 16.0% for AGIs over 200k)
Charity contributions: $7,053 (reported on 54.2% of returns)
Here:
$7,053
State:
$4,525
(% of AGI for various income ranges: 2.2% for AGIs below $25k, 3.2% for AGIs $25k-50k, 5.3% for AGIs $50k-75k, 4.7% for AGIs $75k-100k, 4.7% for AGIs $100k-200k, 4.4% for AGIs over 200k)
Taxes paid: $13,136 (reported on 59.4% of returns)
60461:
$13,136
State:
$11,968
(% of AGI for various income ranges: 9.2% for AGIs below $25k, 9.3% for AGIs $25k-50k, 10.9% for AGIs $50k-75k, 10.2% for AGIs $75k-100k, 9.6% for AGIs $100k-200k, 7.5% for AGIs over 200k)
Earned income credit: $2,204 (reported on 11.2% of returns)
Here:
$2,204
State:
$2,349
(% of AGI for various income ranges: 6.4% for AGIs below $25k, 0.5% for AGIs $25k-50k)
Percentage of individuals using paid preparers for their 2012 taxes: 58.6%
Here:
59%
State:
57%
(% for various income ranges: 48.6% for AGIs below $25k, 58.5% for AGIs $25k-50k, 61.1% for AGIs $50k-75k, 60.7% for AGIs $75k-100k, 64.2% for AGIs $100k-200k, 73.7% for AGIs over 200k)
Averages for the 2004 tax year for zip code 60461, filed in 2005:
Average Adjusted Gross Income (AGI) in 2004: $95,788 (Individual Income Tax Returns)
Here:
$95,788
State:
$54,625
Salary/wage: $73,040 (reported on 73.8% of returns)
Here:
$73,040
State:
$46,811
(% of AGI for various income ranges: 162.8% for AGIs below $10k, 57.9% for AGIs $10k-25k, 70.1% for AGIs $25k-50k, 65.1% for AGIs $50k-75k, 60.8% for AGIs $75k-100k, 52.5% for AGIs over 100k)
Taxable interest for individuals: $3,308 (reported on 62.1% of returns)
This zip code:
$3,308
Illinois:
$2,101
(% of AGI for various income ranges: 10.1% for AGIs below $10k, 7.6% for AGIs $10k-25k, 2.5% for AGIs $25k-50k, 2.4% for AGIs $50k-75k, 2.8% for AGIs $75k-100k, 1.7% for AGIs over 100k)
Taxable dividends: $6,514 (reported on 43.3% of returns)
Here:
$6,514
State:
$4,306
(% of AGI for various income ranges: 13.2% for AGIs below $10k, 5.9% for AGIs $10k-25k, 3.4% for AGIs $25k-50k, 2.8% for AGIs $50k-75k, 1.9% for AGIs $75k-100k, 2.9% for AGIs over 100k)
Net capital gain/loss: +$17,089 (reported on 36.0% of returns)
Here:
+$17,089
State:
+$17,321
(% of AGI for various income ranges: -0.9% for AGIs below $10k, 0.6% for AGIs $10k-25k, -0.9% for AGIs $25k-50k, 1.6% for AGIs $50k-75k, 1.5% for AGIs $75k-100k, 8.6% for AGIs over 100k)
Profit/loss from business: +$18,044 (reported on 20.6% of returns)
Here:
+$18,044
State:
+$11,771
(% of AGI for various income ranges: 18.0% for AGIs below $10k, 6.2% for AGIs $10k-25k, 2.4% for AGIs $25k-50k, 2.0% for AGIs $50k-75k, 3.5% for AGIs $75k-100k, 4.1% for AGIs over 100k)
IRA payment deduction: $3,393 (reported on 2.4% of returns)
60461:
$3,393
Illinois:
$3,087
Self-employed pension: $19,065 (reported on 1.3% of returns)
Here:
$19,065
Illinois:
$16,965
Total itemized deductions: $27,878 (21% of AGI, reported on 63.4% of returns)
Here:
$27,878
State:
$20,239
Here:
20.6% of AGI
State:
19.5% of AGI
(% of AGI for various income ranges: 61.3% for AGIs below $10k, 36.2% for AGIs $10k-25k, 29.3% for AGIs $25k-50k, 28.4% for AGIs $50k-75k, 25.1% for AGIs $75k-100k, 14.4% for AGIs over 100k)
Charity contributions deductions: $7,023 (5% of AGI, reported on 59.4% of returns)
Here:
$7,023
State:
$3,719
Here:
5.2% of AGI
State:
3.4% of AGI
(% of AGI for various income ranges: 3.2% for AGIs below $10k, 4.6% for AGIs $10k-25k, 4.5% for AGIs $25k-50k, 5.2% for AGIs $50k-75k, 4.8% for AGIs $75k-100k, 4.2% for AGIs over 100k)
Total tax: $19,491 (reported on 81.1% of returns)
60461:
$19,491
State:
$9,882
(% of AGI for various income ranges: 5.7% for AGIs below $10k, 4.1% for AGIs $10k-25k, 6.4% for AGIs $25k-50k, 9.0% for AGIs $50k-75k, 10.4% for AGIs $75k-100k, 19.7% for AGIs over 100k)
Earned income credit: $1,757 (reported on 7.2% of returns)
Here:
$1,757
State:
$1,788
Percentage of individuals using paid preparers for their 2004 taxes: 63.9%
Here:
64%
State:
61%
(% for various income ranges: 58.4% for AGIs below $10k, 57.0% for AGIs $10k-25k, 63.0% for AGIs $25k-50k, 66.6% for AGIs $50k-75k, 65.5% for AGIs $75k-100k, 69.1% for AGIs over 100k)
Household received Food Stamps/SNAP in the past 12 months: 141 Household did not receive Food Stamps/SNAP in the past 12 months: 1,756
Women who had a birth in the past 12 months: 64 (64 now married, 0 unmarried) Women who did not have a birth in the past 12 months: 915 (268 now married, 650 unmarried)
Housing units in zip code 60461 with a mortgage: 1,271 (64 second mortgage, 64 both second mortgage and home equity loan) Houses without a mortgage: 19
Median monthly owner costs for units with a mortgage: $2,339 Median monthly owner costs for units without a mortgage: $1,065
Residents with income below the poverty level in 2022:
This zip code:
13.0%
Whole state:
11.9%
Residents with income below 50% of the poverty level in 2022:
This zip code:
3.6%
Whole state:
5.7%
Median number of rooms in houses and condos:
Here:
7.9
State:
6.4
Median number of rooms in apartments:
Here:
3.9
State:
4.1
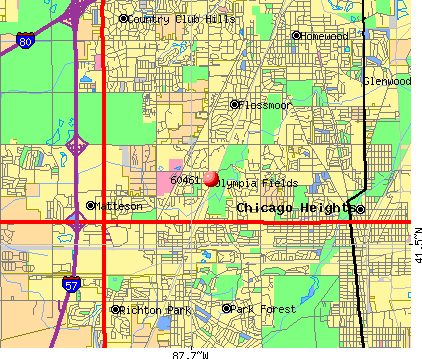
Notable locations in this zip code not listed on our city pages
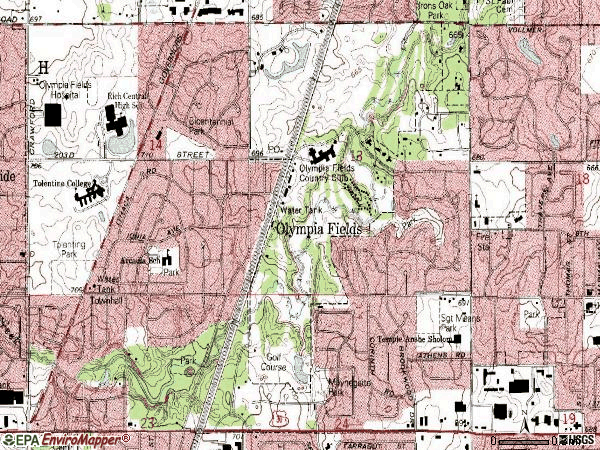
Churches in zip code 60461 include: Temple Anshe Sholom (A), Central Baptist Church (B), Olympia Fields United Methodist Church (C), Assumption Greek Orthodox Church (D). Display/hide their locations on the map
Parks in zip code 60461 include: Arcadia Park (1), Spirit Trail Park (2), Tolentine Park (3), Bicentennial Park (4), Sergeant Means Park (5). Display/hide their locations on the map
In group quarters: 104 (-1 institutionalized population)
Size of family households: 515 2-persons, 231 3-persons, 241 4-persons, 107 5-persons, 24 6-persons, 53 7-or-more-persons
Size of nonfamily households: 704 1-person, 36 2-persons
468 married couples with children.
300 single-parent households (300 women).
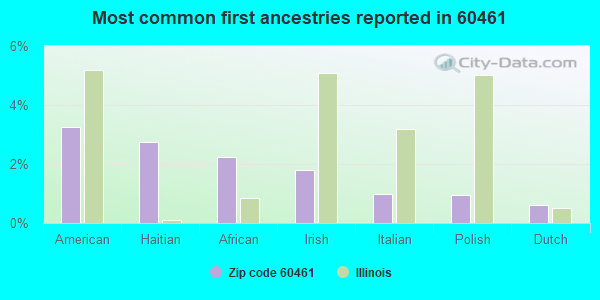
93.6% of residents of 60461 zip code speak English at home.
1.0% of residents speak Spanish at home (72% very well, 4% well, 24% not well).
2.9% of residents speak other Indo-European language at home (76% very well, 24% well).
2.0% of residents speak Asian or Pacific Island language at home (71% well, 29% not well).
0.8% of residents speak other language at home (100% very well).
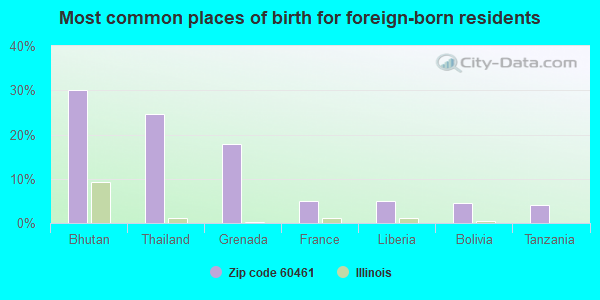
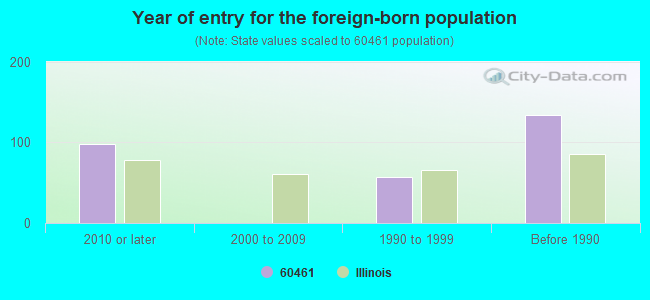
Foreign born population: 224 (4.6%) (82.6% of them are naturalized citizens)
Facilities with environmental interests located in this zip code:
OLYMPIA FIELDS COUNTRY CLUB (2800 COUNTRY CLUB DR in OLYMPIA FIELDS, IL)
STATE MASTER (Illinois EPA Project) - SOLID WASTE PROGRAM, HAZARDOUS WASTE PROGRAM STATE MASTER (Illinois EPA Project) - DRINKING WATER PROGRAM Large Quantity Generators, more that 1000 kg of hazardous waste/month (Resource Conservation and Recovery Act (tracking hazardous waste)) - notification Organizations: MEMBER OWNED/V GRECI-PRESIDENT (CONTACT/OWNER)
OLYMPIA FIELDS COUNTRY CLUB (20300 WESTERN AVE in OLYMPIA FIELDS, IL)
STATE MASTER (Illinois EPA Project) - SOLID WASTE PROGRAM, HAZARDOUS WASTE PROGRAM Small Quantity Generators, between 100 kg and 1000 kg of hazardous waste/month (Resource Conservation and Recovery Act (tracking hazardous waste)) - notification COMMUNITY WATER SYSTEM (SDWIS) - SDWIS-IL0310260 14740, WATER TREATMENT PLANT
OLYMPIA CLEANERS (2442 W LINCOLN HIGHWAY in OLYMPIA FIELDS, IL)
STATE MASTER (Illinois EPA Project) - HAZARDOUS WASTE PROGRAM, AIR PROGRAM AIR MINOR (AIRS/AFS) CRITERIA AND HAZARDOUS AIR POLLUTANT INVENTORY (Inventory of air pollution sources) Conditionally Exempt Small Quantity Generators, less than 100 kg/month of hazardous waste (Resource Conservation and Recovery Act (tracking hazardous waste)) - notification Business SIC classification: GARMENT PRESSING, AND AGENTS FOR LAUNDRIES AND DRYCLEANERS Business NAICS classification: DRYCLEANING AND LAUNDRY SERVICES (EXCEPT COIN-OPERATED). Organizations: WELKER D STEVEN (CONTACT/OWNER)
RICH TOWNSHIP HIGH SCHOOL (3600 W 203RD ST in OLYMPIA FIELDS, IL)
STATE MASTER (Illinois EPA Project) - HAZARDOUS WASTE PROGRAM Large Quantity Generators, more that 1000 kg of hazardous waste/month (Resource Conservation and Recovery Act (tracking hazardous waste)) Organizations: RICH TWP SCHOOL DIST 227 (CONTACT/OPERATOR)
Alternative names: RICH CENTRAL CAMPUS HIGH SCHOOL
HAROLD MOTORS (2501 W LINCOLN HWY in OLYMPIA FIELDS, IL)
STATE MASTER (Illinois EPA Project) - HAZARDOUS WASTE PROGRAM, SOLID WASTE PROGRAM Small Quantity Generators, between 100 kg and 1000 kg of hazardous waste/month (Resource Conservation and Recovery Act (tracking hazardous waste)) - notification Organizations: EISENSTEIN HAROLD (CONTACT/OWNER)
Alternative names: HAROLD MOTORS MAZDA
MARV S TRUCKING INC (773 BYRON CT in OLYMPIA FIELDS, IL)
STATE MASTER (Illinois EPA Project) - AIR PROGRAM AIR MINOR (AIRS/AFS) Business SIC classification: NONCLASSIFIABLE ESTABLISHMENTS Alternative names: MARVS TRUCKING INCORPORATED
CURRIE MOTORS AUTO PLANET (21000 S WESTERN AVE in OLYMPIA FIELDS, IL)
STATE MASTER (Illinois EPA Project) - SOLID WASTE PROGRAM, HAZARDOUS WASTE PROGRAM Conditionally Exempt Small Quantity Generators, less than 100 kg/month of hazardous waste (Resource Conservation and Recovery Act (tracking hazardous waste)) - notification Organizations: CURFIN PROPERTIES (CONTACT/OWNER)
Alternative names: OLYMPIA FIELDS FORD
HAROLD MOTORS INC (2525 LINCOLN HWY in OLYMPIA FIELDS, IL)
STATE MASTER (Illinois EPA Project) - SOLID WASTE PROGRAM, HAZARDOUS WASTE PROGRAM Conditionally Exempt Small Quantity Generators, less than 100 kg/month of hazardous waste (Resource Conservation and Recovery Act (tracking hazardous waste)) - notification Organizations: EISENSTEIN H (CONTACT/OWNER)
JEWEL FOOD STORES, INC. #3090 (2500 LINCOLN HIGHWAY in OLYMPIA FIELDS, IL)
AIR MINOR (AIRS/AFS) - ICIS-05-2003-0340, ENFORCEMENT/COMPLIANCE ACTIVITY Business SIC classification: GROCERY STORES
ARCADIA ELEM SCHOOL (20519 ARCADIAN WAY in OLYMPIA FIELDS, IL)
(National Center for Education Statistics) - STATE ID-1401616202001 Organizations: MATTESON ELEM SCHOOL DIST 162 (SCHOOL DISTRICT)
ADVANCE CONSTRUCTION (2440 LINCOLN HIGHWAY in OLYMPIA FIELDS, IL)
National Pollutant Discharge Elimination System NON-MAJOR (Tracking pollutant discharge elimination systems) - permit
ILDOT GOVERNORS HWY (GOVERNORS HWY & in OLYMPIA FIELDS, IL)
Small Quantity Generators, between 100 kg and 1000 kg of hazardous waste/month (Resource Conservation and Recovery Act (tracking hazardous waste)) - notification Organizations: ILLINOIS STATE OF (CONTACT/OWNER)
Housing units lacking complete kitchen facilities: 2.8%
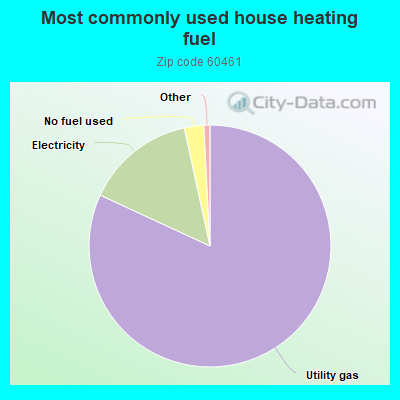
82.0%Utility gas
14.7%Electricity
2.6%No fuel used
Population in 1990: 4,253. Population change in the 1990s: +384 (+9.0%).
Place of birth for U.S.-born residents:
This state: 3,908
Northeast: 88
Midwest: 301
South: 283
West: 33
62% of the 60461 zip code residents lived in the same house 5 years ago. Out of people who lived in different houses, 84% lived in this county. Out of people who lived in different counties, 50% lived in Illinois.
90% of the 60461 zip code residents lived in the same house 1 year ago. Out of people who lived in different houses, 57% moved from this county. Out of people who lived in different houses, 31% moved from different county within same state. Out of people who lived in different houses, 11% moved from different state.
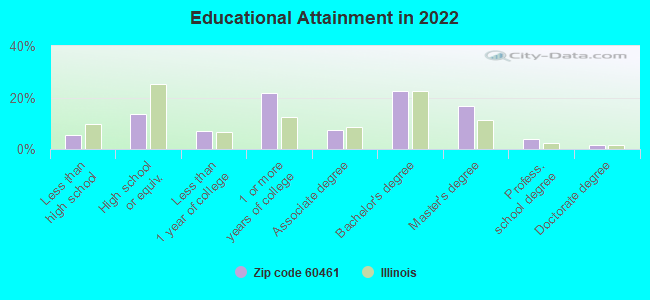
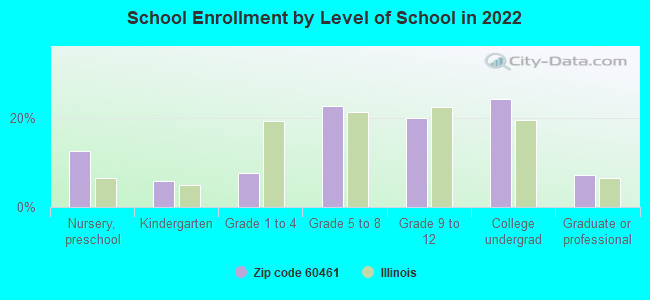
Private vs. public school enrollment:
Students in private schools in grades 1 to 8 (elementary and middle school): 50
Here:
15.2%
Illinois:
13.3%
Students in private schools in grades 9 to 12 (high school): 49
Here:
22.9%
Illinois:
9.9%
Students in private undergraduate colleges: 93
Here:
35.9%
Illinois:
27.4%
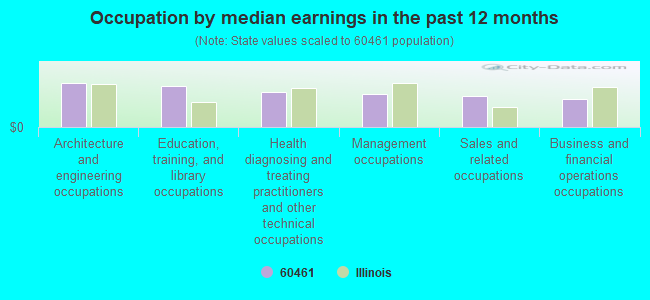
Occupation by median earnings in the past 12 months ($)
103,526Architecture and engineering occupations
98,581Education, training, and library occupations
82,239Health diagnosing and treating practitioners and other technical occupations
77,697Management occupations
74,310Sales and related occupations
65,468Business and financial operations occupations
Companies with federal contracts located in this zip code:
DORALIA A JACKSON DDS (21020 CAMBRIDGE LANE in OLYMPIA FIELDS, IL; small business) : $477,945 in 7 contractsfrom 2000 to 2005
Contracts for Dentistry Services by Navy Signed by year:2000: $129,878; 2001: $0; 2002: $82,956; 2003: $85,768; 2004: $88,343; 2005: $91,000; 2006: $0.
Biggest contracts:
$91,000 with Navy for Dentistry Services. Signed on 2005-10-21. Completion date: 2005-09-30.
$88,343, same as above.Signed on 2004-10-01. Completion date: 2005-09-30.
$85,768, same as above.Signed on 2003-10-01. Completion date: 2004-09-30.
$82,956, same as above.Signed on 2002-10-01. Completion date: 2003-09-30.
Top industries in this zip code by the number of employees in 2005:
Health Care and Social Assistance: General Medical and Surgical Hospitals (500-999 employees: 1 establishment)
Health Care and Social Assistance: Offices of Physicians (except Mental Health Specialists) (100-249: 1, 50-99: 1, 20-49: 1, 10-19: 10, 5-9: 6, 1-4: 12)
Administrative and Support and Waste Management and Remediation Services: Temporary Help Services (250-499: 1, 50-99: 1, 10-19: 1)
Professional, Scientific, and Technical Services: Marketing Research and Public Opinion Polling (100-249: 1, 20-49: 1, 10-19: 1)
Health Care and Social Assistance: Home Health Care Services (100-249: 1, 10-19: 1)
Other Services (except Public Administration): Civic and Social Organizations (100-249: 1)
Other Services (except Public Administration): Religious Organizations (50-99: 1, 20-49: 1, 1-4: 5)
Health Care and Social Assistance: Offices of Dentists (10-19: 2, 5-9: 7, 1-4: 5)
People in group quarters in 2010:
38 people in emergency and transitional shelters (with sleeping facilities) for people experiencing homelessness
16 people in other noninstitutional facilities
People in group quarters in 2000:
40 people in nursing homes
20 people in religious group quarters
Fatal accident statistics in 2014:
Fatal accident count: 1
Vehicles involved in fatal accidents: 2
Fatal accidents caused by drunken drivers: 0
Fatalities: 1
Persons involved in fatal accidents: 4
Pedestrians involved in fatal accidents: 1
Fatal accident statistics in 2013:
Fatal accident count: 2
Vehicles involved in fatal accidents: 2
Fatal accidents caused by drunken drivers: 0
Fatalities: 2
Persons involved in fatal accidents: 5
Pedestrians involved in fatal accidents: 1
Home Mortgage Disclosure Act Aggregated Statistics For Year 2009 (Based on 6 partial tracts)
A) FHA, FSA/RHS & VA Home Purchase Loans
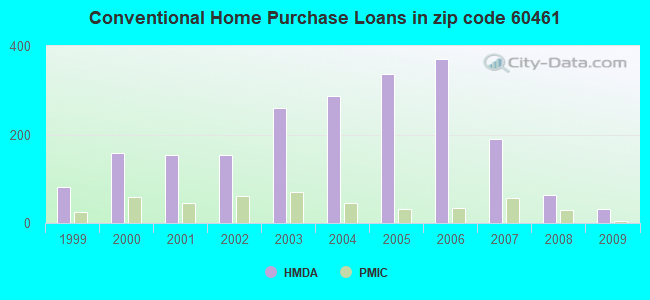
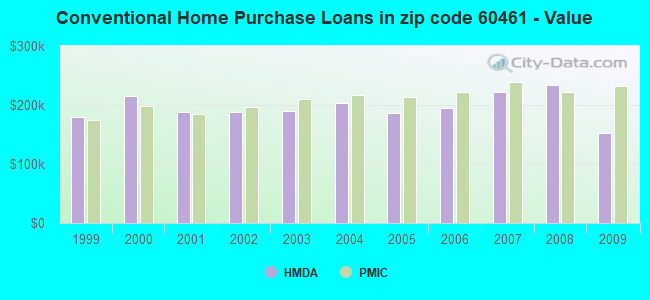
B) Conventional Home Purchase Loans
C) Refinancings
D) Home Improvement Loans
F) Non-occupant Loans on < 5 Family Dwellings (A B C & D)
Number
Average Value
Number
Average Value
Number
Average Value
Number
Average Value
Number
Average Value
LOANS ORIGINATED
69
$194,537
31
$153,194
185
$215,978
7
$117,183
11
$144,346
APPLICATIONS APPROVED, NOT ACCEPTED
5
$194,880
3
$105,303
31
$196,065
0
$0
0
$0
APPLICATIONS DENIED
29
$227,972
8
$192,296
124
$242,467
19
$31,644
3
$59,407
APPLICATIONS WITHDRAWN
17
$177,980
6
$141,882
43
$243,969
2
$90,220
3
$214,770
FILES CLOSED FOR INCOMPLETENESS
9
$168,070
4
$313,732
29
$237,530
2
$10,340
3
$24,570
Aggregated Statistics For Year 2008 (Based on 6 partial tracts)
A) FHA, FSA/RHS & VA Home Purchase Loans
B) Conventional Home Purchase Loans
C) Refinancings
D) Home Improvement Loans
E) Loans on Dwellings For 5+ Families
F) Non-occupant Loans on < 5 Family Dwellings (A B C & D)
Number
Average Value
Number
Average Value
Number
Average Value
Number
Average Value
Number
Average Value
Number
Average Value
LOANS ORIGINATED
42
$218,560
63
$234,535
180
$224,459
11
$79,937
1
$975,430
17
$134,235
APPLICATIONS APPROVED, NOT ACCEPTED
11
$245,442
9
$251,356
34
$254,447
3
$52,073
0
$0
4
$158,112
APPLICATIONS DENIED
25
$229,581
41
$274,287
222
$264,912
28
$53,264
0
$0
11
$158,976
APPLICATIONS WITHDRAWN
11
$271,263
11
$208,594
59
$259,856
2
$218,375
0
$0
2
$180,225
FILES CLOSED FOR INCOMPLETENESS
3
$270,767
7
$253,087
35
$321,436
4
$81,268
0
$0
3
$109,160
Aggregated Statistics For Year 2007 (Based on 6 partial tracts)
A) FHA, FSA/RHS & VA Home Purchase Loans
B) Conventional Home Purchase Loans
C) Refinancings
D) Home Improvement Loans
F) Non-occupant Loans on < 5 Family Dwellings (A B C & D)
G) Loans On Manufactured Home Dwelling (A B C & D)
Number
Average Value
Number
Average Value
Number
Average Value
Number
Average Value
Number
Average Value
Number
Average Value
LOANS ORIGINATED
9
$196,853
190
$222,829
271
$228,488
38
$93,868
25
$185,909
0
$0
APPLICATIONS APPROVED, NOT ACCEPTED
0
$0
45
$223,992
67
$239,681
12
$57,954
6
$175,525
1
$19,350
APPLICATIONS DENIED
5
$222,722
149
$250,804
311
$278,825
49
$111,889
30
$223,216
0
$0
APPLICATIONS WITHDRAWN
2
$270,020
18
$197,815
98
$251,747
7
$113,669
5
$178,960
0
$0
FILES CLOSED FOR INCOMPLETENESS
0
$0
20
$276,732
65
$305,449
1
$20,360
3
$212,137
0
$0
Aggregated Statistics For Year 2006 (Based on 6 partial tracts)
A) FHA, FSA/RHS & VA Home Purchase Loans
B) Conventional Home Purchase Loans
C) Refinancings
D) Home Improvement Loans
E) Loans on Dwellings For 5+ Families
F) Non-occupant Loans on < 5 Family Dwellings (A B C & D)
Number
Average Value
Number
Average Value
Number
Average Value
Number
Average Value
Number
Average Value
Number
Average Value
LOANS ORIGINATED
8
$219,634
371
$194,665
374
$223,985
49
$100,740
1
$138,850
25
$165,188
APPLICATIONS APPROVED, NOT ACCEPTED
1
$155,270
96
$186,812
117
$244,089
14
$122,834
0
$0
11
$143,831
APPLICATIONS DENIED
2
$166,535
235
$229,260
302
$247,307
41
$99,106
0
$0
23
$208,454
APPLICATIONS WITHDRAWN
1
$135,310
69
$209,541
131
$231,660
3
$192,740
0
$0
7
$128,136
FILES CLOSED FOR INCOMPLETENESS
0
$0
29
$212,053
52
$224,789
0
$0
0
$0
5
$226,862
Aggregated Statistics For Year 2005 (Based on 6 partial tracts)
A) FHA, FSA/RHS & VA Home Purchase Loans
B) Conventional Home Purchase Loans
C) Refinancings
D) Home Improvement Loans
E) Loans on Dwellings For 5+ Families
F) Non-occupant Loans on < 5 Family Dwellings (A B C & D)
G) Loans On Manufactured Home Dwelling (A B C & D)
Number
Average Value
Number
Average Value
Number
Average Value
Number
Average Value
Number
Average Value
Number
Average Value
Number
Average Value
LOANS ORIGINATED
15
$217,259
336
$186,615
345
$212,120
34
$102,686
5
$642,154
31
$167,046
0
$0
APPLICATIONS APPROVED, NOT ACCEPTED
1
$171,490
86
$208,628
84
$245,473
15
$109,410
0
$0
14
$198,763
0
$0
APPLICATIONS DENIED
5
$195,156
146
$206,146
307
$231,675
34
$80,911
0
$0
24
$226,558
2
$90,475
APPLICATIONS WITHDRAWN
3
$167,983
79
$204,107
126
$255,631
11
$214,379
0
$0
14
$182,911
0
$0
FILES CLOSED FOR INCOMPLETENESS
1
$160,960
18
$163,064
81
$244,022
1
$69,640
0
$0
4
$238,968
0
$0
Aggregated Statistics For Year 2004 (Based on 6 partial tracts)
A) FHA, FSA/RHS & VA Home Purchase Loans
B) Conventional Home Purchase Loans
C) Refinancings
D) Home Improvement Loans
E) Loans on Dwellings For 5+ Families
F) Non-occupant Loans on < 5 Family Dwellings (A B C & D)
G) Loans On Manufactured Home Dwelling (A B C & D)
Number
Average Value
Number
Average Value
Number
Average Value
Number
Average Value
Number
Average Value
Number
Average Value
Number
Average Value
LOANS ORIGINATED
15
$154,933
288
$203,689
421
$196,555
37
$74,543
3
$47,901,190
19
$133,319
0
$0
APPLICATIONS APPROVED, NOT ACCEPTED
1
$142,330
107
$229,928
82
$210,445
7
$32,201
0
$0
15
$153,615
1
$14,370
APPLICATIONS DENIED
2
$180,585
135
$215,768
295
$233,043
36
$60,420
0
$0
21
$152,569
0
$0
APPLICATIONS WITHDRAWN
2
$127,240
57
$226,620
151
$246,712
6
$145,702
0
$0
6
$198,588
0
$0
FILES CLOSED FOR INCOMPLETENESS
0
$0
14
$210,655
75
$262,224
1
$62,200
0
$0
0
$0
0
$0
Aggregated Statistics For Year 2003 (Based on 6 partial tracts)
A) FHA, FSA/RHS & VA Home Purchase Loans
B) Conventional Home Purchase Loans
C) Refinancings
D) Home Improvement Loans
E) Loans on Dwellings For 5+ Families
F) Non-occupant Loans on < 5 Family Dwellings (A B C & D)
Number
Average Value
Number
Average Value
Number
Average Value
Number
Average Value
Number
Average Value
Number
Average Value
LOANS ORIGINATED
30
$170,796
261
$190,366
693
$176,370
28
$121,120
2
$369,560
18
$133,522
APPLICATIONS APPROVED, NOT ACCEPTED
5
$135,382
64
$175,047
120
$178,850
3
$65,877
0
$0
7
$108,679
APPLICATIONS DENIED
8
$165,451
86
$205,325
320
$204,514
17
$21,595
0
$0
15
$164,768
APPLICATIONS WITHDRAWN
4
$191,675
40
$235,596
139
$211,631
7
$35,901
0
$0
3
$125,280
FILES CLOSED FOR INCOMPLETENESS
1
$218,510
12
$133,292
36
$198,964
3
$28,990
0
$0
1
$82,560
Aggregated Statistics For Year 2002 (Based on 6 partial tracts)
A) FHA, FSA/RHS & VA Home Purchase Loans
B) Conventional Home Purchase Loans
C) Refinancings
D) Home Improvement Loans
E) Loans on Dwellings For 5+ Families
F) Non-occupant Loans on < 5 Family Dwellings (A B C & D)
Number
Average Value
Number
Average Value
Number
Average Value
Number
Average Value
Number
Average Value
Number
Average Value
LOANS ORIGINATED
36
$165,420
153
$188,524
458
$183,839
26
$25,530
1
$377,560
8
$87,436
APPLICATIONS APPROVED, NOT ACCEPTED
3
$158,467
31
$196,140
99
$203,390
3
$33,097
0
$0
1
$95,700
APPLICATIONS DENIED
7
$225,400
78
$213,525
187
$217,391
31
$17,587
0
$0
6
$129,485
APPLICATIONS WITHDRAWN
7
$168,747
39
$169,502
100
$187,418
14
$42,912
0
$0
3
$94,507
FILES CLOSED FOR INCOMPLETENESS
2
$188,870
16
$175,391
64
$195,858
0
$0
0
$0
0
$0
Aggregated Statistics For Year 2001 (Based on 6 partial tracts)
A) FHA, FSA/RHS & VA Home Purchase Loans
B) Conventional Home Purchase Loans
C) Refinancings
D) Home Improvement Loans
F) Non-occupant Loans on < 5 Family Dwellings (A B C & D)
Number
Average Value
Number
Average Value
Number
Average Value
Number
Average Value
Number
Average Value
LOANS ORIGINATED
54
$159,919
154
$188,891
325
$165,292
21
$31,772
5
$152,728
APPLICATIONS APPROVED, NOT ACCEPTED
2
$118,670
21
$181,512
64
$141,788
9
$23,540
2
$96,315
APPLICATIONS DENIED
6
$164,993
75
$212,047
238
$180,981
28
$21,645
5
$206,446
APPLICATIONS WITHDRAWN
4
$123,495
31
$165,832
83
$208,783
10
$51,142
2
$114,040
FILES CLOSED FOR INCOMPLETENESS
0
$0
10
$166,810
37
$226,032
0
$0
0
$0
Aggregated Statistics For Year 2000 (Based on 6 partial tracts)
A) FHA, FSA/RHS & VA Home Purchase Loans
B) Conventional Home Purchase Loans
C) Refinancings
D) Home Improvement Loans
E) Loans on Dwellings For 5+ Families
F) Non-occupant Loans on < 5 Family Dwellings (A B C & D)
Number
Average Value
Number
Average Value
Number
Average Value
Number
Average Value
Number
Average Value
Number
Average Value
LOANS ORIGINATED
33
$140,853
158
$215,847
118
$166,189
33
$76,142
4
$69,542
13
$181,816
APPLICATIONS APPROVED, NOT ACCEPTED
3
$124,203
42
$196,540
29
$133,225
10
$25,216
0
$0
0
$0
APPLICATIONS DENIED
5
$134,746
78
$215,871
163
$190,068
30
$27,391
0
$0
1
$38,870
APPLICATIONS WITHDRAWN
4
$154,602
37
$230,252
69
$170,316
14
$57,587
0
$0
1
$91,540
FILES CLOSED FOR INCOMPLETENESS
0
$0
28
$196,226
45
$246,200
0
$0
0
$0
6
$149,795
Aggregated Statistics For Year 1999 (Based on 3 partial tracts)
A) FHA, FSA/RHS & VA Home Purchase Loans
B) Conventional Home Purchase Loans
C) Refinancings
D) Home Improvement Loans
E) Loans on Dwellings For 5+ Families
F) Non-occupant Loans on < 5 Family Dwellings (A B C & D)
2002 - 2018 National Fire Incident Reporting System (NFIRS) incidents
Based on the data from the years 2002 - 2018 the average number of fires per year is 15. The highest number of reported fire incidents - 38 took place in 2010, and the least - 5 in 2005. The data has a declining trend.
When looking into fire subcategories, the most reports belonged to: Structure Fires (62.0%), and Outside Fires (20.0%).
Fire incident types reported to NFIRS in Zip Code 60461


 Nearest zip codes: 60422, 60466, 60478, 60443, 60430, 60471.


 Based on the data from the years 2002 - 2018 the average number of fires per year is 15. The highest number of reported fire incidents - 38 took place in 2010, and the least - 5 in 2005. The data has a declining trend.
 When looking into fire subcategories, the most reports belonged to: Structure Fires (62.0%), and Outside Fires (20.0%).