Estimated zip code population in 2022: 2,390 Zip code population in 2010: 2,175 Zip code population in 2000: 1,933
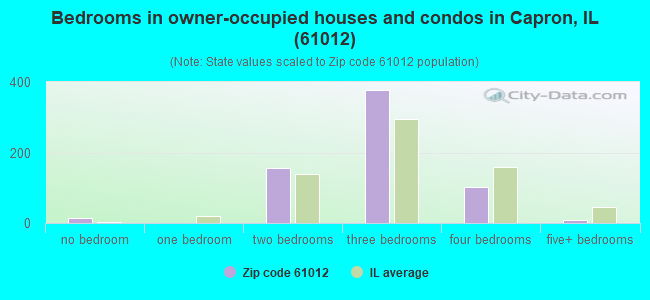
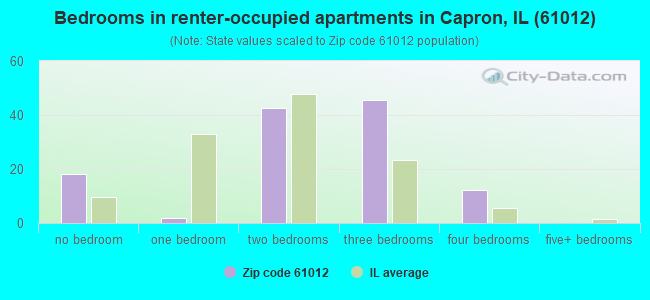
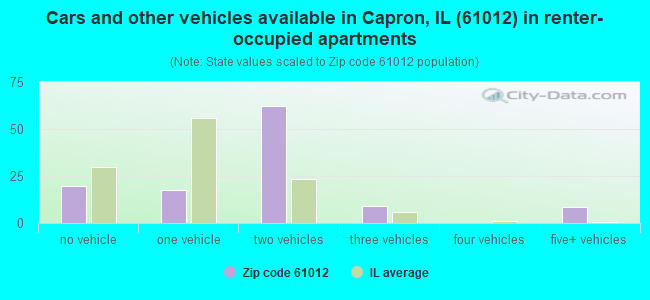
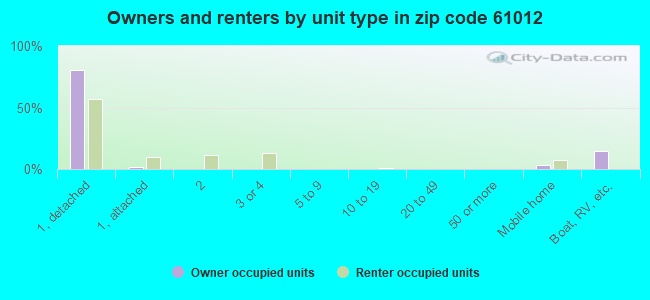
Houses and condos: 831 Renter-occupied apartments: 121
% of renters here:
16%
State:
33%
March 2022 cost of living index in zip code 61012: 84.7 (less than average, U.S. average is 100)
Land area: 36.3 sq. mi. Water area: 0.1 sq. mi.
Population density: 66 people per square mile
(very low).
OSM Map
General Map
Google Map
MSN Map
OSM Map
General Map
Google Map
MSN Map
OSM Map
General Map
Google Map
MSN Map
OSM Map
General Map
Google Map
MSN Map
Please wait while loading the map...
Real estate property taxes paid for housing units in 2022:
This zip code:
2.3% ($4,025)
Illinois:
2.0% ($4,912)
Median real estate property taxes paid for housing units with mortgages in 2022: $4,112 (2.4%) Median real estate property taxes paid for housing units with no mortgage in 2022: $3,695 (2.1%)
Averages for the 2020 tax year for zip code 61012, filed in 2021:
Average Adjusted Gross Income (AGI) in 2020: $53,945 (Individual Income Tax Returns)
Here:
$53,945
State:
$82,626
Salary/wage: $49,905 (reported on 85.8% of returns)
Here:
$49,905
State:
$66,640
(% of AGI for various income ranges: 1177.9% for AGIs below $25k, 3550.4% for AGIs $25k-50k, 6476.0% for AGIs $50k-75k, 9065.6% for AGIs $75k-100k, 17992.2% for AGIs $100k-200k)
Taxable interest for individuals: $468 (reported on 26.4% of returns)
This zip code:
$468
Illinois:
$2,376
(% of AGI for various income ranges: 22.1% for AGIs below $25k, 11.2% for AGIs $25k-50k, 16.0% for AGIs $50k-75k, 8.9% for AGIs $75k-100k, 21.1% for AGIs $100k-200k)
Ordinary dividends: $1,962 (reported on 12.3% of returns)
Here:
$1,962
State:
$9,061
(% of AGI for various income ranges: 15.8% for AGIs below $25k, 68.0% for AGIs $50k-75k, 127.8% for AGIs $100k-200k)
Net capital gain/loss in AGI: +$8,191 (reported on 10.4% of returns)
Here:
+$8,191
State:
+$31,684
(% of AGI for various income ranges: 32.9% for AGIs below $25k, 13.8% for AGIs $25k-50k, 145.3% for AGIs $50k-75k, 634.4% for AGIs $100k-200k)
Profit/loss from business: +$5,991 (reported on 10.4% of returns)
Here:
+$5,991
State:
+$12,175
(% of AGI for various income ranges: 97.9% for AGIs below $25k, 190.4% for AGIs $25k-50k)
Taxable individual retirement arrangement distribution: $13,483 (reported on 5.7% of returns)
61012:
$13,483
Illinois:
$21,613
(% of AGI for various income ranges: 182.1% for AGIs $25k-50k, 413.3% for AGIs $75k-100k)
Total itemized deductions: $23,900 (reported on 3.8% of returns)
Here:
$23,900
State:
$34,948
(% of AGI for various income ranges: 1062.2% for AGIs $75k-100k)
Charity contributions: $3,350 (reported on 1.9% of returns)
Here:
$3,350
State:
$13,122
(% of AGI for various income ranges: 27.9% for AGIs below $25k)
Taxes paid: $8,250 (reported on 3.8% of returns)
61012:
$8,250
State:
$8,563
(% of AGI for various income ranges: 366.7% for AGIs $75k-100k)
Earned income credit: $2,064 (reported on 13.2% of returns)
Here:
$2,064
State:
$2,311
(% of AGI for various income ranges: 66.2% for AGIs below $25k, 54.2% for AGIs $25k-50k)
Percentage of individuals using paid preparers for their 2020 taxes: 96.2%
Here:
96%
State:
93%
(% for various income ranges: 93.9% for AGIs below $25k, 93.1% for AGIs $25k-50k, 100.0% for AGIs $50k-75k, 100.0% for AGIs $75k-100k, 100.0% for AGIs $100k-200k)
Averages for the 2012 tax year for zip code 61012, filed in 2013:
Average Adjusted Gross Income (AGI) in 2012: $45,531 (Individual Income Tax Returns)
Here:
$45,531
State:
$68,058
Salary/wage: $40,247 (reported on 86.0% of returns)
Here:
$40,247
State:
$55,396
(% of AGI for various income ranges: 74.0% for AGIs below $25k, 84.9% for AGIs $25k-50k, 78.6% for AGIs $50k-75k, 81.4% for AGIs $75k-100k, 64.4% for AGIs $100k-200k)
Taxable interest for individuals: $853 (reported on 34.0% of returns)
This zip code:
$853
Illinois:
$1,969
(% of AGI for various income ranges: 1.8% for AGIs below $25k, 0.7% for AGIs $25k-50k, 0.7% for AGIs $50k-75k, 0.2% for AGIs $75k-100k, 0.4% for AGIs $100k-200k)
Ordinary dividends: $1,400 (reported on 15.0% of returns)
Here:
$1,400
State:
$7,786
(% of AGI for various income ranges: 1.3% for AGIs below $25k, 0.2% for AGIs $25k-50k, 0.4% for AGIs $50k-75k, 0.4% for AGIs $75k-100k, 0.4% for AGIs $100k-200k)
Net capital gain/loss in AGI: +$1,144 (reported on 9.0% of returns)
Here:
+$1,144
State:
+$22,183
(% of AGI for various income ranges: 1.1% for AGIs $100k-200k)
Profit/loss from business: +$5,909 (reported on 11.0% of returns)
Here:
+$5,909
State:
+$12,903
(% of AGI for various income ranges: 5.5% for AGIs below $25k, 1.7% for AGIs $25k-50k, 2.5% for AGIs $50k-75k)
Taxable individual retirement arrangement distribution: $8,210 (reported on 10.0% of returns)
61012:
$8,210
Illinois:
$17,929
(% of AGI for various income ranges: 3.3% for AGIs below $25k, 3.1% for AGIs $25k-50k, 4.1% for AGIs $75k-100k)
Total itemized deductions: $18,834 (25% of AGI, reported on 35.0% of returns)
Here:
$18,834
State:
$26,433
Here:
25.4% of AGI
State:
19.2% of AGI
(% of AGI for various income ranges: 8.8% for AGIs below $25k, 14.5% for AGIs $25k-50k, 17.1% for AGIs $50k-75k, 16.1% for AGIs $75k-100k, 13.7% for AGIs $100k-200k)
Charity contributions: $2,200 (reported on 24.0% of returns)
Here:
$2,200
State:
$4,525
(% of AGI for various income ranges: 0.7% for AGIs below $25k, 1.0% for AGIs $25k-50k, 1.2% for AGIs $50k-75k, 0.9% for AGIs $75k-100k, 1.6% for AGIs $100k-200k)
Taxes paid: $7,949 (reported on 35.0% of returns)
61012:
$7,949
State:
$11,968
(% of AGI for various income ranges: 2.5% for AGIs below $25k, 6.2% for AGIs $25k-50k, 6.5% for AGIs $50k-75k, 6.8% for AGIs $75k-100k, 6.6% for AGIs $100k-200k)
Earned income credit: $2,050 (reported on 16.0% of returns)
Here:
$2,050
State:
$2,349
(% of AGI for various income ranges: 5.1% for AGIs below $25k, 0.9% for AGIs $25k-50k)
Percentage of individuals using paid preparers for their 2012 taxes: 66.0%
Here:
66%
State:
57%
(% for various income ranges: 62.2% for AGIs below $25k, 69.0% for AGIs $25k-50k, 66.7% for AGIs $50k-75k, 70.0% for AGIs $75k-100k, 66.7% for AGIs $100k-200k)
Averages for the 2004 tax year for zip code 61012, filed in 2005:
Average Adjusted Gross Income (AGI) in 2004: $39,505 (Individual Income Tax Returns)
Here:
$39,505
State:
$54,625
Salary/wage: $37,081 (reported on 86.1% of returns)
Here:
$37,081
State:
$46,811
(% of AGI for various income ranges: 141.0% for AGIs below $10k, 75.8% for AGIs $10k-25k, 83.6% for AGIs $25k-50k, 85.6% for AGIs $50k-75k, 86.2% for AGIs $75k-100k, 63.7% for AGIs over 100k)
Taxable interest for individuals: $1,024 (reported on 42.6% of returns)
This zip code:
$1,024
Illinois:
$2,101
(% of AGI for various income ranges: 12.2% for AGIs below $10k, 3.5% for AGIs $10k-25k, 0.7% for AGIs $25k-50k, 0.8% for AGIs $50k-75k, 0.3% for AGIs $75k-100k, 0.9% for AGIs over 100k)
Taxable dividends: $1,071 (reported on 18.9% of returns)
Here:
$1,071
State:
$4,306
(% of AGI for various income ranges: 5.0% for AGIs below $10k, 0.4% for AGIs $10k-25k, 0.8% for AGIs $25k-50k, 0.4% for AGIs $50k-75k, 0.1% for AGIs $75k-100k, 0.4% for AGIs over 100k)
Net capital gain/loss: +$5,434 (reported on 13.2% of returns)
Here:
+$5,434
State:
+$17,321
(% of AGI for various income ranges: 4.4% for AGIs below $10k, 0.5% for AGIs $10k-25k, 0.6% for AGIs $25k-50k, 0.2% for AGIs $50k-75k, 0.2% for AGIs $75k-100k, 8.0% for AGIs over 100k)
Profit/loss from business: +$9,766 (reported on 12.7% of returns)
Here:
+$9,766
State:
+$11,771
(% of AGI for various income ranges: 2.0% for AGIs below $10k, 2.0% for AGIs $10k-25k, 1.2% for AGIs $25k-50k, 3.1% for AGIs $50k-75k, 0.4% for AGIs $75k-100k, 9.0% for AGIs over 100k)
Profit/loss from farming: +$2,222 (reported on 5.5% of returns)
Here:
+$2,222
State:
+$2,327
(% of AGI for various income ranges: -9.8% for AGIs below $10k, 2.6% for AGIs $10k-25k, 2.3% for AGIs $25k-50k, -2.4% for AGIs $75k-100k)
IRA payment deduction: $3,812 (reported on 1.6% of returns)
61012:
$3,812
Illinois:
$3,087
Total itemized deductions: $15,517 (25% of AGI, reported on 36.9% of returns)
Here:
$15,517
State:
$20,239
Here:
24.6% of AGI
State:
19.5% of AGI
(% of AGI for various income ranges: 17.9% for AGIs $10k-25k, 12.8% for AGIs $25k-50k, 15.6% for AGIs $50k-75k, 13.6% for AGIs $75k-100k, 15.1% for AGIs over 100k)
Charity contributions deductions: $1,743 (3% of AGI, reported on 29.1% of returns)
Here:
$1,743
State:
$3,719
Here:
2.6% of AGI
State:
3.4% of AGI
(% of AGI for various income ranges: 0.8% for AGIs $10k-25k, 1.1% for AGIs $25k-50k, 1.0% for AGIs $50k-75k, 1.0% for AGIs $75k-100k, 2.5% for AGIs over 100k)
Total tax: $4,713 (reported on 71.5% of returns)
61012:
$4,713
State:
$9,882
(% of AGI for various income ranges: 5.2% for AGIs below $10k, 3.8% for AGIs $10k-25k, 5.8% for AGIs $25k-50k, 8.0% for AGIs $50k-75k, 9.8% for AGIs $75k-100k, 14.6% for AGIs over 100k)
Earned income credit: $1,667 (reported on 12.9% of returns)
Here:
$1,667
State:
$1,788
Percentage of individuals using paid preparers for their 2004 taxes: 66.7%
Here:
67%
State:
61%
(% for various income ranges: 54.1% for AGIs below $10k, 72.0% for AGIs $10k-25k, 69.4% for AGIs $25k-50k, 68.8% for AGIs $50k-75k, 68.0% for AGIs $75k-100k, 66.0% for AGIs over 100k)
Likely homosexual households (counted as self-reported same-sex unmarried-partner households)
Lesbian couples: 1.1% of all households
Gay men: 0.0% of all households
Household received Food Stamps/SNAP in the past 12 months: 117 Household did not receive Food Stamps/SNAP in the past 12 months: 660
Women who had a birth in the past 12 months: 77 (10 now married, 66 unmarried) Women who did not have a birth in the past 12 months: 512 (182 now married, 331 unmarried)
Housing units in zip code 61012 with a mortgage: 432 (32 second mortgage, 30 both second mortgage and home equity loan) Houses without a mortgage: 29
Median monthly owner costs for units with a mortgage: $1,287 Median monthly owner costs for units without a mortgage: $660
Residents with income below the poverty level in 2022:
This zip code:
8.3%
Whole state:
11.9%
Residents with income below 50% of the poverty level in 2022:
This zip code:
2.8%
Whole state:
5.7%
Median number of rooms in houses and condos:
Here:
5.8
State:
6.4
Median number of rooms in apartments:
Here:
5.5
State:
4.1
Notable locations in this zip code not listed on our city pages
Cemeteries: Capron Cemetery (1), Russellville Cemetery (2), Long Prairie Cemetery (3), County Line Cemetery (4), Tound Prairie Cemetery (5), Chester Cemetery (6). Display/hide their locations on the map
Size of family households: 157 2-persons, 174 3-persons, 167 4-persons, 57 5-persons, 34 6-persons, 16 7-or-more-persons
Size of nonfamily households: 145 1-person, 14 2-persons, 2 3-persons
297 married couples with children.
242 single-parent households (193 men, 49 women).
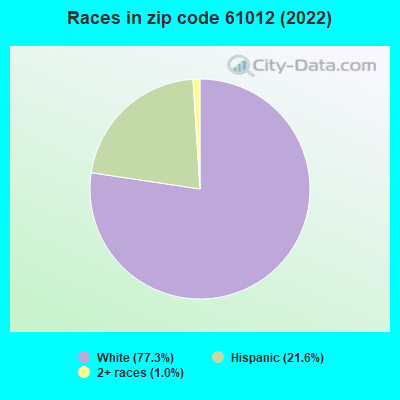
82.1% of residents of 61012 zip code speak English at home.
17.3% of residents speak Spanish at home (53% very well, 36% well, 7% not well, 5% not at all).
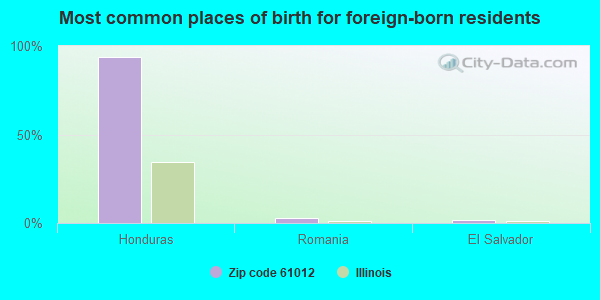
Foreign born population: 215 (9.0%) (21.5% of them are naturalized citizens)
This zip code:
9.0%
Whole state:
14.4%
94%Honduras
3%Romania
2%El Salvador
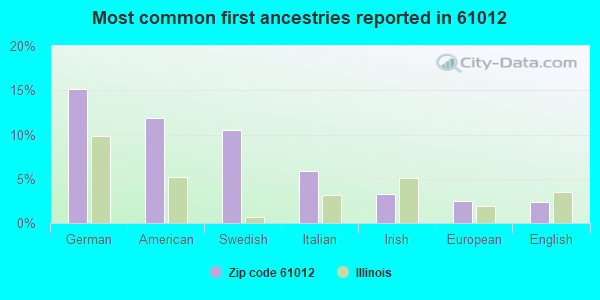
15%German
12%American
10%Swedish
6%Italian
3%Irish
3%European
2%English
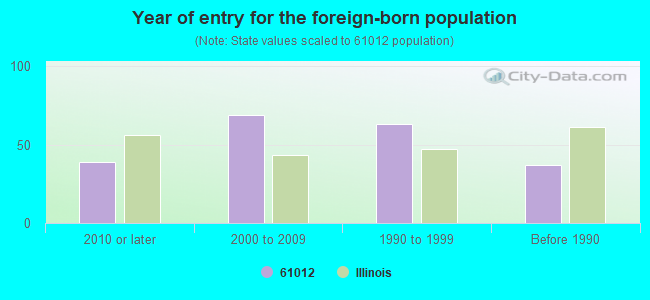
Year of entry for the foreign-born population
392010 or later
692000 to 2009
631990 to 1999
37Before 1990
Facilities with environmental interests located in this zip code:
KKO INC (100 GROVE ST in CAPRON, IL)
STATE MASTER (Illinois EPA Project) - SOLID WASTE PROGRAM, HAZARDOUS WASTE PROGRAM National Pollutant Discharge Elimination System NON-MAJOR (Tracking pollutant discharge elimination systems) - permit Conditionally Exempt Small Quantity Generators, less than 100 kg/month of hazardous waste (Resource Conservation and Recovery Act (tracking hazardous waste)) - notification Organizations: KEATING OF CHICAGO INC (CONTACT/OWNER)
, ELIZA KEATIONG MORAVEC (CONTACT/OWNER)
JOE OCELLO (115 N. FIFTH STREET in CAPRON, IL)
STATE MASTER (Illinois EPA Project) - AIR PROGRAM AIR MINOR (AIRS/AFS) Business SIC classification: NONCLASSIFIABLE ESTABLISHMENTS
AT AND T LONG LINES CAPRON (3 M W SHARON WI 75S OFST in CAPRON, IL)
(Resource Conservation and Recovery Act (tracking hazardous waste)) Organizations: AMERICAN TELEPHONE AND TELEGRAPH (CONTACT/OWNER)
OMAK MFG INC (145 OGDEN AVE in CAPRON, IL)
Conditionally Exempt Small Quantity Generators, less than 100 kg/month of hazardous waste (Resource Conservation and Recovery Act (tracking hazardous waste)) - notification Organizations: OMAK CO INC (CONTACT/OWNER)
Housing units lacking complete plumbing facilities: 2.3% Housing units lacking complete kitchen facilities: 2.3%
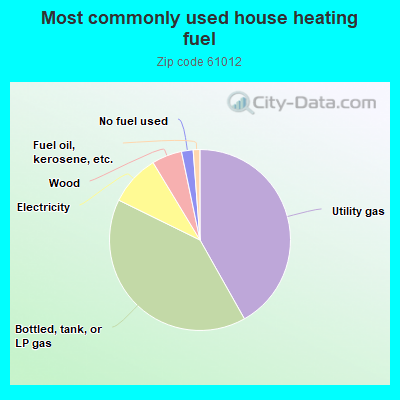
42.0%Utility gas
40.6%Bottled, tank, or LP gas
9.1%Electricity
5.4%Wood
2.1%No fuel used
1.2%Fuel oil, kerosene, etc.
Population in 1990: 1,893. Population change in the 1990s: +40 (+2.1%).
Place of birth for U.S.-born residents:
This state: 1,732
Northeast: 27
Midwest: 276
South: 59
West: 77
56% of the 61012 zip code residents lived in the same house 5 years ago. Out of people who lived in different houses, 26% lived in this county. Out of people who lived in different counties, 50% lived in Illinois.
95% of the 61012 zip code residents lived in the same house 1 year ago. Out of people who lived in different houses, 27% moved from this county. Out of people who lived in different houses, 64% moved from different county within same state. Out of people who lived in different houses, 12% moved from different state.
Private vs. public school enrollment:
Students in private schools in grades 1 to 8 (elementary and middle school): 15
Here:
8.7%
Illinois:
13.3%
Students in private schools in grades 9 to 12 (high school): 2
Here:
1.6%
Illinois:
9.9%
Students in private undergraduate colleges: 5
Here:
11.0%
Illinois:
27.4%
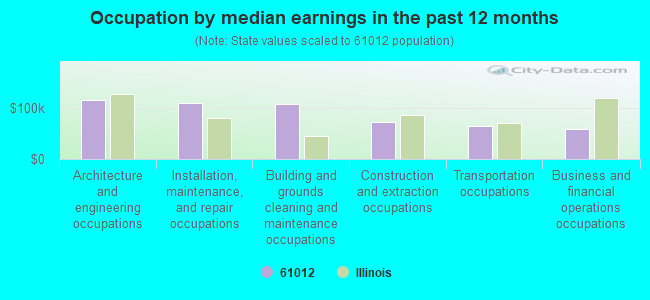
Occupation by median earnings in the past 12 months ($)
116,950Architecture and engineering occupations
110,418Installation, maintenance, and repair occupations
107,764Building and grounds cleaning and maintenance occupations
73,625Construction and extraction occupations
64,903Transportation occupations
59,240Business and financial operations occupations
Top industries in this zip code by the number of employees in 2005:
Health Care and Social Assistance: Ambulance Services (20-49 employees: 1 establishment)
Construction: Poured Concrete Foundation and Structure Contractors (10-19: 1)
Finance and Insurance: Commercial Banking (5-9: 1)
Accommodation and Food Services: Full-Service Restaurants (1-4: 1)
Construction: New Single-Family Housing Construction (except Operative Builders) (1-4: 1)
Fatal accident statistics in 2014:
Fatal accident count: 1
Vehicles involved in fatal accidents: 2
Fatal accidents caused by drunken drivers: 0
Fatalities: 2
Persons involved in fatal accidents: 8
Pedestrians involved in fatal accidents: 0
Fatal accident statistics in 2013:
Fatal accident count: 1
Vehicles involved in fatal accidents: 2
Fatal accidents caused by drunken drivers: 0
Fatalities: 1
Persons involved in fatal accidents: 2
Pedestrians involved in fatal accidents: 0
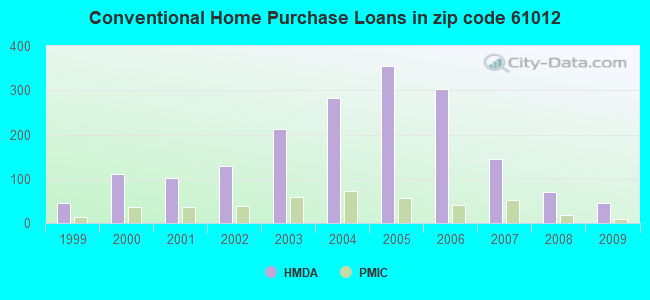
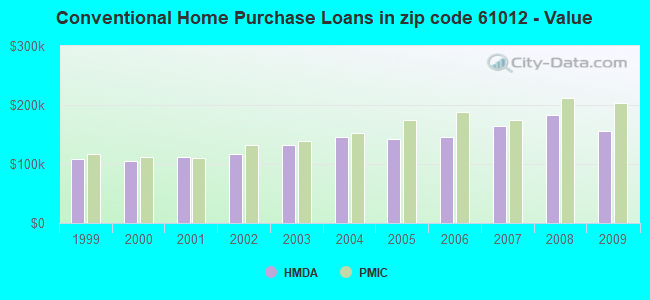
Home Mortgage Disclosure Act Aggregated Statistics For Year 2009 (Based on 2 partial tracts)
A) FHA, FSA/RHS & VA Home Purchase Loans
B) Conventional Home Purchase Loans
C) Refinancings
D) Home Improvement Loans
F) Non-occupant Loans on < 5 Family Dwellings (A B C & D)
G) Loans On Manufactured Home Dwelling (A B C & D)
Number
Average Value
Number
Average Value
Number
Average Value
Number
Average Value
Number
Average Value
Number
Average Value
LOANS ORIGINATED
47
$128,107
46
$156,463
353
$173,112
9
$77,499
23
$119,054
1
$11,310
APPLICATIONS APPROVED, NOT ACCEPTED
5
$116,554
4
$269,165
31
$176,783
1
$8,620
3
$140,573
0
$0
APPLICATIONS DENIED
10
$116,284
8
$196,791
101
$169,910
5
$30,162
9
$146,978
1
$19,390
APPLICATIONS WITHDRAWN
5
$112,890
6
$184,830
67
$167,344
1
$5,390
3
$68,223
0
$0
FILES CLOSED FOR INCOMPLETENESS
0
$0
1
$152,960
19
$162,601
1
$8,080
0
$0
0
$0
Aggregated Statistics For Year 2008 (Based on 2 partial tracts)
A) FHA, FSA/RHS & VA Home Purchase Loans
B) Conventional Home Purchase Loans
C) Refinancings
D) Home Improvement Loans
E) Loans on Dwellings For 5+ Families
F) Non-occupant Loans on < 5 Family Dwellings (A B C & D)
G) Loans On Manufactured Home Dwelling (A B C & D)
Number
Average Value
Number
Average Value
Number
Average Value
Number
Average Value
Number
Average Value
Number
Average Value
Number
Average Value
LOANS ORIGINATED
32
$150,000
69
$183,553
198
$174,321
14
$53,899
1
$323,160
19
$133,544
2
$24,775
APPLICATIONS APPROVED, NOT ACCEPTED
4
$123,205
8
$236,782
32
$152,104
3
$113,107
0
$0
2
$188,240
0
$0
APPLICATIONS DENIED
11
$150,465
16
$172,487
141
$183,632
10
$126,625
1
$678,640
8
$234,964
4
$33,662
APPLICATIONS WITHDRAWN
4
$167,235
8
$163,061
41
$185,567
4
$82,002
0
$0
3
$116,157
0
$0
FILES CLOSED FOR INCOMPLETENESS
1
$116,340
2
$128,995
15
$172,101
1
$84,020
0
$0
2
$139,230
0
$0
Aggregated Statistics For Year 2007 (Based on 2 partial tracts)
A) FHA, FSA/RHS & VA Home Purchase Loans
B) Conventional Home Purchase Loans
C) Refinancings
D) Home Improvement Loans
E) Loans on Dwellings For 5+ Families
F) Non-occupant Loans on < 5 Family Dwellings (A B C & D)
G) Loans On Manufactured Home Dwelling (A B C & D)
Number
Average Value
Number
Average Value
Number
Average Value
Number
Average Value
Number
Average Value
Number
Average Value
Number
Average Value
LOANS ORIGINATED
11
$156,096
144
$164,464
234
$157,306
22
$47,886
2
$201,435
32
$152,828
2
$36,085
APPLICATIONS APPROVED, NOT ACCEPTED
1
$91,020
15
$142,765
33
$170,393
6
$82,855
0
$0
2
$74,595
1
$29,080
APPLICATIONS DENIED
3
$194,257
24
$151,504
175
$161,712
24
$72,217
0
$0
5
$120,862
4
$93,718
APPLICATIONS WITHDRAWN
2
$164,810
18
$165,889
70
$170,036
2
$88,060
0
$0
4
$136,670
0
$0
FILES CLOSED FOR INCOMPLETENESS
1
$147,580
6
$200,628
21
$136,369
1
$123,880
0
$0
1
$262,840
0
$0
Aggregated Statistics For Year 2006 (Based on 2 partial tracts)
A) FHA, FSA/RHS & VA Home Purchase Loans
B) Conventional Home Purchase Loans
C) Refinancings
D) Home Improvement Loans
F) Non-occupant Loans on < 5 Family Dwellings (A B C & D)
G) Loans On Manufactured Home Dwelling (A B C & D)
Number
Average Value
Number
Average Value
Number
Average Value
Number
Average Value
Number
Average Value
Number
Average Value
LOANS ORIGINATED
17
$164,495
302
$146,126
245
$148,713
31
$64,597
41
$148,443
2
$24,235
APPLICATIONS APPROVED, NOT ACCEPTED
1
$182,050
39
$127,137
37
$129,016
4
$40,932
6
$137,523
0
$0
APPLICATIONS DENIED
3
$177,560
66
$112,608
194
$141,860
27
$58,727
15
$105,925
3
$34,470
APPLICATIONS WITHDRAWN
1
$110,950
31
$137,048
111
$162,177
2
$132,765
5
$152,962
0
$0
FILES CLOSED FOR INCOMPLETENESS
0
$0
10
$206,553
19
$137,031
2
$74,865
2
$568,490
0
$0
Aggregated Statistics For Year 2005 (Based on 2 partial tracts)
A) FHA, FSA/RHS & VA Home Purchase Loans
B) Conventional Home Purchase Loans
C) Refinancings
D) Home Improvement Loans
F) Non-occupant Loans on < 5 Family Dwellings (A B C & D)
G) Loans On Manufactured Home Dwelling (A B C & D)
Number
Average Value
Number
Average Value
Number
Average Value
Number
Average Value
Number
Average Value
Number
Average Value
LOANS ORIGINATED
17
$156,194
355
$142,506
302
$140,316
44
$64,938
41
$123,221
3
$23,700
APPLICATIONS APPROVED, NOT ACCEPTED
1
$68,400
43
$120,747
51
$138,188
5
$55,044
5
$100,610
2
$35,550
APPLICATIONS DENIED
4
$154,175
73
$123,679
209
$138,036
34
$46,906
8
$141,719
6
$29,623
APPLICATIONS WITHDRAWN
2
$128,995
57
$143,135
138
$153,017
21
$189,639
6
$114,542
1
$14,540
FILES CLOSED FOR INCOMPLETENESS
0
$0
9
$122,142
36
$135,862
2
$41,470
1
$23,160
0
$0
Aggregated Statistics For Year 2004 (Based on 2 partial tracts)
A) FHA, FSA/RHS & VA Home Purchase Loans
B) Conventional Home Purchase Loans
C) Refinancings
D) Home Improvement Loans
F) Non-occupant Loans on < 5 Family Dwellings (A B C & D)
G) Loans On Manufactured Home Dwelling (A B C & D)
Number
Average Value
Number
Average Value
Number
Average Value
Number
Average Value
Number
Average Value
Number
Average Value
LOANS ORIGINATED
35
$144,052
282
$146,442
268
$132,136
25
$39,490
39
$112,650
2
$57,900
APPLICATIONS APPROVED, NOT ACCEPTED
7
$139,036
38
$143,820
39
$119,611
6
$55,387
3
$91,203
1
$26,930
APPLICATIONS DENIED
3
$143,627
50
$124,492
165
$127,149
31
$29,779
6
$91,113
3
$42,910
APPLICATIONS WITHDRAWN
5
$131,634
24
$145,848
119
$138,153
9
$49,312
4
$170,332
0
$0
FILES CLOSED FOR INCOMPLETENESS
1
$60,860
11
$133,671
18
$130,880
3
$46,500
0
$0
0
$0
Aggregated Statistics For Year 2003 (Based on 2 partial tracts)
A) FHA, FSA/RHS & VA Home Purchase Loans
B) Conventional Home Purchase Loans
C) Refinancings
D) Home Improvement Loans
E) Loans on Dwellings For 5+ Families
F) Non-occupant Loans on < 5 Family Dwellings (A B C & D)
Number
Average Value
Number
Average Value
Number
Average Value
Number
Average Value
Number
Average Value
Number
Average Value
LOANS ORIGINATED
52
$128,560
213
$131,575
531
$123,653
18
$43,118
0
$0
33
$89,261
APPLICATIONS APPROVED, NOT ACCEPTED
2
$113,105
18
$125,404
57
$128,357
3
$47,217
1
$47,400
3
$78,817
APPLICATIONS DENIED
3
$112,387
24
$93,222
155
$118,235
20
$20,817
0
$0
3
$196,410
APPLICATIONS WITHDRAWN
6
$124,417
19
$140,943
97
$118,864
3
$23,160
0
$0
1
$74,330
FILES CLOSED FOR INCOMPLETENESS
2
$120,915
4
$136,670
21
$123,288
2
$24,235
0
$0
2
$89,675
Aggregated Statistics For Year 2002 (Based on 2 partial tracts)
A) FHA, FSA/RHS & VA Home Purchase Loans
B) Conventional Home Purchase Loans
C) Refinancings
D) Home Improvement Loans
F) Non-occupant Loans on < 5 Family Dwellings (A B C & D)
Number
Average Value
Number
Average Value
Number
Average Value
Number
Average Value
Number
Average Value
LOANS ORIGINATED
63
$117,757
129
$116,317
367
$120,601
18
$17,804
25
$96,194
APPLICATIONS APPROVED, NOT ACCEPTED
2
$129,805
11
$84,756
44
$113,118
2
$12,390
3
$61,400
APPLICATIONS DENIED
9
$112,687
21
$97,487
109
$109,133
12
$17,774
1
$64,630
APPLICATIONS WITHDRAWN
4
$140,845
11
$128,334
49
$117,008
2
$24,505
2
$101,255
FILES CLOSED FOR INCOMPLETENESS
1
$88,870
3
$105,387
16
$124,518
0
$0
1
$42,010
Aggregated Statistics For Year 2001 (Based on 2 partial tracts)
A) FHA, FSA/RHS & VA Home Purchase Loans
B) Conventional Home Purchase Loans
C) Refinancings
D) Home Improvement Loans
F) Non-occupant Loans on < 5 Family Dwellings (A B C & D)
Number
Average Value
Number
Average Value
Number
Average Value
Number
Average Value
Number
Average Value
LOANS ORIGINATED
53
$113,136
102
$112,478
320
$118,655
20
$28,600
13
$74,575
APPLICATIONS APPROVED, NOT ACCEPTED
3
$98,383
7
$99,641
31
$97,591
5
$23,914
1
$73,250
APPLICATIONS DENIED
4
$109,470
28
$73,230
102
$88,890
22
$24,825
3
$49,013
APPLICATIONS WITHDRAWN
3
$130,880
12
$159,740
58
$107,228
2
$16,160
2
$84,560
FILES CLOSED FOR INCOMPLETENESS
1
$57,090
4
$142,460
20
$96,517
1
$18,850
1
$18,850
Aggregated Statistics For Year 2000 (Based on 2 partial tracts)
A) FHA, FSA/RHS & VA Home Purchase Loans
B) Conventional Home Purchase Loans
C) Refinancings
D) Home Improvement Loans
F) Non-occupant Loans on < 5 Family Dwellings (A B C & D)
Number
Average Value
Number
Average Value
Number
Average Value
Number
Average Value
Number
Average Value
LOANS ORIGINATED
45
$108,354
111
$104,901
75
$99,347
25
$23,246
12
$86,715
APPLICATIONS APPROVED, NOT ACCEPTED
3
$99,103
6
$87,612
16
$88,196
12
$14,991
0
$0
APPLICATIONS DENIED
5
$106,858
25
$84,711
71
$68,395
29
$22,120
3
$51,707
APPLICATIONS WITHDRAWN
4
$94,660
15
$111,634
37
$78,155
3
$46,500
0
$0
FILES CLOSED FOR INCOMPLETENESS
1
$122,800
3
$103,590
15
$103,591
0
$0
0
$0
Aggregated Statistics For Year 1999 (Based on 1 partial tract)
A) FHA, FSA/RHS & VA Home Purchase Loans
B) Conventional Home Purchase Loans
C) Refinancings
D) Home Improvement Loans
F) Non-occupant Loans on < 5 Family Dwellings (A B C & D)
Detailed PMIC statistics for the following Tracts:0106.00
2002 - 2018 National Fire Incident Reporting System (NFIRS) incidents
According to the data from the years 2002 - 2018 the average number of fires per year is 13. The highest number of reported fire incidents - 29 took place in 2003, and the least - 2 in 2008. The data has a decreasing trend.
When looking into fire subcategories, the most incidents belonged to: Outside Fires (52.5%), and Structure Fires (32.3%).
Fire incident types reported to NFIRS in Zip Code 61012


 Nearest zip codes: 61065, 61011, 53585, 61038, 60033, 53525.
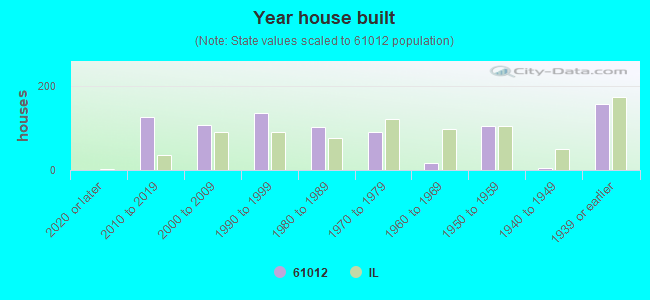


 According to the data from the years 2002 - 2018 the average number of fires per year is 13. The highest number of reported fire incidents - 29 took place in 2003, and the least - 2 in 2008. The data has a decreasing trend.
 When looking into fire subcategories, the most incidents belonged to: Outside Fires (52.5%), and Structure Fires (32.3%).